. 2021 Mar 16;118(11):e2017435118.
doi: 10.1073/pnas.2017435118.

Membrane bending by protein phase separation

Affiliations

Membrane bending by protein phase separation

Feng Yuan et al. Proc Natl Acad Sci U S A. .

Abstract

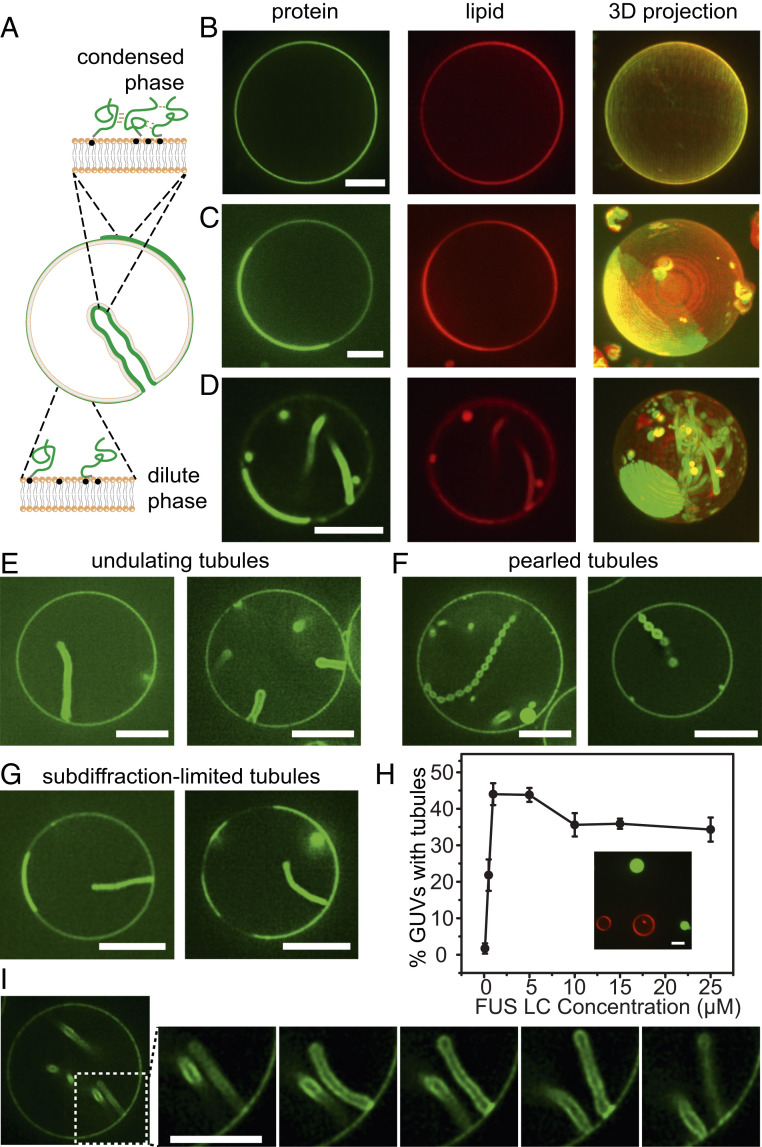
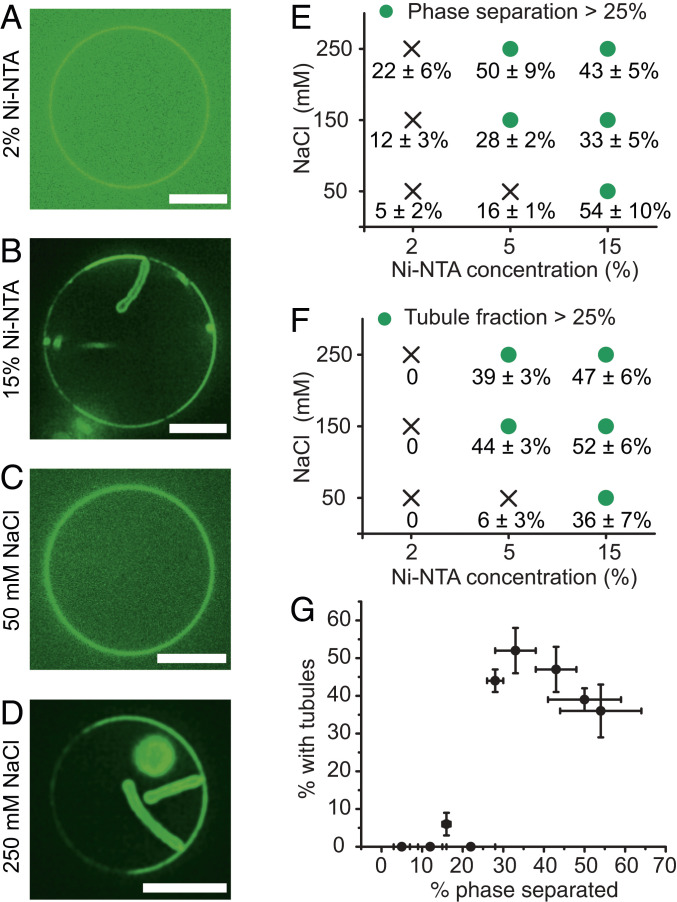
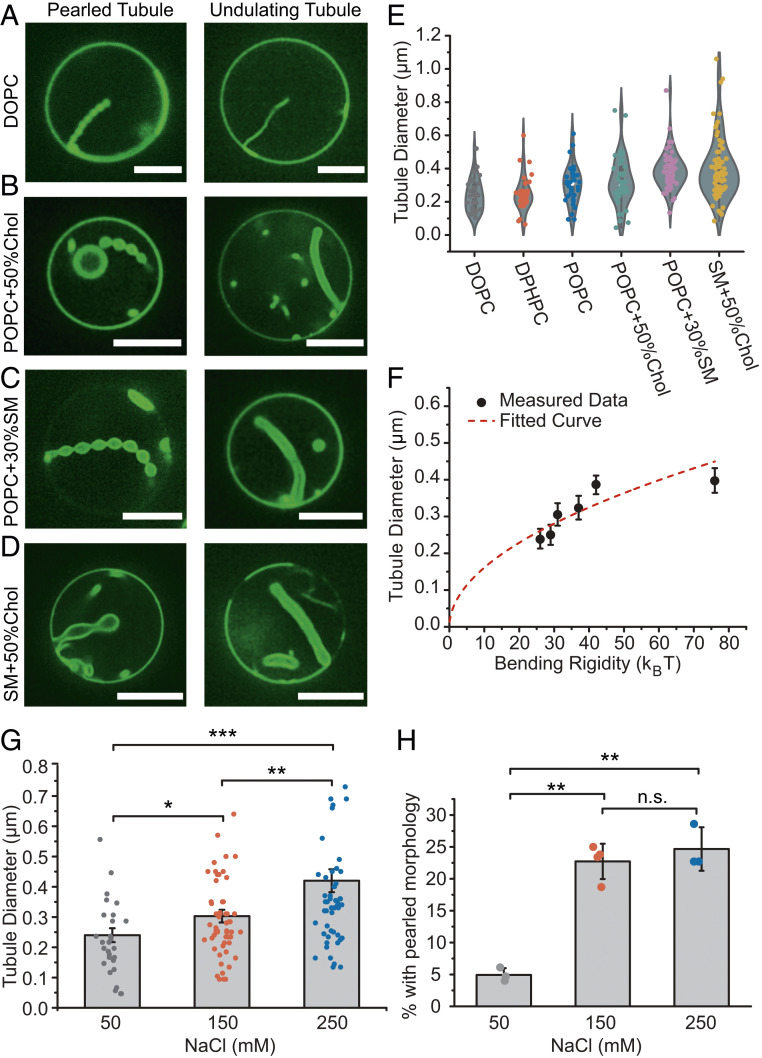
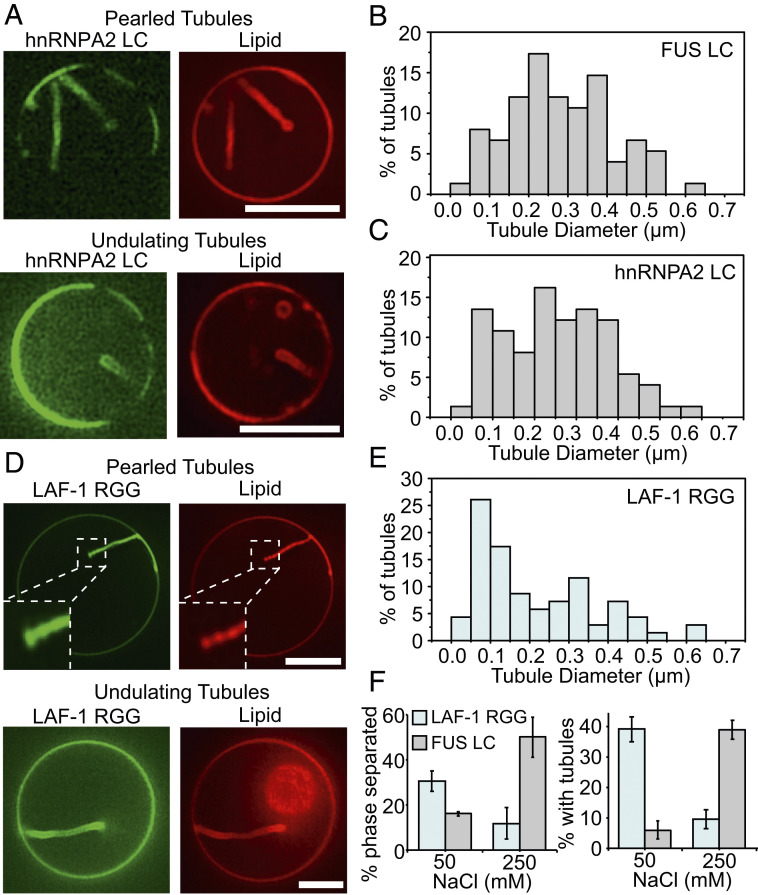
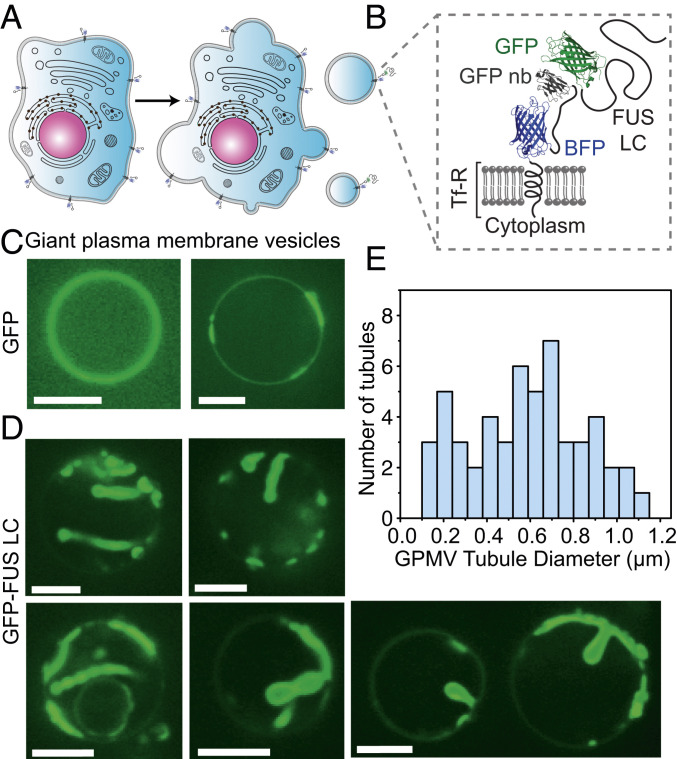
Membrane bending is a ubiquitous cellular process that is required for membrane traffic, cell motility, organelle biogenesis, and cell division. Proteins that bind to membranes using specific structural features, such as wedge-like amphipathic helices and crescent-shaped scaffolds, are thought to be the primary drivers of membrane bending. However, many membrane-binding proteins have substantial regions of intrinsic disorder which lack a stable three-dimensional structure. Interestingly, many of these disordered domains have recently been found to form networks stabilized by weak, multivalent contacts, leading to assembly of protein liquid phases on membrane surfaces. Here we ask how membrane-associated protein liquids impact membrane curvature. We find that protein phase separation on the surfaces of synthetic and cell-derived membrane vesicles creates a substantial compressive stress in the plane of the membrane. This stress drives the membrane to bend inward, creating protein-lined membrane tubules. A simple mechanical model of this process accurately predicts the experimentally measured relationship between the rigidity of the membrane and the diameter of the membrane tubules. Discovery of this mechanism, which may be relevant to a broad range of cellular protrusions, illustrates that membrane remodeling is not exclusive to structured scaffolds but can also be driven by the rapidly emerging class of liquid-like protein networks that assemble at membranes.

Keywords: membrane biophysics; membrane curvature; protein phase separation.


Conflict of interest statement

The authors declare no competing interest.

Figures

Fig. 1.
Fig. 1.
Protein phase separation on membranes drives assembly of protein-lined tubules. (A) Pictorial representation of his-FUS LC liquid–liquid protein phase separation on GUV membranes and inward tubule formation. Green lines represent FUS LC proteins. Gray domains indicated 6×histidine tags, and the black dots indicate Ni-NTA lipids. (BG) Representative superresolution images of GUVs incubated with 0.5 μM (B) and 1 μM atto-488–labeled his-FUS LC (CG) in 25 mM Hepes, 150 mM NaCl buffer, pH 7.4. (BD) Representative confocal images (lipid and protein channels) and corresponding maximum intensity projects of GUVs incubated with his-FUS LC. Some GUVs are covered uniformly by the protein (B), while others display 2D liquid–liquid phase separation (C), which is frequently correlated with the formation of lipid tubules (D). (EG) Three kinds of membrane tubule structures were observed: undulating tubules (E), tubules consisting of a string of pearls (F), and subdiffraction limited tubules, the structure of which cannot be clearly resolved (G). GUV membrane composition: 93 mol% POPC, 5 mol% Ni-NTA, 2 mol% DP-EG10 biotin, and 0.1 mol% Texas Red-DHPE. (H) The fraction of GUVs displaying inward tubules as a function of his-FUS LC concentration. Data represent mean ± SD, n = 3 independent experiments, and n > 100 GUVs were acquired in each replicate. When the addition of his-FUS LC was greater than 5 μM, protein droplets were observed in the surrounding medium (Inset in H). (I) Confocal image series illustrating dynamic fluctuations in tubule shape. (Scale bars, 5 μm.)
Fig. 2.
Fig. 2.
Protein phase separation and tubule formation depend on the concentration of membrane-bound proteins and the strength of protein–protein interactions. (A) Representative confocal images of FUS LC bound to GUVs (composition: 96 mol% POPC, 2 mol% Ni-NTA, 2 mol% DP-EG10-biotin, and 0.1 mol% Texas Red-DHPE) containing 2 mol% Ni-NTA, and (B) GUVs (composition: 83 mol% POPC, 15 mol% Ni-NTA, 2 mol% DP-EG10-biotin, and 0.1 mol% Texas Red-DHPE) containing 15% Ni-NTA. GUVs were incubated with 1 μM Atto-488–labeled his-FUS LC in 25 mM Hepes, 150 mM NaCl pH 7.4 buffer. (C and D) Representative images of GUVs (93 mol% POPC, 5 mol% Ni-NTA, 2 mol% DP-EG10 biotin, and 0.1 mol% Texas Red-DHPE made in 560 mOsmo glucose solution) incubated with 1 μM atto-488–labeled FUS LC in 25 mM Hepes pH 7.4 buffer containing (C) 50 mM and (D) 250 mM NaCl, respectively. Glucose was added to the buffers accordingly to maintain osmotic pressure balance. (Scale bars, 5 μm.) (E and F) Percentage of GUVs displaying (E) protein phase separation and (F) inward lipid tubules as a function of Ni-NTA content and NaCl concentration. Green dots indicate fractions exceeding 25%. (G) Percentage of all GUVs that formed inward tubules as a function of percentage of GUVs with phase separation. Here, the Pearson’s correlation coefficient between phase separation and tubule formation was 0.8. Data are shown as mean value ± SD. n > 100 GUVs were analyzed cumulatively from three independent replicates for each condition. Approximately 18 ± 1% for vesicles containing 15% Ni-NTA and exposed to 1 μM FUS LC displayed both phase-separated regions and membrane tubules.
Fig. 3.
Fig. 3.
Mechanical model of undulating and pearled tubule formation. (A) Unduloid-like shapes solution for Helfrich energy minimization at different values of nondimensional parameter, α. For α ∼0.75, the membrane takes on a cylindrical shape (purple line); for α > 0.75, the unduloid becomes a sphere similar to a string of pearls (gray line). (B) Schematic depiction of membrane tubule formation due to the compressive stresses applied by liquid–liquid phase separation on the membrane. On a flat membrane, the density of protein segments decreases with increasing distance from the membrane surface, such that x is greater than x’. Therefore, if the membrane remains flat, there will be an increasing number of unsatisfied potential protein–protein interactions as distance from the surface increases. These unsatisfied interactions create a driving force for membrane bending, which increases the density of protein segments at a distance from the membrane (x’ < x), leading to more overlap among the proteins and stronger protein–protein interactions. (C) Schematic of the axisymmetric simulations depicting the simulation domain and the boundary conditions. The yellow region represents the bare membrane, and the green region is the area coated by the proteins. The dashed lines indicate the cap of the tubule, assumed to have a constant curvature. The inset shows the spontaneous curvature distribution along the tubule region used to model the membrane shape. (D) Undulating tubules minimize the membrane bending energy as the spontaneous curvature increases for uniform bending rigidity of the membrane (κ = 80 kBT). (E) Percentage of change in the tubule diameter ((D−Dκ = 25 kBT)/Dκ = 25 kBT) as a function of the bending rigidity for three different values of spontaneous curvature. The dashed lines show a square root dependence on the bending modulus by fitting to the curve (Aκ+B), where for the gray line, A = 5.4, B = −26.44; for the pink line, A = 2.71, B = −12.9; and for the blue line, A = 1.53 and B = −7.4. (F) Pearled tubules minimize the bending energy of the membrane for heterogeneous membrane rigidity (κratio= κprotein-domain/κbare membrane), C0 = 3.5 μm−1. (G) Percentage of change in the tubule diameter ((D − Dκ = 25 kBT)/Dκ = 25 kBT) as a function of the bending rigidity for three different values of spontaneous curvature for κratio = 20. The dashed lines are the fitted curve (Aκ+B), where for the gray line, A = 10.98, B = −51.31; for the pink line, A = 4.22, B = −19.58; and for the blue line, A = 3.1 and B = −13.
Fig. 4.
Fig. 4.
Tubule diameter varies with membrane bending rigidity and salt concentration. (AF) Six groups of GUVs with different compositions (listed in SI Appendix, Table S4 and SI Appendix, Materials and Methods) were used to vary membrane bending rigidity. GUVs were incubated with 1 μM atto-488–labeled his-FUS LC in 25 mM Hepes, 150 mM NaCl, pH 7.4 buffer. (AD) Representative superresolution confocal images tubules with pearled (Left) and undulating morphologies (Right), from GUVs consisting primarily of (A) DOPC, (B) POPC + 50% Chol, (C) POPC + 30% SM, and (D) SM + 50% Chol. (Scale bars, 5 μm.) (E) Violin plot showing the measured tubule diameter distribution for tubules formed using each GUV composition. (F) GUV tubule diameter as a function of membrane bending rigidity. Data points from left to right represent DOPC, DPHPC, POPC, POPC + 50% Chol, POPC + 30% SM, and SM + 50% Chol, respectively. Data are displayed as mean ± SE from at least 60 tubules per composition, gathered during three independent experiments. The measured tubule diameters increase roughly as the square root of membrane bending rigidity (red dash line, R2 = 0.64). (G) Bar chart displaying average tubule diameter under different NaCl concentrations. GUVs (composition: 83 mol% POPC, 15 mol% Ni-NTA, 2 mol% DP-EG10-biotin, and 0.1% Texas Red-DHPE) were incubated with 1 μM atto-488–labeled his-FUS LC in 25 mM Hepes, pH 7.4 buffer with corresponding NaCl concentration under iso-osmotic conditions. Error bars correspond to SE. Each point is a mean value of diameters measured at three positions along the same tubule. n > 100 GUVs were acquired cumulatively from three independent replicates for each condition. (H) Fraction of tubules that displayed a pearled morphology as a function of NaCl concentration. Data are displayed as mean ± SD from three independent experiments (n = 3) on separate preparations of vesicles, with cumulatively n > 100 vesicles categorized. Brackets show statistically significant comparisons using an unpaired, two-tailed Student’s t test. *P < 0.05, **P < 0.01, ***P < 0.001, and n.s. indicates a difference that was not statistically significant.
Fig. 5.
Fig. 5.
hnRNPA2 LC and Laf-1 RGG domains drive formation of inwardly directed membrane tubules with similar morphologies to those formed by FUS LC. (A) his-hnRNPA2 LC at a concentration of 1 μM drove formation of inwardly directed tubules with pearled and undulating morphologies when introduced to GUVs consisting of 83 mol% POPC, 15 mol% Ni-NTA, 2 mol% DP-EG10 biotin, and 0.1 mol% Texas Red-DHPE. (B) Distribution of tubule diameters formed upon exposure of GUVs to his-FUS LC, 75 total tubules. (C) Distribution of tubule diameters formed upon exposure of GUVs to his-hnRNPA2 LC, 75 total tubules. (D) his-Laf-1 RGG at a concentration of 1 μM drove formation of inwardly directed tubules with pearled and undulating morphologies when introduced to GUVs of the same composition as in A. (E) Distribution of tubule diameters formed upon exposure of GUVs to his-Laf-1 RGG, 70 total tubules. (F) The fraction of vesicles exhibiting two-dimensional protein phase separation and tubule formation by his-Laf-1 RGG decreased with increasing salt concentration. This is the opposite trend of that observed for vesicles exposed to his-FUS LC (data repeated from Fig. 2 E and F, for comparison). Error bars represent the SD of three trials, with cumulatively n > 300 GUVs analyzed. (Scale bar in A and D, 5 μm.)
Fig. 6.
Fig. 6.
Protein phase separation can drive tubule formation from cell-derived membranes. (A) Cartoon showing extraction of GPMVs from donor RPE cells. (B) Schematic of the architecture of the membrane receptor and ligand protein. GFP-FUS LC is recruited to the GPMV membrane by binding to a GFP nanobody displayed on the cell surface. (C) Confocal images of GPMVs incubated with 2 μM GFP and (D) GFP-FUS LC in buffer containing 10 mM Hepes, 2 mM CaCl2, 150 mM NaCl, pH 7.4. (Scale bar, 5 μm.) (E) Distribution of diameters of tubules formed from GPMVs. n = 50 tubules measured.

References

    1. Kirchhausen T., Owen D., Harrison S. C., Molecular structure, function, and dynamics of clathrin-mediated membrane traffic. Cold Spring Harb. Perspect. Biol. 6, a016725 (2014). - PMC - PubMed
    1. Mattila P. K., Lappalainen P., Filopodia: Molecular architecture and cellular functions. Nat. Rev. Mol. Cell Biol. 9, 446–454 (2008). - PubMed
    1. Hurley J. H., Boura E., Carlson L.-A., Różycki B., Membrane budding. Cell 143, 875–887 (2010). - PMC - PubMed
    1. Zimmerberg J., Kozlov M. M., How proteins produce cellular membrane curvature. Nat. Rev. Mol. Cell Biol. 7, 9–19 (2006). - PubMed
    1. Stachowiak J. C., Brodsky F. M., Miller E. A., A cost-benefit analysis of the physical mechanisms of membrane curvature. Nat. Cell Biol. 15, 1019–1027 (2013). - PMC - PubMed

Publication types

Substances