. 2021 Apr 23;372(6540):363-370.
doi: 10.1126/science.abg8663. Epub 2021 Mar 9.

Epidemiological and evolutionary considerations of SARS-CoV-2 vaccine dosing regimes

Affiliations

Epidemiological and evolutionary considerations of SARS-CoV-2 vaccine dosing regimes

Chadi M Saad-Roy et al. Science. .

Abstract

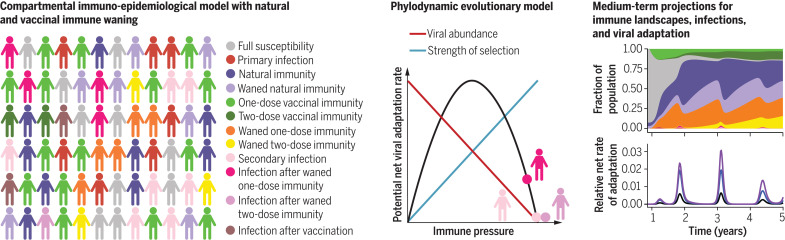
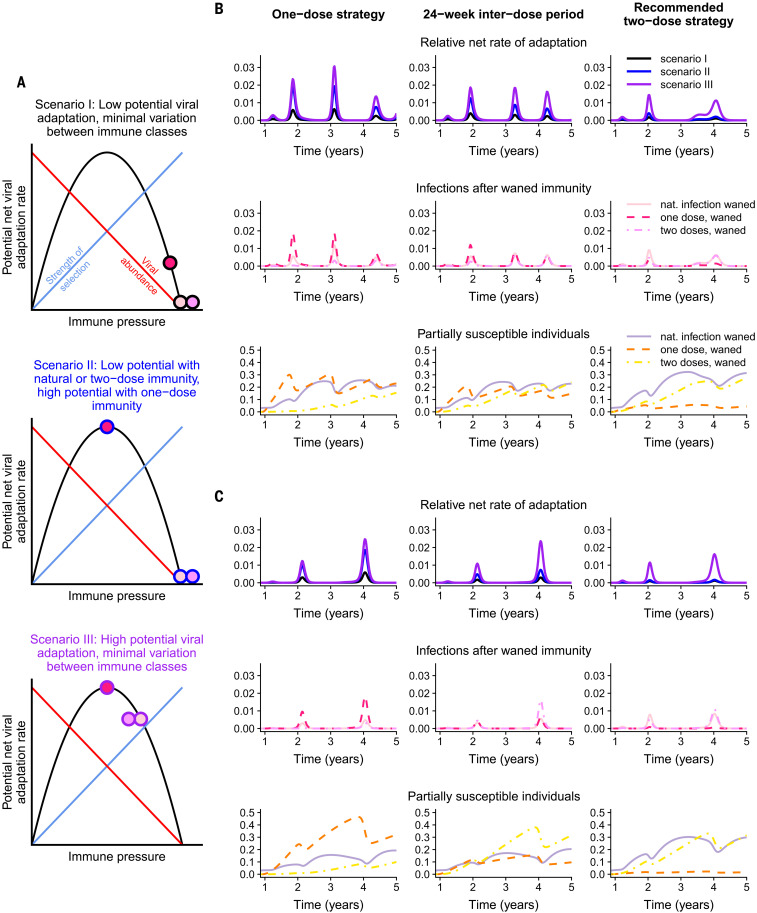
Given vaccine dose shortages and logistical challenges, various deployment strategies are being proposed to increase population immunity levels to severe acute respiratory syndrome coronavirus 2 (SARS-CoV-2). Two critical issues arise: How timing of delivery of the second dose will affect infection dynamics and how it will affect prospects for the evolution of viral immune escape via a buildup of partially immune individuals. Both hinge on the robustness of the immune response elicited by a single dose as compared with natural and two-dose immunity. Building on an existing immuno-epidemiological model, we find that in the short term, focusing on one dose generally decreases infections, but that longer-term outcomes depend on this relative immune robustness. We then explore three scenarios of selection and find that a one-dose policy may increase the potential for antigenic evolution under certain conditions of partial population immunity. We highlight the critical need to test viral loads and quantify immune responses after one vaccine dose and to ramp up vaccination efforts globally.


Figures

None
The relative robustness of one- or two-dose vaccinal immunity and natural immunity shape future epidemiological and evolutionary outcomes for SARS-CoV-2.
An immuno-epidemiological model (left) coupled with a phylodynamic model (middle) is used to explore projections for COVID-19 infection burden and immune landscapes (top right) and potential rates of SARS-CoV-2 viral adaptation (bottom right) in the medium term. The accompanying online interactive application (http://grenfelllab.princeton.edu/sarscov2vaccine) can be used to explore these projections for a broad range of model parameters.
Fig. 1
Fig. 1. Description of the extended immuno-epidemiological model with one- and two-dose vaccination regimes.
Based on (13). (A) Model flow chart depicting transitions between immune classes (see main text and materials and methods for a full description of the immune classes and parameters). (B) Diagram of the interdose period (1ω) between the first and second vaccine doses and its relationship to the rate of administration of the first vaccine dose ν. The maximum achievable rate is ν0 for a fully one-dose strategy, and ν is assumed to decrease exponentially to its lowest value ν0/2 when a fully two-dose strategy with interdose period corresponding to the clinical recommendation (Lopt) is used. (C) Representative schematic of societal composition of various immune classes for the SIR(S) model with no vaccination (left), the extended model with a short interdose period (middle), and the extended model with a long interdose period (right).
Fig. 2
Fig. 2. Synoptic medium-term immune landscapes and infection burden.
The immune and infection class colors are the same as in Fig. 1A. Each panel shows the following: (Top) Illustrative time series of the fraction of the population vaccinated with one or two doses [see (56)]. (Middle) The fraction of total and severe infections [see (57)]. (Bottom) Area plots of the fraction of the population that makes up each immune class (SP, R, SS, V1, V2, SS1, SS2) or infection class (IP, IS, IV, IS1, IS2) from just before the introduction of vaccination until 5 years after onset of the pandemic. In all plots, the maximum rate of administration of the first vaccine dose is taken to be ν0 = 2%, and the vaccine is introduced at tvax = 48 weeks. We take ϵV1=0.1 and ϵV2=0.05, in keeping with data from clinical trials (3). The fraction of severe cases for primary infections, secondary infections, infection after vaccination, and infection after waned two-dose immunity are taken to be xsev,p=0.14, xsev,s=0.07, xsev,V=0.14, and xsev,2=0, respectively. The transmission rates and periods of NPI adoption are defined in the materials and methods. The leftmost column corresponds to a one-dose vaccine strategy (ω = 0), followed by interdose spacings of 24 weeks, 12 weeks, and 4 weeks (rightmost column). (A) An overall more pessimistic natural and vaccinal immunity scenario, with ϵ = ϵ2 = 0.7 and 1/δ = 1/ρ2 = 1 year. For a less effective one-dose vaccine (top section), we take ϵ1 = 0.9 and 1/ρ1 = 0.25 years, and the fraction of severe cases associated with infection after waned one-dose immunity is xsev,1=0.14. For an effective one-dose vaccine (bottom section), we take ϵ1 = 0.7 and 1/ρ1 = 1 year, and the fraction of severe cases associated with infection after waned one-dose immunity is xsev,1=0. (B) An overall more optimistic natural and vaccinal immunity scenario, with ϵ = ϵ2 = 0.5 and 1/δ = 1/ρ2 = 2 years. For a less effective one-dose vaccine (top section), we take ϵ1 = 0.9 and 1/ρ1 = 0.5 years, and the fraction of severe cases associated with infection after waned one-dose immunity is xsev,1=0.14. For an effective one-dose vaccine (bottom section), we take ϵ1 = 0.5 and 1/ρ1 = 2 years, and the fraction of severe cases associated with infection after waned one-dose immunity is xsev,1=0.
Fig. 3
Fig. 3. Heatmaps depicting various epidemiological outcomes contingent on dosing regimes.
(A) Cumulative severe (left) and total (right) case numbers relative to the scenario with no vaccine from the time of vaccine introduction through the end of the 5-year time period after onset of the pandemic as a function of the one-dose to two-dose immune response ratio xe and the interdose period. Parameters correspond to the weak immunity scenario of Fig. 2A, but xe sets the value of ϵ1, ρ1, and xsev,1. Specifically, we take ϵ1 = ϵ2 + (1 − xe)(1 − ϵ2) such that the susceptibility to infection after a waned single dose interpolates linearly between the value after waned two doses (ϵ2) when the one- and two-dose immune responses are equally strong (xe = 1) and unity (full susceptibility) when a single dose offers no immune protection (xe = 0). Similarly, we take xsev,1 = xsev,2 + (1 – xe)( xsev,Vxsev,2), such that the fraction of severe cases for infections after a waned single dose interpolates linearly between the value after waned two doses (xsev,2) when xe = 1 and the value after a (failed) vaccination xsev,V when xe = 0. Finally, ρ1 is given by ρ1 = ρ2/xe. (B) Values of νmin, the minimal rate of first dose administration per day such that for any ν > νmin the basic reproduction R0[ν]<1 and the disease cannot invade (see supplementary materials), as a function of the strength of immunity after one (ϵ1) and two (ϵ2) waned vaccines doses, for different interdose periods. We take the duration of one-dose and two-dose vaccinal immunity to be 1/ρ1 = 0.5 years and 1/ρ2 = 1 year, respectively, and set ϵV1=0.1 and ϵV2=0.05.
Fig. 4
Fig. 4. Potential viral evolution scenarios under different vaccine regimes.
(A) Schematic representations of the potential net viral adaptation rate associated with the IS, IS1, and IS2 infection classes under three different scenarios. These are illustrated by the filled circles, with the inside color denoting the infection class and corresponding to the legend in Fig. 1A. The circle borders correspond to the three scenarios considered (scenario I: black, top panel; scenario II: blue, middle panel; and scenario III: purple, bottom panel). The phylodynamic model for potential viral adaptation as a function of immune pressure is adapted from (17). (B and C) Relative net rates of adaptation [top rows; colors correspond to the scenarios in (A)] and composition of associated infection classes (middle rows; IS, solid lines; IS1, dashed lines; IS2, dashed-dotted lines) and susceptible classes (bottom rows; SS, solid lines; SS1, dashed lines; SS2, dashed-dotted lines). The colors in the middle and bottom rows correspond to the legend in Fig. 1A. The leftmost column corresponds to a one-dose strategy, an interdose period of 1ω=24 weeks is assumed in the middle column, and the rightmost column assumes a two-dose strategy with doses separated by the recommended window of 1ω=4 weeks. Both (B) and (C) correspond to a weak natural and vaccinal immunity scenario, with the same parameters as those in Fig. 2A. A weaker immune response after one vaccine dose is assumed in (B) (with parameters corresponding to those in the top section of Fig. 2A), and a stronger immune response after one vaccine dose is assumed in (C) (with parameters corresponding to those in the bottom section of Fig. 2A). The weights used to calculate the relative net rates of adaptation are wIS,I=0.05, wIS1,I=0.3, and wIS2,I=0.05 in scenario I; wIS,II=0.05, wIS1,II=1, and wIS2,II=0.05 in scenario II; and wIS,III=0.8, wIS1,III=1, and wIS2,III=0.8 in scenario III.

Update of

Comment in

References

    1. McGill COVID19 Vaccine Tracker Team, COVID19 Vaccine Tracker; https://covid19.trackvaccines.org/vaccines/.
    1. Baden L. R., El Sahly H. M., Essink B., Kotloff K., Frey S., Novak R., Diemert D., Spector S. A., Rouphael N., Creech C. B., McGettigan J., Khetan S., Segall N., Solis J., Brosz A., Fierro C., Schwartz H., Neuzil K., Corey L., Gilbert P., Janes H., Follmann D., Marovich M., Mascola J., Polakowski L., Ledgerwood J., Graham B. S., Bennett H., Pajon R., Knightly C., Leav B., Deng W., Zhou H., Han S., Ivarsson M., Miller J., Zaks T.; COVE Study Group , Efficacy and safety of the mRNA-1273 SARS-CoV-2 vaccine. N. Engl. J. Med. 384, 403–416 (2021). 10.1056/NEJMoa2035389 - DOI - PMC - PubMed
    1. Polack F. P., Thomas S. J., Kitchin N., Absalon J., Gurtman A., Lockhart S., Perez J. L., Pérez Marc G., Moreira E. D., Zerbini C., Bailey R., Swanson K. A., Roychoudhury S., Koury K., Li P., Kalina W. V., Cooper D., Frenck R. W. Jr.., Hammitt L. L., Türeci Ö., Nell H., Schaefer A., Ünal S., Tresnan D. B., Mather S., Dormitzer P. R., Şahin U., Jansen K. U., Gruber W. C.; C4591001 Clinical Trial Group , Safety and efficacy of the bnt162b2 mRNA Covid-19 vaccine. N. Engl. J. Med. 383, 2603–2615 (2020). 10.1056/NEJMoa2034577 - DOI - PMC - PubMed
    1. Voysey M., Clemens S. A. C., Madhi S. A., Weckx L. Y., Folegatti P. M., Aley P. K., Angus B., Baillie V. L., Barnabas S. L., Bhorat Q. E., Bibi S., Briner C., Cicconi P., Collins A. M., Colin-Jones R., Cutland C. L., Darton T. C., Dheda K., Duncan C. J. A., Emary K. R. W., Ewer K. J., Fairlie L., Faust S. N., Feng S., Ferreira D. M., Finn A., Goodman A. L., Green C. M., Green C. A., Heath P. T., Hill C., Hill H., Hirsch I., Hodgson S. H. C., Izu A., Jackson S., Jenkin D., Joe C. C. D., Kerridge S., Koen A., Kwatra G., Lazarus R., Lawrie A. M., Lelliott A., Libri V., Lillie P. J., Mallory R., Mendes A. V. A., Milan E. P., Minassian A. M., McGregor A., Morrison H., Mujadidi Y. F., Nana A., O’Reilly P. J., Padayachee S. D., Pittella A., Plested E., Pollock K. M., Ramasamy M. N., Rhead S., Schwarzbold A. V., Singh N., Smith A., Song R., Snape M. D., Sprinz E., Sutherland R. K., Tarrant R., Thomson E. C., Török M. E., Toshner M., Turner D. P. J., Vekemans J., Villafana T. L., Watson M. E. E., Williams C. J., Douglas A. D., Hill A. V. S., Lambe T., Gilbert S. C., Pollard A. J.; Oxford COVID Vaccine Trial Group , Safety and efficacy of the ChAdOx1 nCoV-19 vaccine (AZD1222) against SARS-CoV-2: An interim analysis of four randomised controlled trials in Brazil, South Africa, and the UK. Lancet 397, 99–111 (2021). 10.1016/S0140-6736(20)32661-1 - DOI - PMC - PubMed
    1. Iacobucci G., Mahase E., Covid-19 vaccination: What’s the evidence for extending the dosing interval? BMJ 372, n18 (2021). 10.1136/bmj.n18 - DOI - PubMed

Publication types

MeSH terms

Substances