. 2021 Apr 1;148(7):dev196329.
doi: 10.1242/dev.196329. Epub 2021 Apr 15.

Full methylation of H3K27 by PRC2 is dispensable for initial embryoid body formation but required to maintain differentiated cell identity

Affiliations

Full methylation of H3K27 by PRC2 is dispensable for initial embryoid body formation but required to maintain differentiated cell identity

Sara A Miller et al. Development. .

Abstract

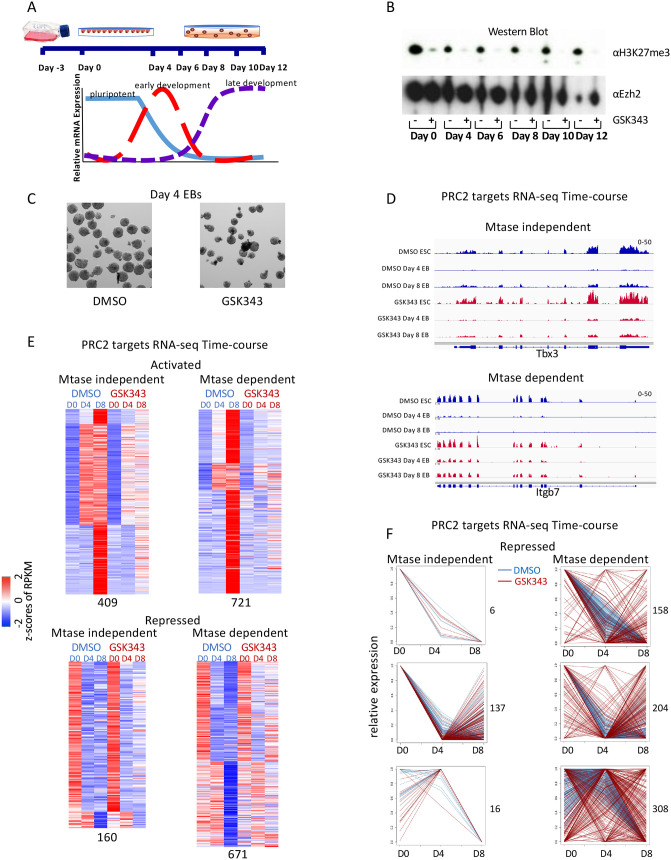
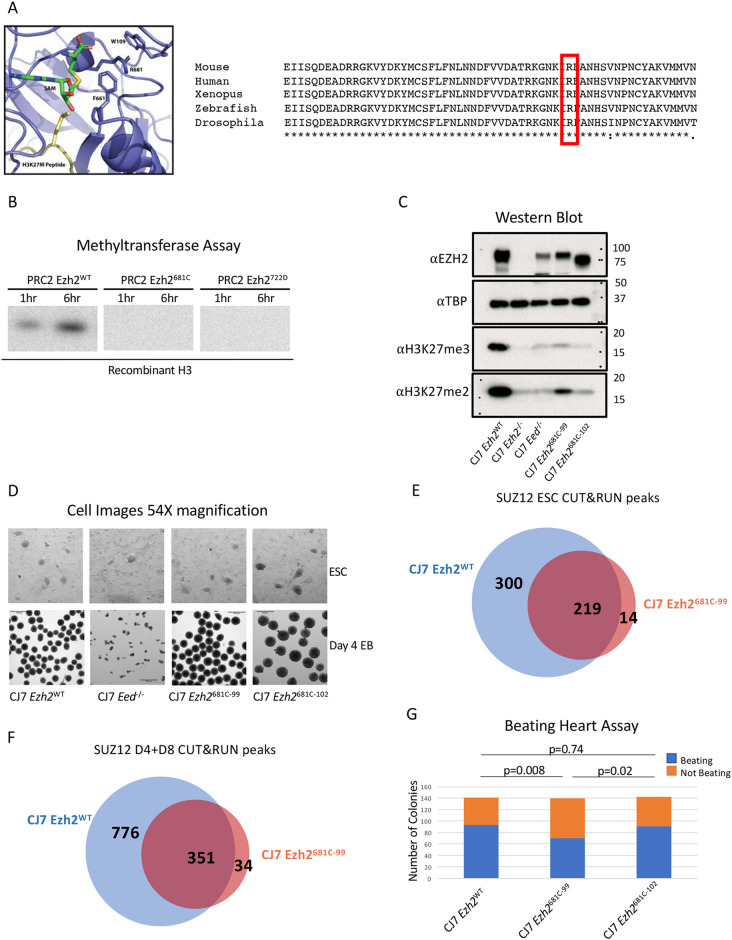
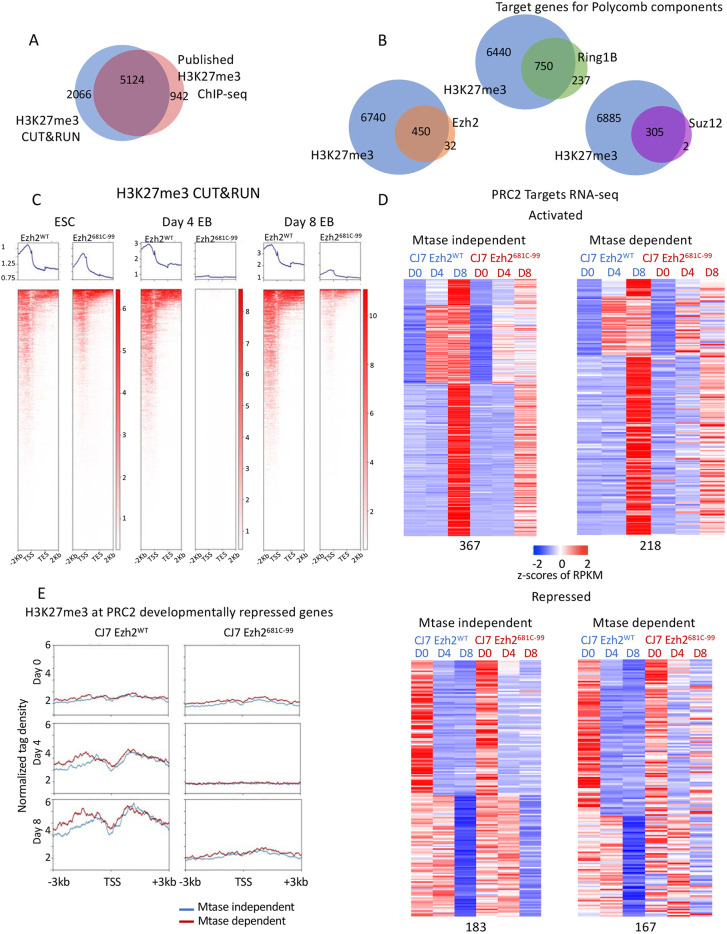
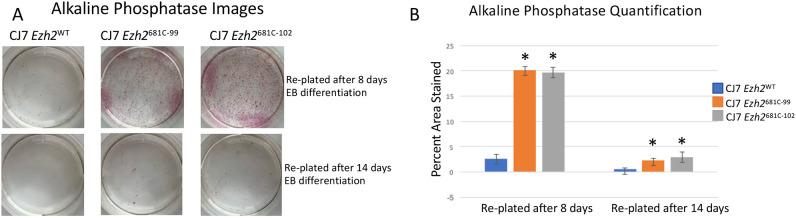
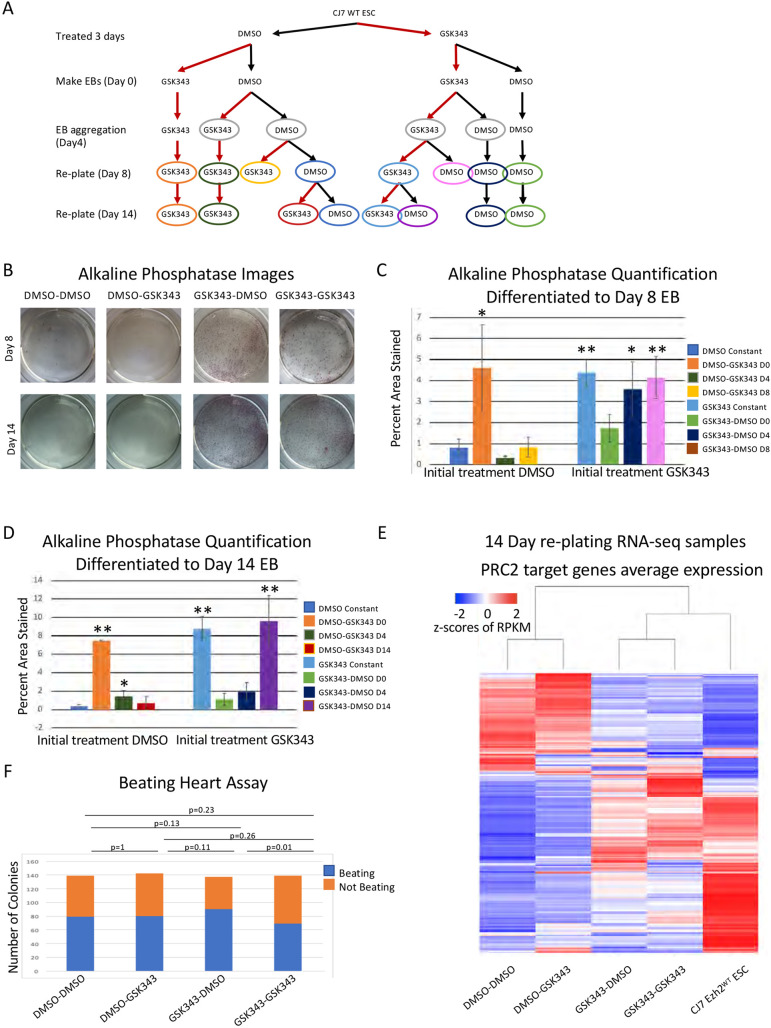
Polycomb repressive complex 2 (PRC2) catalyzes methylation of histone H3 on lysine 27 and is required for normal development of complex eukaryotes. The nature of that requirement is not clear. H3K27me3 is associated with repressed genes, but the modification is not sufficient to induce repression and, in some instances, is not required. We blocked full methylation of H3K27 with both a small molecule inhibitor, GSK343, and by introducing a point mutation into EZH2, the catalytic subunit of PRC2, in the mouse CJ7 cell line. Cells with substantively decreased H3K27 methylation differentiate into embryoid bodies, which contrasts with EZH2 null cells. PRC2 targets had varied requirements for H3K27me3, with a subset that maintained normal levels of repression in the absence of methylation. The primary cellular phenotype of blocked H3K27 methylation was an inability of altered cells to maintain a differentiated state when challenged. This phenotype was determined by H3K27 methylation in embryonic stem cells through the first 4 days of differentiation. Full H3K27 methylation therefore was not necessary for formation of differentiated cell states during embryoid body formation but was required to maintain a stable differentiated state.

Keywords: Differentiation; EZH2; Embryoid body; H3K27 methylation; Maintenance; PRC2.


Conflict of interest statement

Competing interests The authors declare no competing or financial interests.

Figures

Fig. 1.
Fig. 1.
Treatment with EZH2 methyltransferase inhibitor reveals two classes of PRC2 target genes during differentiation. (A) Diagram of embryoid body (EB) formation time course. (B) Western blot of cells treated with GSK343 EZH2 inhibitor or DMSO control probed with H3K27me3 and EZH2 antibodies. (C) Representative image of 54× magnification of day 4 EBs from cells treated with either DMSO control or GSK343. (D) Screen shots from RNA-seq over the EB differentiation time course from methyltransferase (Mtase)-independent (Tbx3) and Mtase-dependent (Itgb7) genes from cells treated with DMSO (blue) or GSK343 (red). (E) Heatmap showing expression patterns of Mtase-dependent and -independent PRC2 target genes in untreated (DMSO) and treated (GSK343) CJ7 cells over development time course. z-Scores of average RPKMs of duplicates are shown for each gene across all samples. Genes are separated based on whether they were activated (top) or repressed (bottom) in untreated cells over time as well as if they had a similar expression pattern in treated cells (Mtase-dependent genes; right) or a different expression pattern (Mtase-independent genes; left). The four groups are further clustered based on fold changes over time in untreated cells. All of the classifications were made based on a 1.5-fold change cutoff in expression levels over time. Numbers of genes in each category are indicated at the bottom. (F) Line diagrams showing relative gene expression of repressed PRC2 target genes from E separated by Mtase-dependent and -independent genes and expression pattern in DMSO-treated cells. Each plot shows all genes from individual clusters from E. Numbers of genes in each cluster are indicated on the right.
Fig. 2.
Fig. 2.
Point mutation of a conserved residue within the SET domain inhibits methyltransferase activity. (A) Diagram of Ezh2 SET domain structure with the 681 residue labeled. The SAM methyl donor is in green and the H3K27 M peptide is in yellow. An alignment of Ezh2 SET domains with the analogous residue is highlighted in red. It is highly conserved across species (right). (B) In vitro methyltransferase assay with PRC2 comprising WT or mutant EZH2, EED, SUZ12 and AEBP2. Recombinant H3 is the substrate and a radioactive SAM was the methyl donor. Reactions progressed for 1 or 6 h. (C) Western blot from WT, mutant and PRC2 knockout cells probed with H3K27me, EZH2 and control TBP antibodies. (D) Representative images showing 54× magnification of embryonic stem cells (ESCs) or of embryoid bodies (EBs) that have differentiated for 4 days from WT, 681C-99, 681C-102 and Eed−/− cells. (E) Venn diagram showing the overlap in CUT&RUN SUZ12 peaks between WT and 681C-99 mutant ESCs. (F) Venn diagram showing the overlap in CUT&RUN SUZ12 peaks between WT and 681C-99 mutant differentiated cells. (G) Quantification of beating heart assay from WT, 681C-99 and 681C-102 cells that were differentiated as EBs for 4 days and then individually plated in differentiation media. Blue shows the number of EBs that gave rise to beating cells and orange shows those that did not. For each cell type, 140 individual EBs were differentiated. P-values were calculated using a two proportion z-test.
Fig. 3.
Fig. 3.
The 681C point mutant shows reduced H3K27me3 on target genes regardless of whether they are dependent on the modification for normal expression. (A) Venn diagram showing overlap of H3K27me3 CUT&RUN and published ChIP-seq data peaks. (B) Venn diagrams showing overlap of target genes of H3K27me3 and other PRC2 components by CUT&RUN. (C) Average profiles and individual gene profiles of 7190 PRC2 target genes showing H3K27me3 CUT&RUN signal at day 0, 4 and 8 in WT and mutant cells. (D) Heatmap showing expression patterns of methyltransferase (Mtase)-dependent and -independent PRC2 target genes in WT and mutant ESCs over developmental time course. z-Scores of average RPKMs of triplicates are shown for each gene across all samples. Genes are separated based on whether they were activated (upper panels) or repressed (bottom panels) in WT cells over time as well as whether they had a similar expression pattern in mutant cells (Mtase-dependent genes; right) or a different expression pattern (Mtase-independent genes; left). The four groups are further clustered based on fold changes over time in untreated cells. All of the classifications were made based on a 1.5-fold change cutoff in expression levels over time. (E) Average profiles showing H3K27me3 enrichment in WT and mutant cells by CUT&RUN at Mtase-dependent (167) or -independent (183) and developmentally repressed PRC2 target genes over the time course.
Fig. 4.
Fig. 4.
Mutant cells are less stably differentiated than WT cells. (A) AP staining from WT, 681C-99 and 681C-102 cells that had been differentiated for 8 or 14 days and then transferred into ESC conditions for 5 days before staining. ESCs stain bright pink in this assay. (B) Quantification of AP staining from two biological replicates of re-plated cells. Data are mean±s.d. *P<0.05 (unpaired two-tailed Student's t-test).
Fig. 5.
Fig. 5.
The crucial time period for H3K27me3 is within the first 4 days of differentiation. (A) Diagram showing the drug treatment plan for differentiation and re-plating of cells. Light gray circles indicate the cells used for the beating heart assay (F), other colors correspond to the bar charts quantifying AP staining (C,D). (B) Images of AP staining from DMSO- or GSK343-treated cells re-plated in ES conditions for 5 days after 8 or 14 days of EB differentiation. A greater proportion of cells that start in GSK343 treatment stain pink, indicating that the cells have reverted to an ESC phenotype. (C,D) Quantification of AP staining from cells treated with DMSO or GSK343 re-plated after 8 days (C) or 14 days (D) of EB differentiation performed in triplicate. Time of the treatment switch is indicated in the key and corresponds with colors in A. Data are mean±s.d. *P<0.05, **P<0.005 (unpaired two-tailed Student's t-test). (E) Unsupervised clustering of RNA-seq average expression of cells re-plated for 5 days after 14 days of EB formation. Cells that were treated with GSK343 have gene expression profiles that cluster with average expression from WT ESCs. All 7190 PRC2 target genes are shown. (F) Quantification of beating heart assay with GSK343- and DMSO-treated cells. Cells were differentiated as EBs for 4 days and then plated into differentiation media. Blue indicates the number of EBs that formed beating cells and orange indicates the number that did not. P-values were calculated using a two proportion z-test.

Similar articles

Cited by

References

    1. Abdel Raouf, S. M., Ibrahim, T. R., Abdelaziz, L. A., Farid, M. I. and Mohamed, S. Y. (2021). Prognostic value of TWIST1 and EZH2 expression in colon cancer. J. Gastrointest. Cancer 52, 90-98. 10.1007/s12029-019-00344-4 - DOI - PubMed
    1. Ahmed, A., Wang, T. and Delgado-Olguin, P. (2018). Ezh2 is not required for cardiac regeneration in neonatal mice. PLoS ONE 13, e0192238. 10.1371/journal.pone.0192238 - DOI - PMC - PubMed
    1. Aloia, L., Di Stefano, B. and Di Croce, L. (2013). Polycomb complexes in stem cells and embryonic development. Development 140, 2525-2534. 10.1242/dev.091553 - DOI - PubMed
    1. Antonysamy, S., Condon, B., Druzina, Z., Bonanno, J. B., Gheyi, T., Zhang, F., MacEwan, I., Zhang, A., Ashok, S., Rodgers, L.et al. (2013). Structural context of disease-associated mutations and putative mechanism of autoinhibition revealed by X-ray crystallographic analysis of the EZH2-SET domain. PLoS ONE 8, e84147. 10.1371/journal.pone.0084147 - DOI - PMC - PubMed
    1. Basheer, F., Giotopoulos, G., Meduri, E., Yun, H., Mazan, M., Sasca, D., Gallipoli, P., Marando, L., Gozdecka, M., Asby, R.et al. (2019). Contrasting requirements during disease evolution identify EZH2 as a therapeutic target in AML. J. Exp. Med. 216, 966-981. 10.1084/jem.20181276 - DOI - PMC - PubMed

Publication types