

Identification of Potential Early Diagnostic Biomarkers of Sepsis
- PMID: 33688234
- PMCID: PMC7937397
- DOI: 10.2147/JIR.S298604
Identification of Potential Early Diagnostic Biomarkers of Sepsis
Abstract
Objective: The goal of this article was to identify potential biomarkers for early diagnosis of sepsis in order to improve their survival.
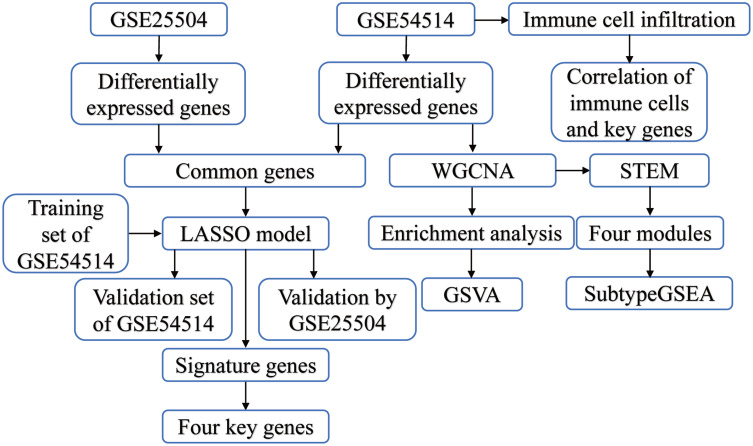
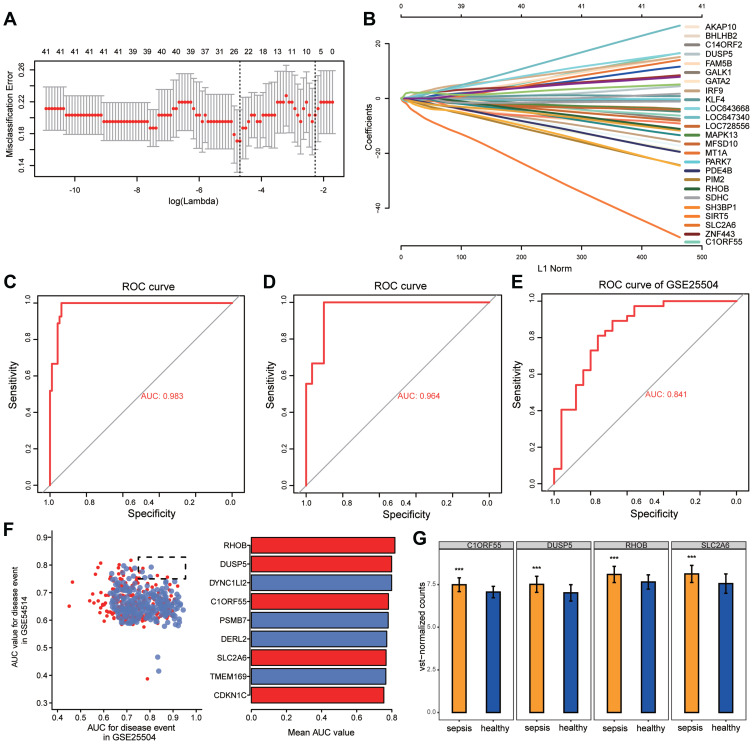
Methods: We analyzed differential gene expression between adult sepsis patients and controls in the GSE54514 dataset. Coexpression analysis was used to cluster coexpression modules, and enrichment analysis was performed on module genes. We also analyzed differential gene expression between neonatal sepsis patients and controls in the GSE25504 dataset, and we identified the subset of differentially expressed genes (DEGs) common to neonates and adults. All samples in the GSE54514 dataset were randomly divided into training and validation sets, and diagnostic signatures were constructed using least absolute shrink and selection operator (LASSO) regression. The key gene signature was screened for diagnostic value based on area under the receiver operating characteristic curve (AUC). STEM software identified dysregulated genes associated with sepsis-associated mortality. The ssGSEA method was used to quantify differences in immune cell infiltration between sepsis and control samples.
Results: A total of 6316 DEGs in GSE54514 were obtained spanning 10 modules. Module genes were mainly enriched in immune and metabolic responses. Screening 51 genes from among common genes based on AUC > 0.7 led to a LASSO model for the training set. We obtained a 25-gene signature, which we validated in the validation set and in the GSE25504 dataset. Among the signature genes, SLC2A6, C1ORF55, DUSP5 and RHOB were recognized as key genes (AUC > 0.75) in both the GSE54514 and GSE25504 datasets. SLC2A6 was identified by STEM as associated with sepsis-associated mortality and showed the strongest positive correlation with infiltration levels of Th1 cells.
Conclusion: In summary, our four key genes may have important implications for the early diagnosis of sepsis patients. In particular, SLC2A6 may be a critical biomarker for predicting survival in sepsis.
Keywords: LASSO model; SLC2A6; WGCNA; diagnostic biomarker; early diagnosis; sepsis.
© 2021 Li et al.
Conflict of interest statement
The authors report no conflicts of interest with this work.
Figures


Similar articles
-
Identification and validation of a novel mitochondrion-related gene signature for diagnosis and immune infiltration in sepsis.Front Immunol. 2023 Jun 15;14:1196306. doi: 10.3389/fimmu.2023.1196306. eCollection 2023. Front Immunol. 2023. PMID: 37398680 Free PMC article.
-
Screening of Key Genes of Sepsis and Septic Shock Using Bioinformatics Analysis.J Inflamm Res. 2021 Mar 11;14:829-841. doi: 10.2147/JIR.S301663. eCollection 2021. J Inflamm Res. 2021. PMID: 33737824 Free PMC article.
-
Identification of a Four-Gene Signature for Diagnosing Paediatric Sepsis.Biomed Res Int. 2022 Feb 14;2022:5217885. doi: 10.1155/2022/5217885. eCollection 2022. Biomed Res Int. 2022. Retraction in: Biomed Res Int. 2024 Mar 20;2024:9868941. doi: 10.1155/2024/9868941. PMID: 35198634 Free PMC article. Retracted.
-
Identification of a Novel Four-Gene Signature Correlated With the Prognosis of Patients With Hepatocellular Carcinoma: A Comprehensive Analysis.Front Oncol. 2021 Mar 12;11:626654. doi: 10.3389/fonc.2021.626654. eCollection 2021. Front Oncol. 2021. PMID: 33777771 Free PMC article.
-
FCGR2C: An emerging immune gene for predicting sepsis outcome.Front Immunol. 2022 Dec 2;13:1028785. doi: 10.3389/fimmu.2022.1028785. eCollection 2022. Front Immunol. 2022. PMID: 36532072 Free PMC article.
Cited by
-
Identification of new co-diagnostic genes for sepsis and metabolic syndrome using single-cell data analysis and machine learning algorithms.Front Genet. 2023 Mar 16;14:1129476. doi: 10.3389/fgene.2023.1129476. eCollection 2023. Front Genet. 2023. PMID: 37007944 Free PMC article.
-
Identification of cross-talk pathways and ferroptosis-related genes in periodontitis and type 2 diabetes mellitus by bioinformatics analysis and experimental validation.Front Immunol. 2022 Sep 29;13:1015491. doi: 10.3389/fimmu.2022.1015491. eCollection 2022. Front Immunol. 2022. PMID: 36248844 Free PMC article.
-
USF2 activates RhoB/ROCK pathway by transcriptional inhibition of miR-206 to promote pyroptosis in septic cardiomyocytes.Mol Cell Biochem. 2024 May;479(5):1093-1108. doi: 10.1007/s11010-023-04781-5. Epub 2023 Jun 22. Mol Cell Biochem. 2024. PMID: 37347361
-
Identification and Development of Synovial B-Cell-Related Genes Diagnostic Signature for Rheumatoid Arthritis.J Immunol Res. 2023 Nov 25;2023:9422990. doi: 10.1155/2023/9422990. eCollection 2023. J Immunol Res. 2023. PMID: 38046263 Free PMC article.
-
Applying logistic LASSO regression for the diagnosis of atypical Crohn's disease.Sci Rep. 2022 Jul 5;12(1):11340. doi: 10.1038/s41598-022-15609-5. Sci Rep. 2022. PMID: 35790774 Free PMC article.
References
-
- Fleischmann-Struzek C, Mikolajetz A, Schwarzkopf D, et al. Challenges in assessing the burden of sepsis and understanding the inequalities of sepsis outcomes between National Health Systems: secular trends in sepsis and infection incidence and mortality in Germany. Intensive Care Med. 2018;44(11):1826–1835. doi:10.1007/s00134-018-5377-4 - DOI - PMC - PubMed
LinkOut - more resources
Full Text Sources
Other Literature Sources
