. 2019 Jul;19(14):9097-9123.
doi: 10.5194/acp-19-9097-2019. Epub 2019 Jul 17.

On the sources and sinks of atmospheric VOCs: an integrated analysis of recent aircraft campaigns over North America

Affiliations

On the sources and sinks of atmospheric VOCs: an integrated analysis of recent aircraft campaigns over North America

Xin Chen et al. Atmos Chem Phys. 2019 Jul.

Abstract

We apply a high-resolution chemical transport model (GEOS-Chem CTM) with updated treatment of volatile organic compounds (VOCs) and a comprehensive suite of airborne datasets over North America to (i) characterize the VOC budget and (ii) test the ability of current models to capture the distribution and reactivity of atmospheric VOCs over this region. Biogenic emissions dominate the North American VOC budget in the model, accounting for 70 % and 95 % of annually emitted VOC carbon and reactivity, respectively. Based on current inventories anthropogenic emissions have declined to the point where biogenic emissions are the dominant summertime source of VOC reactivity even in most major North American cities. Methane oxidation is a 2x larger source of nonmethane VOCs (via production of formaldehyde and methyl hydroperoxide) over North America in the model than are anthropogenic emissions. However, anthropogenic VOCs account for over half of the ambient VOC loading over the majority of the region owing to their longer aggregate lifetime. Fires can be a significant VOC source episodically but are small on average. In the planetary boundary layer (PBL), the model exhibits skill in capturing observed variability in total VOC abundance (R 2 = 0:36) and reactivity (R 2 = 0:54). The same is not true in the free troposphere (FT), where skill is low and there is a persistent low model bias (~ 60 %), with most (27 of 34) model VOCs underestimated by more than a factor of 2. A comparison of PBL: FT concentration ratios over the southeastern US points to a misrepresentation of PBL ventilation as a contributor to these model FT biases. We also find that a relatively small number of VOCs (acetone, methanol, ethane, acetaldehyde, formaldehyde, isoprene C oxidation products, methyl hydroperoxide) drive a large fraction of total ambient VOC reactivity and associated model biases; research to improve understanding of their budgets is thus warranted. A source tracer analysis suggests a current overestimate of biogenic sources for hydroxyacetone, methyl ethyl ketone and glyoxal, an underestimate of biogenic formic acid sources, and an underestimate of peroxyacetic acid production across biogenic and anthropogenic precursors. Future work to improve model representations of vertical transport and to address the VOC biases discussed are needed to advance predictions of ozone and SOA formation.


Figures

Figure 1.
Figure 1.
Flight tracks for the aircraft campaigns used in this study: CalNex (May–June 2010), FRAPPÉ (July–August 2014), DC3 (May–June 2012), DISCOVER-AQ CA (January–February 2013), DISCOVER-AQ CO (July–August 2014), SEAC4RS (August– September 2013), SENEX (June 2013), DISCOVER-AQ TX (September 2013), and DISCOVER-AQ DC (June–July 2011).
Figure 2.
Figure 2.
Annual VOC carbon (a) and reactivity (b) budgets over North America as simulated by GEOS-Chem for 2013. For panel (a) the annually integrated flux for each source or sink term is given inset. For panel (b) all VOC fluxes are weighted by the corresponding OH reaction rate coefficient at 298 K to derive a VOC reactivity budget. Values inset indicate the fraction of total emitted reactivity produced or removed by that source, sink, or transport process. Positive fluxes denote sources and negative fluxes denote sinks.
Figure 3.
Figure 3.
Seasonal anthropogenic contribution to total VOC-carbon emissions (a) and to total reactivity-weighted VOC emissions (b). Numbers inset indicate the domain-aggregated emissions (a) or domain-wide contribution to reactivity-weighted emissions (b) from anthropogenic, biogenic, and biomass burning sources.
Figure 4.
Figure 4.
Distribution and source attribution of ambient VOC carbon and associated OH reactivity over North America. Panels (a) and (d): total VOC carbon and VOC-driven OH reactivity as simulated in the lowest model layer (below ~ 130 m). Panel (b) and (e): ambient VOC carbon and reactivity attributed to biogenic VOC emissions. Panel (c) and (f): ambient VOC carbon and reactivity attributed to anthropogenic VOC emissions. Source attributions are derived based on model sensitivity tests with 10 % modified anthropogenic or biogenic emissions, as described in the text.
Figure 5.
Figure 5.
Total observed VOC-carbon loading (a, c) over North America in the free troposphere (> 3 km a.g.l.) and planetary boundary layer (< 2 km a.g.l.). In (b, d) the GEOS-Chem model simulation is compared to co-located aircraft observation with the normalized mean bias given inset. Note that the sampling season and instrument payload vary among campaigns.
Figure 6.
Figure 6.
Total observed VOC reactivity (a, c) over North America in the free troposphere (> 3 km a.g.l.) and planetary boundary layer (< 2 km a.g.l.). In (b, d), the GEOS-Chem model simulation is compared to co-located aircraft observation with the normalized mean bias given inset. Note that the sampling season and instrument payload vary among campaigns.
Figure 7.
Figure 7.
Observed versus predicted VOC carbon as a function of carbon oxidation state (OSc) and number of carbon atoms (nc). Each circle indicates a single VOC (or lumped category for those that are measured or modeled collectively). Symbols are sized according to the observed median abundance (ppbC) of each species in the FT (a) and in the PBL (b, note altered size scaling from a). Triangles are used when co-located circles are too close in size to distinguish, and symbols are colored according to the median absolute model bias in each case. For overlapping species, the more abundant of the two is indicated with “>”.
Figure 8.
Figure 8.
Observed versus predicted VOC reactivity as a function of carbon oxidation state (OSc) and number of carbon atoms (nc). Each circle indicates a single VOC (or lumped category for those that are measured or modeled collectively). Symbols are sized according to the observed median reactivity (s−1) of each species in the FT (a) and in the PBL (b, note altered size scaling from a). Triangles are used when co-located circles are too close in size to distinguish, and symbols are colored according to the median absolute model bias in each case. For overlapping species, the more abundant of the two is indicated with “>”.
Figure 9.
Figure 9.
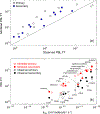
(a) Modeled versus observed mean PBL: FT ratio (mixing ratio units) for each VOC during the SEAC4RS campaign. Each data point represents a single VOC, and the 1: 1 line is also shown. (b) Modeled and observed mean PBL: FT ratio for VOCs during SEAC4RS as a function of their OH reaction rate coefficient at 298 K. In both panels, unfilled and filled symbols indicate species with predominantly primary and secondary sources, respectively.
Figure 10.
Figure 10.
GEOS-Chem model bias for select OVOCs in the boundary layer (< 1 km here), binned according to the contribution from biogenic (BOVOC) and anthropogenic (AOVOC) sources to the overall abundance. BOVOC and AOVOC represent the integrated influence of primary + secondary biogenic and anthropogenic sources (respectively) for a given OVOC along the aircraft flight track based on the model simulation, as described in the text. The 10 plotted bins each represent an equal number of data points for a given OVOC, with the box plots indicating the corresponding median (filled circle), interquartile range (thick line), and 99 % confidence interval (thin line).

References

    1. Akagi SK, Yokelson RJ, Wiedinmyer C, Alvarado MJ, Reid JS, Karl T, Crounse JD, and Wennberg PO: Emission factors for open and domestic biomass burning for use in atmospheric models, Atmos. Chem. Phys, 11, 4039–4072, 10.5194/acp-11-4039-2011, 2011. - DOI
    1. Alwe HD, Millet DB, Chen X, Raff JD, Payne ZC, and Fledderman K: Oxidation of Volatile Organic Compounds as the Major Source of Formic Acid in a Mixed Forest Canopy, Geophys. Res. Lett, 46, 2940–2948, 10.1029/2018GL081526, 2019. - DOI - PMC - PubMed
    1. Amos HM, Jacob DJ, Holmes CD, Fisher JA, Wang Q, Yantosca RM, Corbitt ES, Galarneau E, Rutter AP, Gustin MS, Steffen A, Schauer JJ, Graydon JA, Louis V. L. St, Talbot RW., Edgerton ES., Zhang Y., Sunderland EM.: Gas-particle partitioning of atmospheric Hg(II) and its effect on global mercury deposition, Atmos. Chem. Phys, 12, 591–603, 10.5194/acp-12-591-2012, 2012. - DOI
    1. Andreae MO and Merlet P: Emission of trace gases and aerosols from biomass burning, Global Biogeochem. Cy, 15, 955–966, 10.1029/2000gb001382, 2001. - DOI
    1. Apel EC, Emmons LK, Karl T, Flocke F, Hills AJ, Madronich S, Lee-Taylor J, Fried A, Weibring P, Walega J, Richter D, Tie X, Mauldin L, Campos T, Weinheimer A, Knapp D, Sive B, Kleinman L, Springston S, Zaveri R, Ortega J, Voss P, Blake D, Baker A, Warneke C, Welsh-Bon D, de Gouw J, Zheng J, Zhang R, Rudolph J, Junkermann W, and Riemer DD: Chemical evolution of volatile organic compounds in the outflow of the Mexico City Metropolitan area, Atmos. Chem. Phys, 10, 2353–2375, 10.5194/acp-10-2353-2010, 2010. - DOI