. 2021 Feb 1;5(1):125-144.
doi: 10.1162/netn_a_00169. eCollection 2021.

Dynamic community detection reveals transient reorganization of functional brain networks across a female menstrual cycle

Affiliations

Dynamic community detection reveals transient reorganization of functional brain networks across a female menstrual cycle

Joshua M Mueller et al. Netw Neurosci. .

Abstract

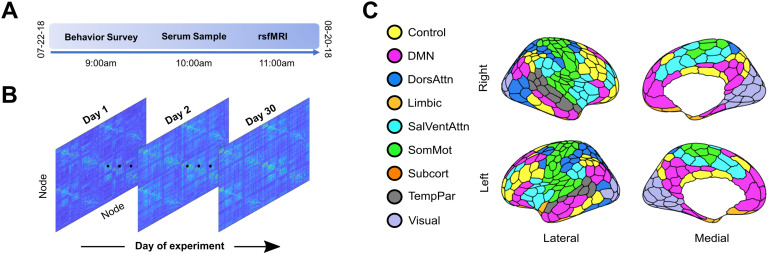
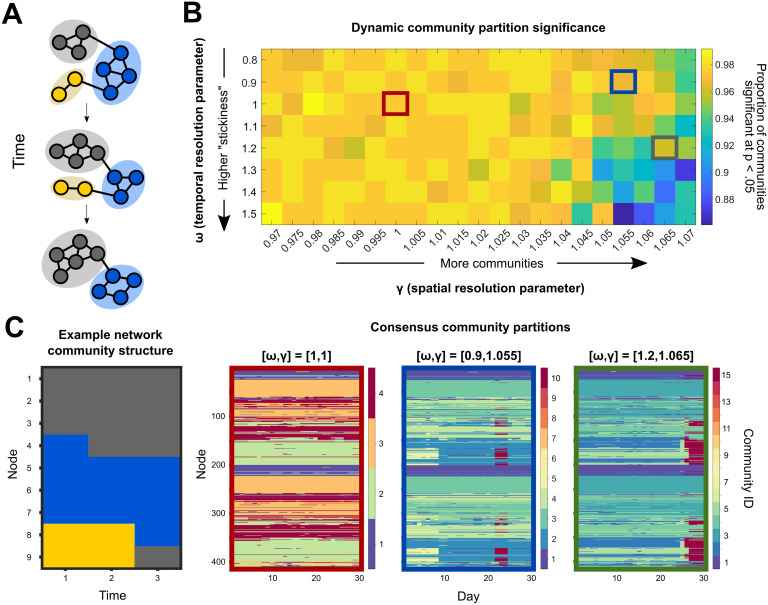
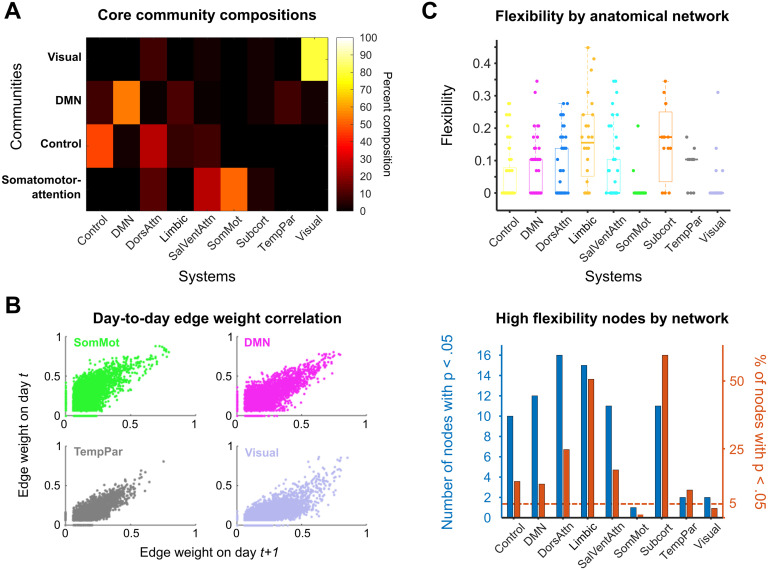
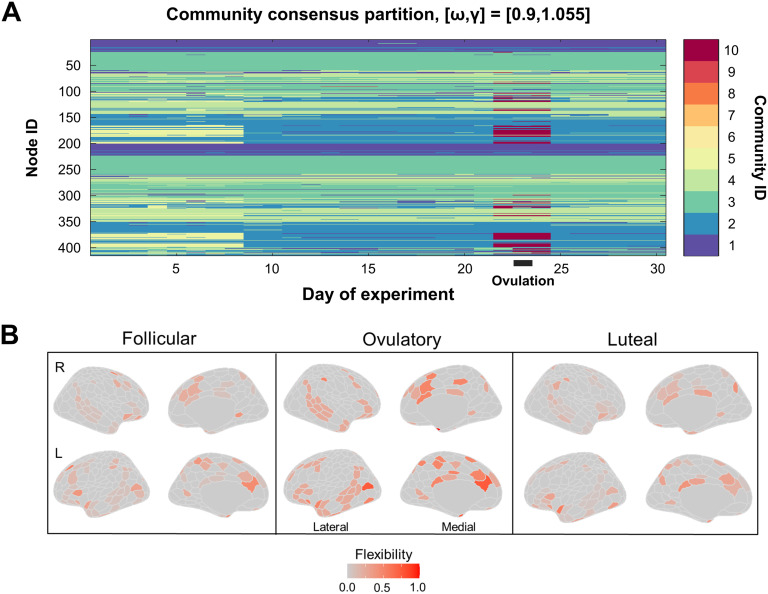
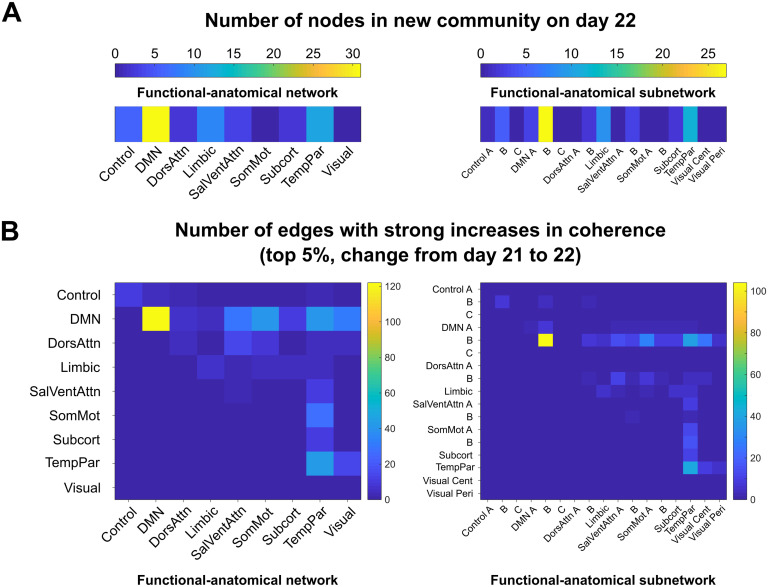
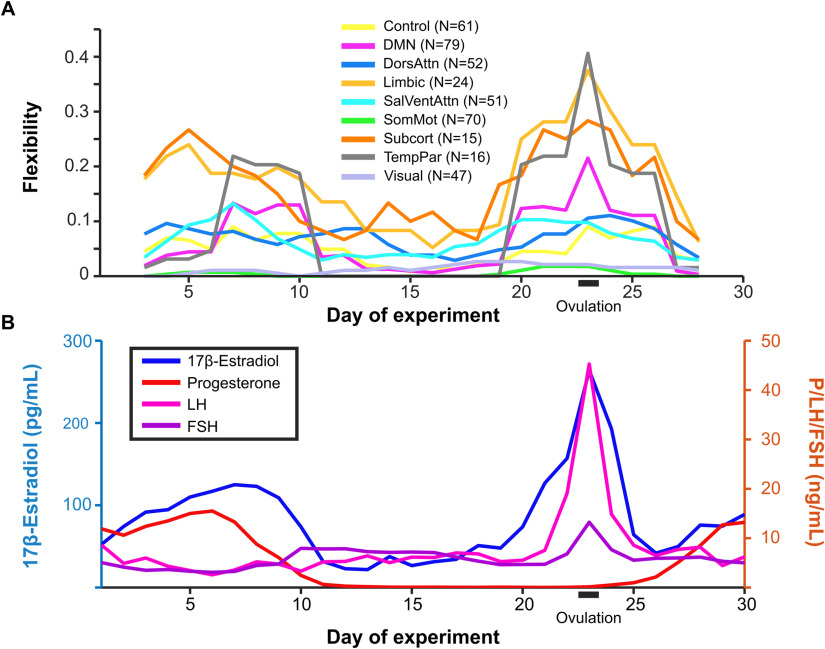
Sex steroid hormones have been shown to alter regional brain activity, but the extent to which they modulate connectivity within and between large-scale functional brain networks over time has yet to be characterized. Here, we applied dynamic community detection techniques to data from a highly sampled female with 30 consecutive days of brain imaging and venipuncture measurements to characterize changes in resting-state community structure across the menstrual cycle. Four stable functional communities were identified, consisting of nodes from visual, default mode, frontal control, and somatomotor networks. Limbic, subcortical, and attention networks exhibited higher than expected levels of nodal flexibility, a hallmark of between-network integration and transient functional reorganization. The most striking reorganization occurred in a default mode subnetwork localized to regions of the prefrontal cortex, coincident with peaks in serum levels of estradiol, luteinizing hormone, and follicle stimulating hormone. Nodes from these regions exhibited strong intranetwork increases in functional connectivity, leading to a split in the stable default mode core community and the transient formation of a new functional community. Probing the spatiotemporal basis of human brain-hormone interactions with dynamic community detection suggests that hormonal changes during the menstrual cycle result in temporary, localized patterns of brain network reorganization.

Keywords: Dense sampling; Dynamic community detection; Network flexibility; Sex hormones.


Conflict of interest statement

Competing Interests: The authors have declared that no competing interests exist.

Figures

<b>Figure 1.</b>
Figure 1.
28andMe dataset. (A) Subject LP (naturally cycling female, age 23) participated in a month-long “dense-sampling” experimental protocol to provide a multimodal, longitudinal dataset referred to as 28andMe (Pritschet et al., 2020). For 30 consecutive days, the subject completed assessments of diet, mood, and sleep, provided blood samples to examine serum hormone concentrations, and underwent a 10-minute resting-state fMRI scan. (B) For each resting-state scan, functional connectivity matrices were constructed by calculating the pairwise mean magnitude-squared coherence between each region. The result is a 415 × 415 × 30 data structure, in which each entry indicates the coherence between two nodes on a given day. (C) The brain was parcellated into 415 regions that were assigned to one of nine networks based on previously identified anatomical and functional associations (Schaefer et al., 2018). Colors indicate regional network membership. In a follow-up experiment, the participant repeated the procedures while on a hormonal regimen (0.02 mg ethinyl-estradiol, 0.1 mg levonorgestrel, Aubra, Afaxys Pharmaceuticals), which she began 10 months prior to the start of data collection (Pritschet et al., ; Taylor et al., 2020).
<b>Figure 2.</b>
Figure 2.
Dynamic community detection identified changing modular structure over time at multiple scales. (A) A toy network example illustrates the dynamic community detection algorithm. For each time point, every node is assigned to a community so as to maximize the strength of intracommunity connections relative to intercommunity links while also taking community assignments over time into account (Eq. 1). In this case, three communities are identified and denoted by color. (B) To assess temporal structure in the 28andMe resting-state fMRI data, community assignments were calculated for a range of parameter values. In this procedure, two parameters, ω and γ, specify the temporal and spatial scales of analysis, respectively. After performing 150 runs of the community detection algorithm for each parameter combination, the statistical significance of each community partition relative to a random null model was calculated. The color for each entry in the heat map indicates the proportion of communities at that parameter combination that are significant at the p < 0.05 level. (C) Consensus partition structure varied according to the choice of resolution parameters. The example network community structure (left) changes at each time point, with node community assignment given by color on the y-axis and time indicated on the x-axis. For three different parameter combinations (outlined in red, blue, and green, respectively), the consensus partitions varied in the total number of communities identified, ranging from 4 to 15, with more communities identified when the temporal resolution was low and the spatial resolution was high.
<b>Figure 3.</b>
Figure 3.
Dynamic community detection uncovered stable cores across a complete menstrual cycle. (A) Four core communities (y-axis) were consistently identified in the 28andMe dataset across spatial and temporal resolution parameter values. For these parameter combinations, the compositions of the visual, default mode, control, and somatomotor-attention network cores are shown as a heat map, with color corresponding to the percentage of nodes in a community belonging to a functional–anatomical network. (B) The four networks that constituted the hubs of the core communities possessed stable pairwise connectivity between nodes across days. Scatterplots show the day-to-day correspondence between edge weights for all of the nodes of the somatomotor, default mode, temporoparietal, and visual networks on days t and t + 1. These network edges had Pearson correlation coefficients of 0.379, 0.573, 0.590, and 0.538, respectively. (C) The subcortical, limbic, and dorsal attention networks exhibited the highest median node flexibility. Top: Normalized flexibility values for each node over the entire cycle are plotted as points, with color indicating network affiliation. Thick horizontal lines on box plots indicate median values. A flexibility value of 1 indicates that a node changes community assignment at each possible time point, whereas a value of 0 indicates that the node never changes community assignment. Bottom: A 95% cutoff value is calculated using the flexibility values for each node over all 150 community detection runs. For each functional–anatomical network, the blue bar indicates the number of nodes belonging to that network which have flexibility values above the cutoff threshold. The red bars indicate the proportion of nodes in each network that surpass the cutoff value (i.e., the value for each blue bar is normalized by the number of nodes in the network). Once again, limbic, subcortical, dorsal attention, and control networks contained the highest proportion of highly flexible nodes.
<b>Figure 4.</b>
Figure 4.
Fine-grain community partitioning revealed a bifurcation in the default mode core during ovulation. (A) When the spatial resolution parameter (which alters the size of communities identified by dynamic community detection) was increased from the standard value, the four core communities identified previously were subdivided into smaller subcommunities (reproduced from Figure 2C). Here, a split in the default mode core community (light blue) appeared at Day 22 (red), concomitant with ovulation and a spike in sex hormones. This community (red) rejoined the default mode core on day 26. For illustrative purposes, only the consensus partition for one parameter value is shown, but this trend was consistent across nearby parameter combinations (Supporting Information). (B) Shown are flexibility values for each node by menstrual cycle phase. Color in each region indicates flexibility value, with hotter colors indicating higher values. The following days of the experiment corresponded to the phases of the menstrual cycle: follicular, Days 11–22; ovulatory, Days 23–25; luteal, Days 1–10 and 26–30. Flexibility values are noticeably higher in many regions from the temporoparietal, limbic, subcortical, and default mode networks during the ovulatory phase compared with the follicular and luteal phases. Mowinckel, A.M. and Vidal-Piñeiro, D. (2019) Visualisation of Brain Statistics with R-packages ggseg and ggseg3d. arXiv:stat.OT/1912.08200.
<b>Figure 5.</b>
Figure 5.
Nodes in a default mode subnetwork drove community bifurcation via strong increases in coherence. (A) The newly formed functional community on Days 22–24 contained 65 nodes that belonged to the community on all three days. The functional–anatomical network and subnetwork affiliations of these nodes are shown on the left and right, respectively. The new community contained 31 DMN nodes, 12 temporoparietal nodes, and 9 limbic nodes. (B) The edges that exhibited large weight changes from Day 21 to Day 22 (top 5% of changes, left) were predominantly within-network connections between DMN network nodes (104/466). Examining subnetwork structure reveals that all of the strongly enhanced connections between nodes in the DMN belonged to subnetwork B, indicating that this subnetwork, which consists of regions in prefrontal cortex, drove the default mode core community bifurcation at ovulation.
<b>Figure 6.</b>
Figure 6.
Community reorganization was temporally localized to ovulation. Changes in community assignment (A) were coordinated and closely tracked the timing of spikes in estradiol concentrations (B). Default mode, limbic, subcortical, and temporoparietal networks exhibited peaks in flexibility on Day 23, indicating brain-wide functional reorganization during the ovulatory window. These same networks also exhibited elevated flexibility between Days 5 and 10 during the secondary estradiol peak. The pattern of flexibility shown here corresponds to the network reorganization observed for dynamic community detection performed with the parameter combination ω = 0.9, γ = 1.055 (blue outline in Figure 2). Here, flexibility is calculated over a five-day sliding window.

References

    1. Arélin, K., Mueller, K., Barth, C., Rekkas, P., Kratzsch, J., Burmann, I., … Sacher, J. (2015). Progesterone mediates brain functional connectivity changes during the menstrual cycle—A pilot resting state MRI study. Frontiers in Neuroscience, 9(44). DOI:https://doi.org/10.3389/fnins.2015.00044, PMID:25755630, PMCID:PMC4337344 - DOI - PMC - PubMed
    1. Bassett, D., Porter, M., Wymbs, N., Grafton, S., Carlson, J., & Mucha, P. (2013). Robust detection of dynamic community structure in networks. Chaos, 23, 01342. DOI:https://doi.org/10.1063/1.4790830, PMID:23556979, PMCID:PMC3618100 - DOI - PMC - PubMed
    1. Bassett, D., & Sporns, O. (2017). Network neuroscience. Nature Neuroscience, 20(3), 353–364. DOI:https://doi.org/10.1038/nn.4502, PMID:28230844, PMCID:PMC5485642 - DOI - PMC - PubMed
    1. Bassett, D., Wymbs, N., Porter, M., Mucha, P., Carlson, J., & Grafton, S. (2011). Dynamic reconfiguration of human brain networks during learning. PNAS, 108(18), 7641–7646. DOI:https://doi.org/10.1073/pnas.1018985108, PMID:21502525, PMCID:PMC3088578 - DOI - PMC - PubMed
    1. Bell, P., & Shine, J. (2016). Subcortical contributions to large-scale network communication. Neuroscience and Biobehavioral Reviews, 71, 313–322. DOI:https://doi.org/10.1016/j.neubiorev.2016.08.036, PMID:27590830 - DOI - PubMed

LinkOut - more resources