. 2021 Mar;129(3):35001.
doi: 10.1289/EHP7333. Epub 2021 Mar 10.

Defining and Intervening on Cumulative Environmental Neurodevelopmental Risks: Introducing a Complex Systems Approach

Affiliations

Defining and Intervening on Cumulative Environmental Neurodevelopmental Risks: Introducing a Complex Systems Approach

Devon C Payne-Sturges et al. Environ Health Perspect. 2021 Mar.

Abstract

Background: The combined effects of multiple environmental toxicants and social stressor exposures are widely recognized as important public health problems contributing to health inequities. However cumulative environmental health risks and impacts have received little attention from U.S. policy makers at state and federal levels to develop comprehensive strategies to reduce these exposures, mitigate cumulative risks, and prevent harm. An area for which the inherent limitations of current approaches to cumulative environmental health risks are well illustrated is children's neurodevelopment, which exhibits dynamic complexity of multiple interdependent and causally linked factors and intergenerational effects.

Objectives: We delineate how a complex systems approach, specifically system dynamics, can address shortcomings in environmental health risk assessment regarding exposures to multiple chemical and nonchemical stressors and reshape associated public policies.

Discussion: Systems modeling assists in the goal of solving problems by improving the "mental models" we use to make decisions, including regulatory and policy decisions. In the context of disparities in children's cumulative exposure to neurodevelopmental stressors, we describe potential policy insights about the structure and behavior of the system and the types of system dynamics modeling that would be appropriate, from visual depiction (i.e., informal maps) to formal quantitative simulation models. A systems dynamics framework provides not only a language but also a set of methodological tools that can more easily operationalize existing multidisciplinary scientific evidence and conceptual frameworks on cumulative risks. Thus, we can arrive at more accurate diagnostic tools for children's' environmental health inequities that take into consideration the broader social and economic environment in which children live, grow, play, and learn. https://doi.org/10.1289/EHP7333.


Figures

Figure 1 is a flowchart, having two levels of vulnerabilities, namely, community level vulnerability and individual level vulnerability. The community level vulnerability has four steps. Step 1: Disparities by maternal education, family income, race or ethnicity, immigration status, and class undergo residential segregation resulting in residential location having proximity to roads and polluting sources. Step 2: Residential locations are divided in to four categories of influence, namely, neighborhood resources, comprising early childhood education and enriched home environment, community stressors, comprising crime and poverty, structural factors, comprising healthy food access, employment, and housing quality, and environmental hazards and pollutants, comprising outdoor air, water and food contaminants, and indoor air, lead, and pesticides. There is a two-way connection between neighborhood resources and environmental hazards and pollutants and structural factors, between community stressors and environmental hazards and pollutants, and between neighborhood resources and community stressors, community stressors and structural factors, and structural factors and environmental hazards and pollutants. Step 3: All these four categories together lead to community stress. Step 4: Neurotoxic environmental hazards and pollutants lead to prenatal and postnatal exposures. The individual level vulnerability has five steps. Step 1: Environmental hazards and pollutants lead to prenatal and postnatal exposures which lead to internal dose and then biologically effective dose resulting in changes in brain structure. This results in neurodevelopmental outcome disparities, which includes cognitive delay, intelligence quotient, and attention deficit and hyperactivity disorders. Step 2: The four categories of residential location result into community stress, which in a two way leads to individual stressors, individual coping, appraisal processes, namely, smoking, maternal obesity, and material hardship, which leads to parental stress, which then in a two way leads to child stress resulting in neurodevelopmental outcome disparities. Step 3: Child stress contributes to the transition of exposure to internal dose and then biologically effective dose, resulting in neurodevelopmental outcome disparities. Step 4: Neighborhood resources give rise to family resources, including enriched home environment, which results in neurodevelopmental outcome disparities. Step 5: Family resources also lead to individual stressors, individual coping, appraisal processes, namely, smoking, maternal obesity, and material hardship, which leads to parental stress, which then in a two way leads to child stress resulting in neurodevelopmental outcome disparities.
Figure 1.
Exposure–Disease–Stress Framework for neurodevelopmental disparities. Modified from Gee and Payne-Sturges, 2004.
Figure 2 is an iceberg diagram divided into four parts. Part 1: This part is above the sea level and depicts the event, namely, environmental regulations under-protecting minority and low income children from multiple neuro toxicants. Part 2: This part is just below the sea level depicting the pattern of behavior underlying the event with three line graphs. The first line graph is titled prevalence of developmental disability among U S children, plotting percentage, ranging from 0 to 20 in increments of 10 (y-axis), the second graph is titled prevalence of pregnant women with detectable levels of 62 neurotoxic chemicals, plotting percentage, ranging from 0 to 100 in increments of 50 (y-axis), and the third graph is titled prevalence of U S children living below 200 percent poverty line, plotting percentage, ranging from 0 to 50 in increments of 25 (y-axis) across years, ranging from 1997 to 2017 (x-axis). Part 3: This part is at further beneath the surface of the ocean depicting the structure of the system that generates the pattern of behavior with a flowchart. In the flowchart, there are two loops, namely, reinforcing and balancing. In the reinforcing loop, an increase in agency commitment to bureaucratic neutrality causes a change in regulation or policy to address cumulative risks in the opposite direction, all else equal, and vice versa. In the balancing loop, a change in regulation or policy to address cumulative risks causes a change in children’s cumulative exposures to neurodevelopmental toxicants in the opposite direction, all else equal; a change in children’s cumulative exposures to neurodevelopmental toxicants causes a change in children with neurodevelopmental disorder and effects in the same direction, all else equal; a change in children with neurodevelopmental disorder and effects causes a change in social and economic costs in the same direction, all else equal; and a change in social and economic costs causes a change in regulation or policy to address cumulative risks in the same direction, all else equal. Agency in agency commitment to bureaucratic neutrality increases regulations based on single chemical risk assessment a change in, all else equal and more regulations based on single chemical risk assessment increases children’s cumulative exposures to neurodevelopmental toxicants. Industry pressure contributes to agency commitment to bureaucratic neutrality in the same direction, all else equal. In a balancing loop, a change in an initial variable feeds back to resist that original change, whereas in a reinforcing loop, a change in an initial variable feeds back to amplify that original change in the same direction. Part 4: This part is much below the sea level and depicts the values and goals underlying the structure, namely, the science isn’t there yet, we do ecology, not sociology, we must maintain a level playing field for industry, it’s out of our hands, we already protect public health, and the statutes don’t allow us to consider cumulative.
Figure 2.
“The iceberg,” a common systems metaphor, as applied to cumulative neurodevelopmental risks and impacts and environmental health policy. The iceberg is divided into four parts. Part 1: This part, the tip of the iceberg, is above the ocean surface and represents the event, such as the recognition that current environmental regulations are under-protecting minority and low-income children from multiple neurodevelopmental toxicants. Part 2: This part, just below the ocean’s surface, depicts the pattern of behavior or time trends (AKA behavior-over-times (BOT) graphs) underlying the event. The first BOT graph is titled prevalence of developmental disability among U S children, plotting percentage, ranging from 0 to 20 in increments of 10 (y-axis), the second graph is titled prevalence of pregnant women with detectable levels of 62 neurotoxic chemicals, plotting percentage, ranging from 0 to 100 in increments of 50 (y-axis), and the third graph is titled prevalence of U S children living below 200 percent poverty line, plotting percentage, ranging from 0 to 50 in increments of 25 (y-axis) across years, ranging from 1997 to 2017 (x-axis). Part 3: Further below the ocean’s surface, is the structure of the system that generates the pattern of behavior (BOTs) using causal loop diagrams of interlinking reinforcing and balancing feedback loops. Part 4: This final part is deep beneath the surface and represent the ultimate values and goals that underly the system structure that give rise to the patterns of behaviors (BOTs) which lead to the event or tip of the iceberg.
Figure 3 is a causal loop diagram. A change in children, adults, and discrimination causes a change in adverse childhood experiences in the same direction, all else equal, with a balancing loop of individual stress, parental stress, and community vulnerability between children, adults, and discrimination and adverse childhood experiences, respectively. A change in neurological functioning causes a change in adverse childhood experiences and discrimination in the opposite and same direction, respectively, all else equal, with a reinforcing loop of social vulnerability and structural vulnerability between neurological functioning and adverse childhood experiences and discrimination, respectively. A change in adverse childhood experiences causes a change in children and adults in the opposite direction, all else equal, with a balancing loop of intergenerational stress between adverse childhood experiences and adults. A change in children causes a change in neurological functioning in the same direction, all else equal. A change in environmental exposures causes a change in neurological functioning in the opposite direction, all else equal. There is a delay observed between a change in discrimination and children and its observed impact on environmental exposures and adults, respectively. In a balancing loop, a change in an initial variable feeds back to resist that original change, whereas in a reinforcing loop, a change in an initial variable feeds back to amplify that original change in the same direction.
Figure 3.
Example causal loop diagram on environment, social stressors, and neurodevelopment. Lines with arrows represent hypothesized causal relationships where polarities indicate the direction of influence. Double lines across the causal relationships represent temporal delays between causes and effects. Arcs with arrow heads indicate feedback mechanisms or loops where loops with “B” prefixes (B1, B2, and B3) represent balancing loops that counteract a perturbation, and “R” prefixes (R1, R2, and R3) represent reinforcing loops that reinforce a perturbation. Text in italics under the loop provides a short name for the feedback mechanism.
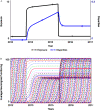
Figure 4A is a two-sided line graph, plotting exposure, ranging from 0 to 12 (left y-axis) and disparities, ranging from 0 to 0.3 (right y-axis) across years, namely, 2012, 2013, 2015, and 2017 (x-axis) for exposure and disparities. Figure 4B is an overlapping curve graph, plotting average neurological functioning, ranging from 0 to 100 (y-axis) across years, namely, 2012, 2013, 2015, and 2017 (x-axis) for adjacent birth cohorts.
Figure 4.
Output from proof-of-concept system dynamics simulation model (A) environmental exposure (line 1) and population level disparities (line 2) as difference in neurological functioning relative to reference group, and (B) average neurological functioning growth curve for each birth cohort from 2012 to 2017 where birth cohorts are 10 d wide. Note that the repeated pattern of line types (solid, dots, dashed) and colors in B are used only to help distinguish adjacent birth cohorts.

Similar articles

Cited by

References

    1. Adamkiewicz G, Zota AR, Fabian MP, Chahine T, Julien R, Spengler JD, et al. 2011. Moving environmental justice indoors: understanding structural influences on residential exposure patterns in low-income communities. Am J Public Health 101(suppl 1):S238–S245, PMID: 21836112, 10.2105/AJPH.2011.300119. - DOI - PMC - PubMed
    1. Alaimo K, Olson CM, Frongillo EA Jr.. 2001. Food insufficiency and American school-aged children’s cognitive, academic, and psychosocial development. Pediatrics 108(1):44–53, PMID: 11433053. - PubMed
    1. Allen JL, Liu X, Pelkowski S, Palmer B, Conrad K, Oberdörster G, et al. 2014a. Early postnatal exposure to ultrafine particulate matter air pollution: persistent ventriculomegaly, neurochemical disruption, and glial activation preferentially in male mice. Environ Health Perspect 122(9):939–945, PMID: 24901756, 10.1289/ehp.1307984. - DOI - PMC - PubMed
    1. Allen JL, Liu X, Weston D, Prince L, Oberdörster G, Finkelstein JN, et al. 2014b. Developmental exposure to concentrated ambient ultrafine particulate matter air pollution in mice results in persistent and sex-dependent behavioral neurotoxicity and glial activation. Toxicol Sci 140(1):160–178, PMID: 24690596, 10.1093/toxsci/kfu059. - DOI - PMC - PubMed
    1. Alves S, Tilghman J, Rosenbaum A, Payne-Sturges DC. 2012. U.S. EPA authority to use cumulative risk assessments in environmental decision-making. Int J Environ Res Public Health 9(6):1997–2019, PMID: 22829786, 10.3390/ijerph9061997. - DOI - PMC - PubMed

Publication types

LinkOut - more resources