. 2021 Jul 5;153(7):e202012816.
doi: 10.1085/jgp.202012816.

cMyBPC phosphorylation modulates the effect of omecamtiv mecarbil on myocardial force generation

Affiliations

cMyBPC phosphorylation modulates the effect of omecamtiv mecarbil on myocardial force generation

Ranganath Mamidi et al. J Gen Physiol. .

Abstract

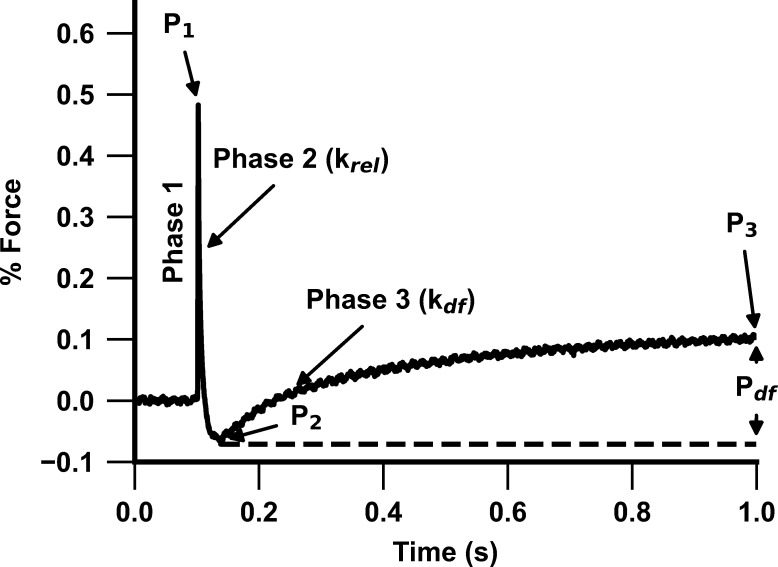
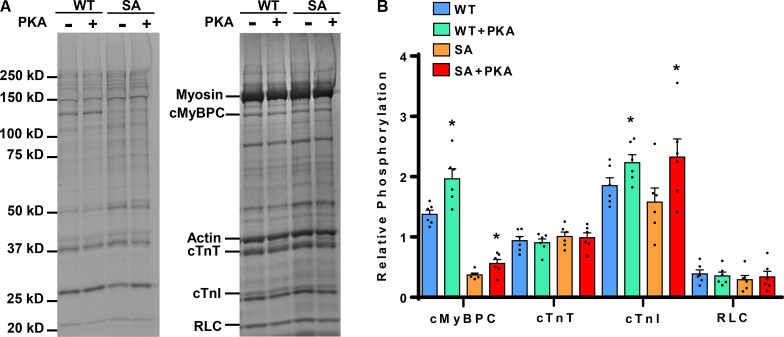
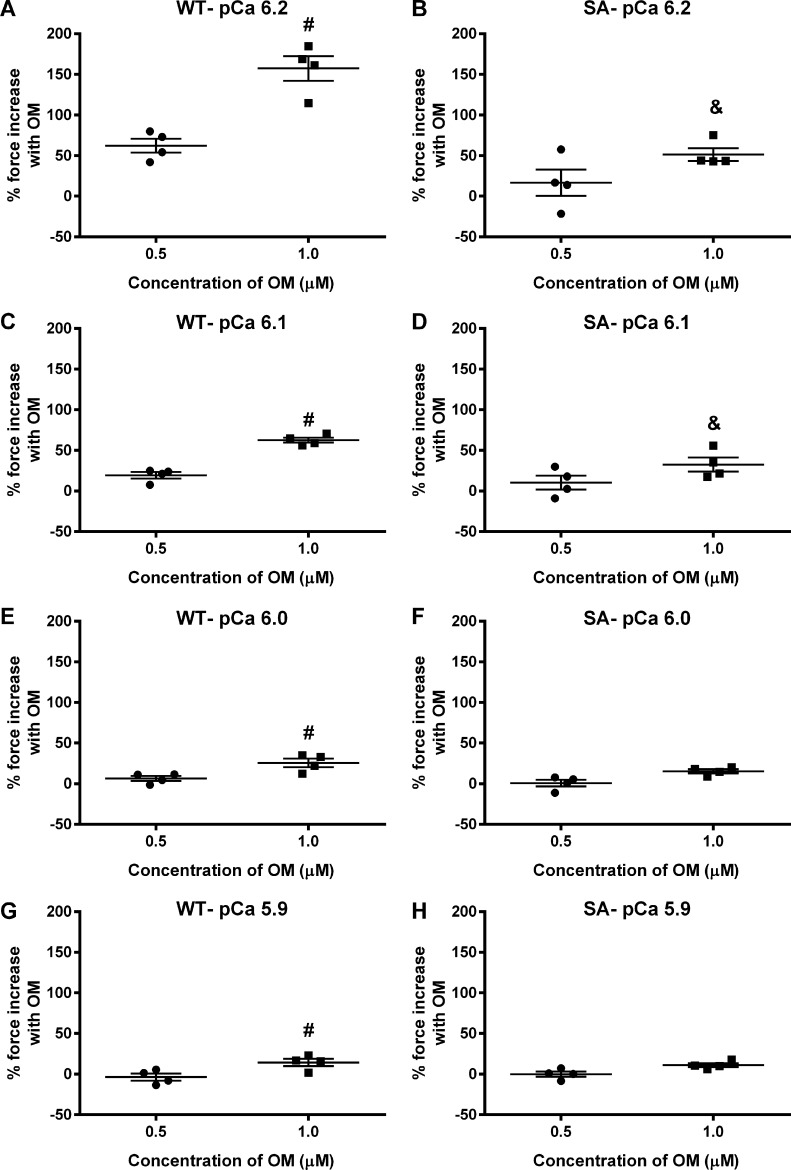
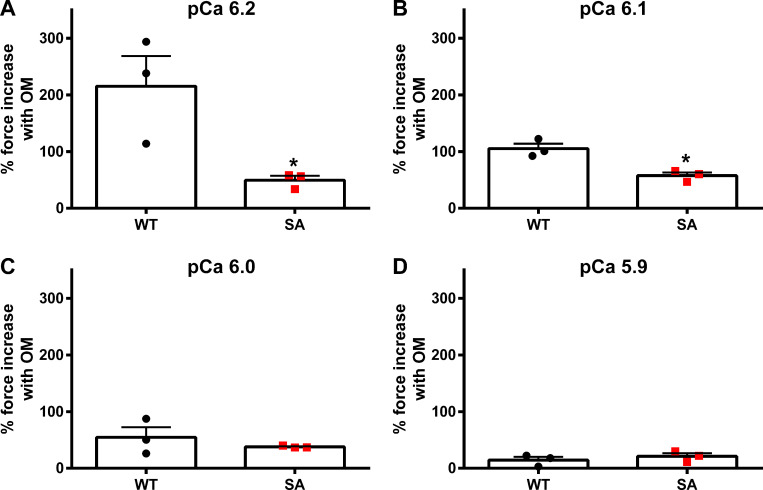
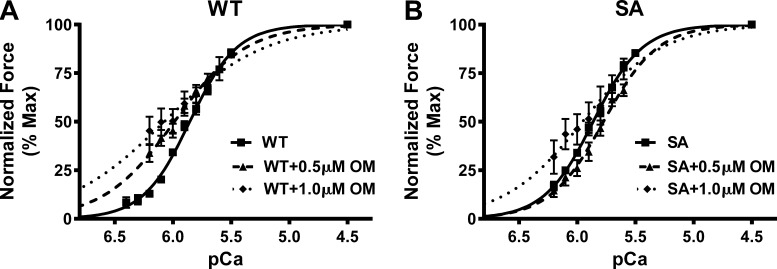
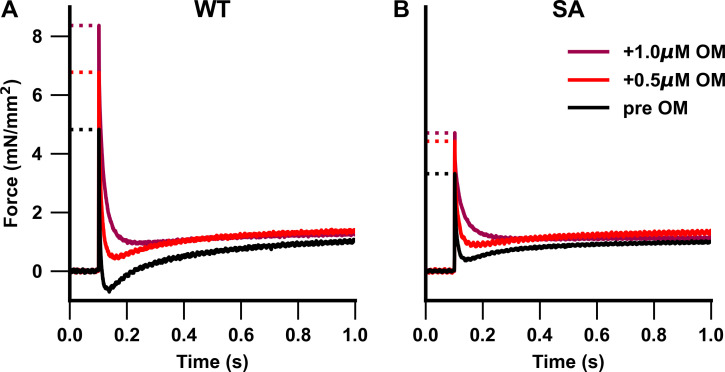
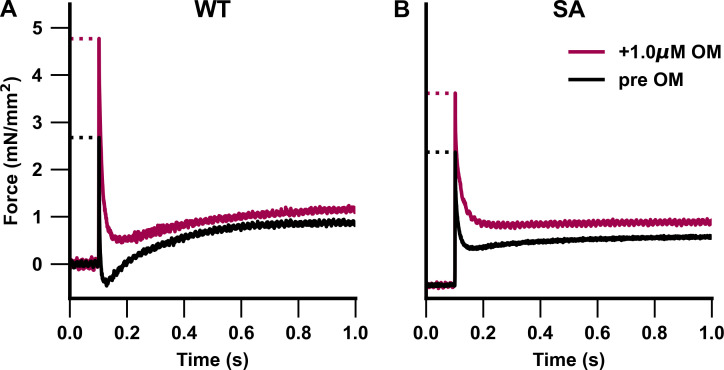
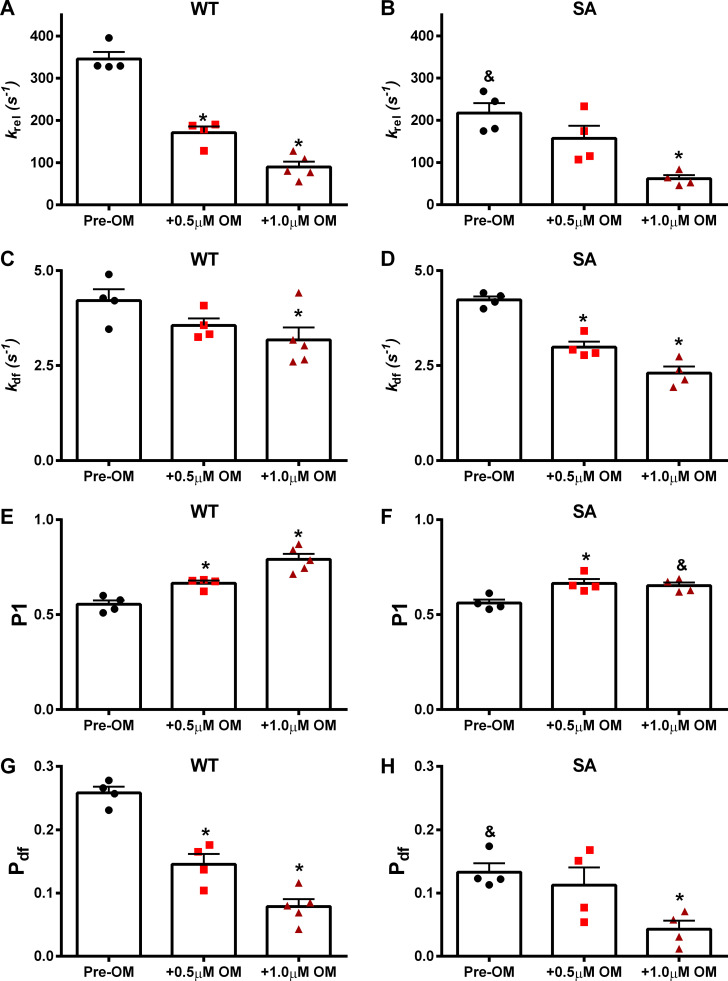
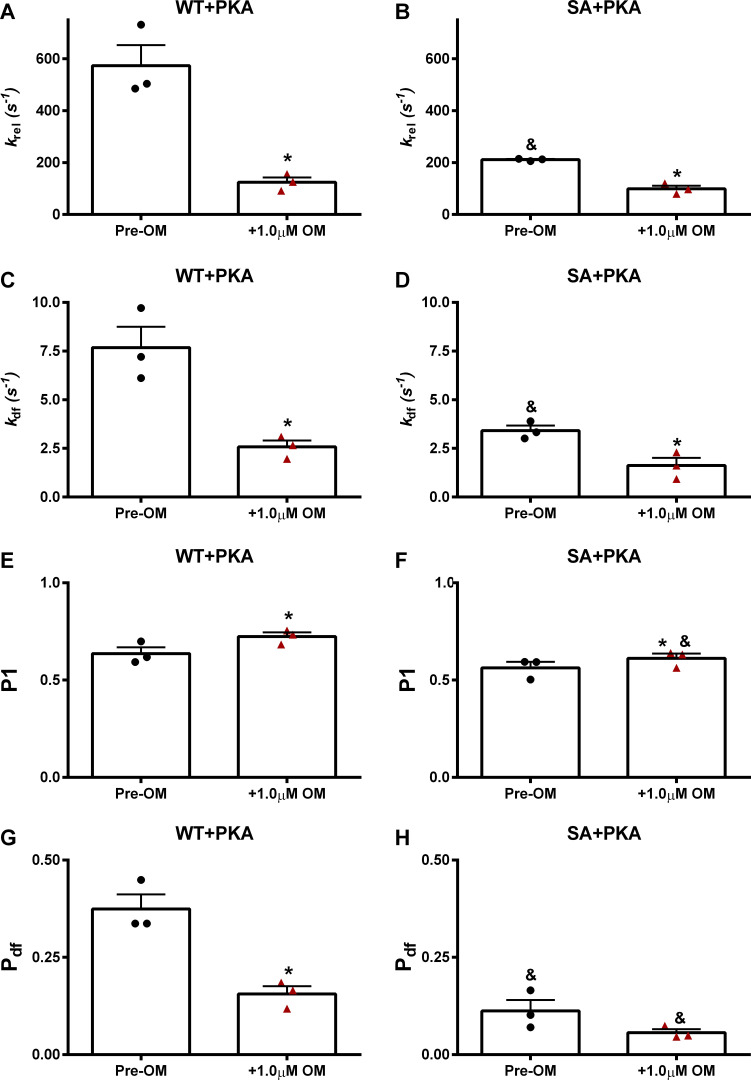
Omecamtiv mecarbil (OM), a direct myosin motor activator, is currently being tested as a therapeutic replacement for conventional inotropes in heart failure (HF) patients. It is known that HF patients exhibit dysregulated β-adrenergic signaling and decreased cardiac myosin-binding protein C (cMyBPC) phosphorylation, a critical modulator of myocardial force generation. However, the functional effects of OM in conditions of altered cMyBPC phosphorylation have not been established. Here, we tested the effects of OM on force generation and cross-bridge (XB) kinetics using murine myocardial preparations isolated from wild-type (WT) hearts and from hearts expressing S273A, S282A, and S302A substitutions (SA) in the M domain, between the C1 and C2 domains of cMyBPC, which cannot be phosphorylated. At submaximal Ca2+ activations, OM-mediated force enhancements were less pronounced in SA than in WT myocardial preparations. Additionally, SA myocardial preparations lacked the dose-dependent increases in force that were observed in WT myocardial preparations. Following OM incubation, the basal differences in the rate of XB detachment (krel) between WT and SA myocardial preparations were abolished, suggesting that OM differentially affects the XB behavior when cMyBPC phosphorylation is reduced. Similarly, in myocardial preparations pretreated with protein kinase A to phosphorylate cMyBPC, incubation with OM significantly slowed krel in both the WT and SA myocardial preparations. Collectively, our data suggest there is a strong interplay between the effects of OM and XB behavior, such that it effectively uncouples the sarcomere from cMyBPC phosphorylation levels. Our findings imply that OM may significantly alter the in vivo cardiac response to β-adrenergic stimulation.


Figures

Figure 1.
Figure 1.
Representative stretch activation response following a rapid 2% stretch in ML. Highlighted are the important phases of the force response and the associated dynamic XB parameters in a WT myocardial preparation following a 2% stretch in ML (see Materials and methods for details). Phase 1 represents the immediate increase in force when a sudden stretch in ML is applied and represents the number of strongly bound XBs at the instance of the imposed stretch. P1 is the magnitude of the immediate force response and is measured from the prestretch isometric steady-state force (set to zero before the stretch) to the peak of phase 1. This is followed by phase 2, which represents a rapid decline in force development with a dynamic rate constant krel and is an index of the rate of XB detachment. The minimum point of phase 2 is represented by P2, which indicates the magnitude of XB detachment. Phase 3 denotes the delayed force development with a dynamic rate constant kdf and is an index of the rate of XB recruitment. Pdf is the difference between P2 and P3 and represents the magnitude of XB recruitment in response to the imposed stretch.
Figure 2.
Figure 2.
Phos-Tag phosphoprotein gel stain analysis to assess the phosphorylation status of myofilament proteins in WT and SA myocardial preparations. (A) Representative Phos-Tag phosphoprotein–stained (left) and Coomassie-stained (right) SDS gels showing the phosphorylation status of myofilament proteins in WT and SA samples before and following incubation with PKA. (B) Quantification of phosphorylation of cMyBPC, cTnT, cTnI, and RLC in WT and SA samples. In both groups, three hearts and two replicates each were used to analyze total protein expression and phosphorylation. Values are expressed as mean ± SEM. *, Significantly different compared with the corresponding pre-PKA group; P < 0.05.
Figure 3.
Figure 3.
Impact of OM on percent force increases at various levels of Ca2+ activation in WT and SA myocardial preparations. Baseline forces generated by the myocardial preparations were initially measured in Ca2+ solutions with pCa ranging from 6.2 to 5.9. Forces were subsequently measured on the same preparations using the same range of pCa solutions following a 2-min incubation with either 0.5 or 1.0 µM OM. The net increase in force generation following OM incubation at each pCa was calculated and expressed as percent increase in force from the preincubation baseline force in WT and SA myocardial preparations as done in our previous studies (Mamidi et al., 2015, 2017b). Incubation with OM led to a dose-dependent increase in the myocardial force generation at all the Ca2+ levels tested in the WT but such dose-dependent force increases were absent in the SA myocardial preparations. Data from multiple preparations from each heart were averaged, and 12–15 myocardial preparations from four different hearts were used per group. Values are expressed as mean ± SEM. #, Significantly different compared with the 0.5 µM OM group. &, Significantly different compared with the corresponding WT group. P < 0.05.
Figure 4.
Figure 4.
Impact of OM on the magnitude of force generation at various levels of Ca2+ activation in PKA-treated WT and SA myocardial preparations. (A–D) Myocardial preparations were incubated for 1 h in PKA, and then baseline forces generated by the PKA-treated preparations were first measured in Ca2+ solutions with pCa ranging from 6.2 to 5.9. Forces were subsequently measured on the same myocardial preparations using the same range of pCa solutions following a 2-min incubation with 1.0 µM OM. The net increase in force generation following OM incubation at each pCa was calculated and expressed as percent increase in force from the preincubation baseline force measured in Ca2+ solutions with pCa 6.2 (A), 6.1 (B), 6.0 (C), and 5.9 (D). Force enhancements following OM incubation were less pronounced in the PKA-treated SA myocardial preparations when compared with the PKA-treated WT myocardial preparations, especially at low Ca2+ activations, where OM has more potent effects on enhancing the force generation (Mamidi et al., 2015, 2017b). Data from multiple preparations from each heart were averaged, and six to seven myocardial preparations from three different hearts were used per group. Values are expressed as mean ± SEM. *, Significantly different compared with the corresponding 1.0 µM OM-treated WT group; P < 0.05.
Figure 5.
Figure 5.
Impact of OM on myofilament Ca2+ sensitivity (pCa50) in WT and SA myocardial preparations. (A and B) Force–pCa relationships were constructed by plotting normalized forces generated against a range of pCa with and without OM incubations in WT (A) and SA (B) myocardial preparations. OM incubation caused a significant leftward shift in the force–pCa relationships in WT myocardial preparations, indicating that OM caused a significant increase in pCa50. However, pCa50 was unaltered in the SA myocardial preparations following OM incubation, presumably because 1.0 µM OM-mediated force enhancements in SA myocardial preparations were mainly confined to <50% of maximal force. Data from multiple preparations from each heart were averaged, and 9–13 myocardial preparations from three or four hearts were used per group.
Figure 6.
Figure 6.
Representative stretch activation traces from WT and SA myocardial preparations. (A and B) Representative stretch activation responses to a rapid 2% increase in ML in WT (A) and SA (B) myocardial preparations measured at pCa 6.1 to illustrate the dose-dependent effect of OM on force generation. WT myocardial preparations showed a dose-dependent OM-mediated increase in force development, whereas increase in force development was observed only following 1.0 µM OM incubation in the SA myocardial preparations.
Figure 7.
Figure 7.
Representative stretch activation traces from PKA-treated WT and SA myocardial preparations. (A and B) Representative stretch activation responses to a rapid 2% increase in ML in PKA-treated WT (A) and PKA-treated SA (B) myocardial preparations measured at pCa 6.0 to illustrate the effect of OM on force generation. Incubation with 1.0 µM OM significantly increased force development in the PKA-treated WT and SA myocardial preparations.
Figure 8.
Figure 8.
Impact of OM on the dynamic XB parameters in WT and SA myocardial preparations. The effects of OM on dynamic XB parameters derived from stretch activation responses in pre-OM, 0.5 µM OM–, and 1.0 µM–treated WT and SA myocardial preparations are shown at pCa 6.1. (A and B) krel before and following OM incubations in WT (A) and SA (B) myocardial preparations. (C and D) kdf before and following OM incubations in WT (C) and SA (D) myocardial preparations. (E and F) P1 before and following OM incubations in WT (E) and SA (F) myocardial preparations. (G and H) Pdf before and following OM incubations in WT (G) and SA (H) myocardial preparations. Data from multiple preparations from each heart were averaged, and 12–15 myocardial preparations from four or five different hearts were used per group. Values are expressed as mean ± SEM. *, Significantly different compared with the corresponding pre-OM group; P < 0.05. &, Significantly different compared with the corresponding WT group.
Figure 9.
Figure 9.
Impact of OM on the dynamic XB parameters in PKA-treated WT and SA myocardial preparations. The effects of OM on dynamic XB parameters derived from stretch activation responses in PKA-treated WT and SA myocardial preparations are shown at pCa 6.0. (A and B) krel before and following OM incubation in WT (A) and SA (B) myocardial preparations. (C and D) kdf before and following OM incubation in WT (C) and SA (D) myocardial preparations. (E and F) P1 before and following OM incubation in WT (E) and SA (F) myocardial preparations. (G and H) Pdf before and following OM incubation in WT (G) and SA (H) myocardial preparations. Data from multiple preparations from each heart were averaged, and six to seven myocardial preparations from three different hearts were used per group. Values are expressed as mean ± SEM. *, Significantly different compared with the corresponding pre-OM group; P < 0.05. &, Significantly different compared with the corresponding WT group.

Comment in

References

    1. Ahmad, T., Miller P.E., McCullough M., Desai N.R., Riello R., Psotka M., Böhm M., Allen L.A., Teerlink J.R., Rosano G.M.C., and Lindenfeld J.. 2019. Why has positive inotropy failed in chronic heart failure? Lessons from prior inotrope trials. Eur. J. Heart Fail. 21:1064–1078. 10.1002/ejhf.1557 - DOI - PMC - PubMed
    1. Bardswell, S.C., Cuello F., Kentish J.C., and Avkiran M.. 2012. cMyBP-C as a promiscuous substrate: phosphorylation by non-PKA kinases and its potential significance. J. Muscle Res. Cell Motil. 33:53–60. 10.1007/s10974-011-9276-3 - DOI - PubMed
    1. Campbell, K. 1997. Rate constant of muscle force redevelopment reflects cooperative activation as well as cross-bridge kinetics. Biophys. J. 72:254–262. 10.1016/S0006-3495(97)78664-8 - DOI - PMC - PubMed
    1. Campbell, K.S., and Moss R.L.. 2003. SLControl: PC-based data acquisition and analysis for muscle mechanics. Am. J. Physiol. Heart Circ. Physiol. 285:H2857–H2864. 10.1152/ajpheart.00295.2003 - DOI - PubMed
    1. Candiano, G., Bruschi M., Musante L., Santucci L., Ghiggeri G.M., Carnemolla B., Orecchia P., Zardi L., and Righetti P.G.. 2004. Blue silver: a very sensitive colloidal Coomassie G-250 staining for proteome analysis. Electrophoresis. 25:1327–1333. 10.1002/elps.200305844 - DOI - PubMed

Publication types