

SARS-CoV-2 Seroprevalence and Symptom Onset in Culturally Linked Orthodox Jewish Communities Across Multiple Regions in the United States
- PMID: 33688968
- PMCID: PMC7948060
- DOI: 10.1001/jamanetworkopen.2021.2816
SARS-CoV-2 Seroprevalence and Symptom Onset in Culturally Linked Orthodox Jewish Communities Across Multiple Regions in the United States
Abstract
Importance: Data on severe acute respiratory syndrome coronavirus 2 (SARS-CoV-2) seroprevalence in the United States are still emerging.
Objective: To elucidate SARS-CoV-2 seroprevalence and symptom onset in a culturally linked community across 5 states in the United States.
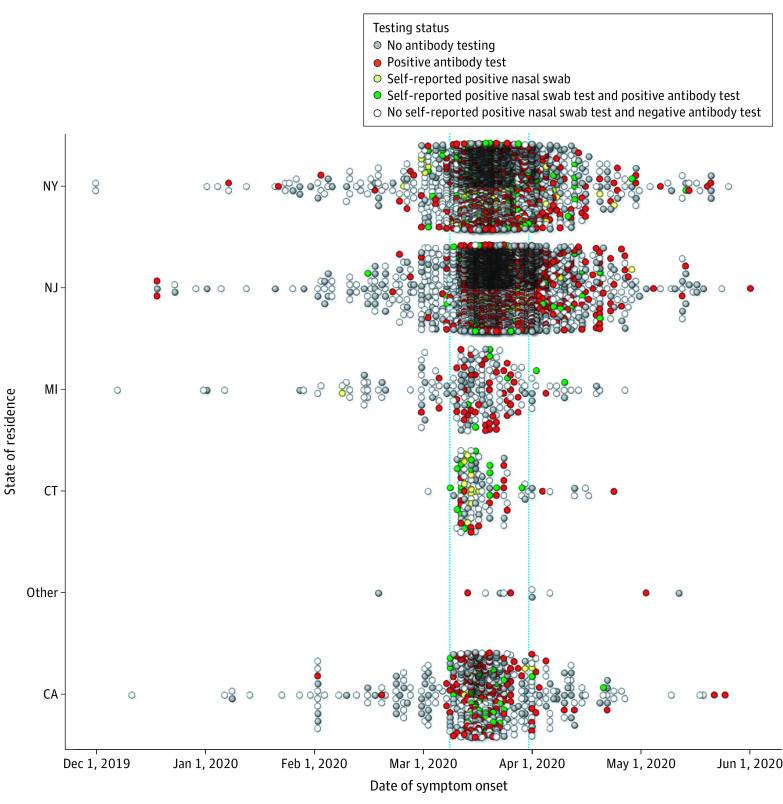
Design, setting, and participants: This cross-sectional study included adults (aged ≥18 years) recruited from the orthodox Jewish community across 5 states (California, Connecticut, Michigan, New Jersey, and New York) in 3 geographically distinct areas of the United States between May 13 and July 6, 2020. Participants completed an online survey and underwent SARS-CoV-2 antibody testing.
Main outcomes and measures: Seroprevalence and date of symptom onset of SARS-CoV-2.
Results: Overall, 9507 adults (mean [SD] age, 39.6 [15.0] years; 3777 [39.7%] women) completed the SARS-CoV-2 survey, of whom 6665 (70.1%) had immunoglobin G anti-SARS-CoV-2 antibody levels assessed. A high seroprevalence of SARS-CoV-2 antibodies was observed across all communities, with the highest proportion of positive testing observed in New Jersey (1080 of 3323 [32.5%]) and New York (671 of 2196 [30.6%]). Most individuals with a positive SARS-CoV-2 immunoglobin G antibody test reported a date of symptom-onset between March 9 and March 31, 2020 (California: 135 of 154 [87.7%]; Connecticut: 32 of 34 [94.1%]; Michigan: 44 of 50 [88.0%]; New Jersey: 964 of 1168 [82.5%]; New York: 571 of 677 [84.3%]). This start date was coincident with the Jewish festival of Purim, celebrated March 9 to 10, 2020, with extensive intracommunity spread in the weeks following (mean and mode of peak symptom onset, March 20, 2020), occurring in the absence of strong general and culture-specific public health directives.
Conclusions and relevance: This cross-sectional study of orthodox Jewish adults across the US found that socioculturally bound communities experienced early parallel outbreaks in discrete locations, notably prior to substantive medical and governmental directives. Further research should clarify optimal national, local, community-based, and government policies to prevent outbreaks in social and cultural communities that traditionally gather for holidays, assemblies, and festivals.
Conflict of interest statement
Figures

Similar articles
-
Estimated SARS-CoV-2 Seroprevalence in the US as of September 2020.JAMA Intern Med. 2021 Apr 1;181(4):450-460. doi: 10.1001/jamainternmed.2020.7976. JAMA Intern Med. 2021. PMID: 33231628 Free PMC article.
-
Seroprevalence of anti-SARS-CoV-2 IgG antibodies in the staff of a public school system in the midwestern United States.PLoS One. 2021 Jun 10;16(6):e0243676. doi: 10.1371/journal.pone.0243676. eCollection 2021. PLoS One. 2021. PMID: 34111144 Free PMC article.
-
Estimated US Infection- and Vaccine-Induced SARS-CoV-2 Seroprevalence Based on Blood Donations, July 2020-May 2021.JAMA. 2021 Oct 12;326(14):1400-1409. doi: 10.1001/jama.2021.15161. JAMA. 2021. PMID: 34473201 Free PMC article.
-
Estimated SARS-CoV-2 Seroprevalence in US Patients Receiving Dialysis 1 Year After the Beginning of the COVID-19 Pandemic.JAMA Netw Open. 2021 Jul 1;4(7):e2116572. doi: 10.1001/jamanetworkopen.2021.16572. JAMA Netw Open. 2021. PMID: 34251441 Free PMC article.
-
Prevalence of SARS-CoV-2 antibodies in a large nationwide sample of patients on dialysis in the USA: a cross-sectional study.Lancet. 2020 Oct 24;396(10259):1335-1344. doi: 10.1016/S0140-6736(20)32009-2. Epub 2020 Sep 25. Lancet. 2020. PMID: 32987007 Free PMC article.
Cited by
-
"If a rabbi did say 'you have to vaccinate,' we wouldn't": Unveiling the secular logics of religious exemption and opposition to vaccination.Soc Sci Med. 2021 Jul;280:114052. doi: 10.1016/j.socscimed.2021.114052. Epub 2021 May 21. Soc Sci Med. 2021. PMID: 34051560 Free PMC article.
-
Knowledge and Attitudes Toward Covid-19 and Vaccines Among a New York Haredi-Orthodox Jewish Community.J Community Health. 2021 Dec;46(6):1161-1169. doi: 10.1007/s10900-021-00995-0. Epub 2021 May 17. J Community Health. 2021. PMID: 33999317 Free PMC article.
-
Rituals of Contagion in Closed Religious Communities: A Case Study of Amish and Mennonite Communities in the USA During the Beginning of the COVID-19 Pandemic.J Relig Health. 2022 Oct;61(5):4260-4281. doi: 10.1007/s10943-022-01615-4. Epub 2022 Jul 26. J Relig Health. 2022. PMID: 35882764 Free PMC article.
-
Is stronger religious faith associated with a greater willingness to take the COVID-19 vaccine? Evidence from Israel and Japan.Eur J Health Econ. 2022 Jun;23(4):687-703. doi: 10.1007/s10198-021-01389-8. Epub 2021 Oct 22. Eur J Health Econ. 2022. PMID: 34677722 Free PMC article.
-
Localising vaccination services: Qualitative insights on public health and minority group collaborations to co-deliver coronavirus vaccines.Vaccine. 2022 Mar 25;40(14):2226-2232. doi: 10.1016/j.vaccine.2022.02.056. Epub 2022 Feb 17. Vaccine. 2022. PMID: 35216844 Free PMC article.
References
-
- Cheng HY, Jian SW, Liu DP, Ng TC, Huang WT, Lin HH; Taiwan COVID-19 Outbreak Investigation Team . Contact tracing assessment of COVID-19 transmission dynamics in Taiwan and risk at different exposure periods before and after symptom onset. JAMA Intern Med. 2020;180(9):1156-1163. doi:10.1001/jamainternmed.2020.2020 - DOI - PMC - PubMed
Publication types
MeSH terms
Grants and funding
LinkOut - more resources
Full Text Sources
Other Literature Sources
Medical
Miscellaneous
