Measuring potential effects of the developmental burden associated with the vertebrate notochord
- PMID: 33689235
- PMCID: PMC9291948
- DOI: 10.1002/jez.b.23032
Measuring potential effects of the developmental burden associated with the vertebrate notochord
Abstract
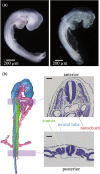
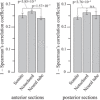
The notochord functions primarily as a supporting tissue to maintain the anteroposterior axis of primitive chordates, a function that is replaced entirely by the vertebral column in many vertebrates. The notochord still appears during vertebrate embryogenesis and plays a crucial role in the developmental pattern formation of surrounding structures, such as the somites and neural tube, providing the basis for the vertebrate body plan. The indispensable role of the notochord has often been referred to as the developmental burden and used to explain the evolutionary conservation of notochord; however, the existence of this burden has not been successfully exemplified so far. Since the adaptive value of target tissues appears to result in the evolutionary conservation of upstream structures through the developmental burden, we performed comparative gene expression profiling of the notochord, somites, and neural tube during the mid-embryonic stages in turtles and chicken to measure their evolutionary conservation. When compared with the somites and neural tube, overall gene expression profiles in the notochord showed significantly lower or merely comparable levels of conservation. However, genes involved in inductive signalings, such as the sonic hedgehog (Shh) cascade and the formation of functional primary cilia, showed relatively higher levels of conservation in all the three structures analyzed. Collectively, these results suggest that shh signals are critical as the inductive source and receiving structures, possibly constituting the inter-dependencies of developmental burden.
Keywords: developmental burden; evolution; gene expression profile; notochord; phylotypic period.
© 2021 The Authors. Journal of Experimental Zoology Part B: Molecular and Developmental Evolution published by Wiley Periodicals LLC.
Conflict of interest statement
The authors declare that there are no conflict of interests.
Figures


Similar articles
-
Sonic hedgehog in temporal control of somite formation.Proc Natl Acad Sci U S A. 2010 Jul 20;107(29):12907-12. doi: 10.1073/pnas.1000979107. Epub 2010 Jul 1. Proc Natl Acad Sci U S A. 2010. PMID: 20615943 Free PMC article.
-
Shh regulates chick Ebf1 gene expression in somite development.Gene. 2015 Jan 1;554(1):87-95. doi: 10.1016/j.gene.2014.10.028. Epub 2014 Oct 23. Gene. 2015. PMID: 25455103
-
Mediolateral patterning of somites: multiple axial signals, including Sonic hedgehog, regulate Nkx-3.1 expression.Mech Dev. 1998 Jan;70(1-2):25-34. doi: 10.1016/s0925-4773(97)00168-8. Mech Dev. 1998. PMID: 9510022
-
The mechanisms of dorsoventral patterning in the vertebrate neural tube.Dev Biol. 2005 Jun 1;282(1):1-13. doi: 10.1016/j.ydbio.2005.02.027. Dev Biol. 2005. PMID: 15936325 Review.
-
The notochord: structure and functions.Cell Mol Life Sci. 2015 Aug;72(16):2989-3008. doi: 10.1007/s00018-015-1897-z. Epub 2015 Apr 2. Cell Mol Life Sci. 2015. PMID: 25833128 Free PMC article. Review.
Cited by
-
Coronary artery established through amniote evolution.Elife. 2023 Aug 22;12:e83005. doi: 10.7554/eLife.83005. Elife. 2023. PMID: 37605519 Free PMC article.
-
Derivedness Index for Estimating Degree of Phenotypic Evolution of Embryos: A Study of Comparative Transcriptomic Analyses of Chordates and Echinoderms.Front Cell Dev Biol. 2021 Nov 26;9:749963. doi: 10.3389/fcell.2021.749963. eCollection 2021. Front Cell Dev Biol. 2021. PMID: 34900995 Free PMC article.
References
-
- Abzhanov, A. (2013). von Baer's law for the ages: Lost and found principles of developmental evolution. Trends in Genetics, 29, 712–722. - PubMed
-
- Alan, C. L. (2014). Conceptual change in biology: Scientific and philosophical perspectives on evolution and development. Springer.
-
- Duboule, D. (1994). Temporal colinearity and the phylotypic progression: A basis for the stability of a vertebrate Bauplan and the evolution of morphologies through heterochrony. Development, 1994(Suppl), 135–142. - PubMed
Publication types
MeSH terms
Substances
LinkOut - more resources
Full Text Sources
Other Literature Sources

