. 2021 Apr 9;7(4):759-776.
doi: 10.1021/acsinfecdis.0c00454. Epub 2021 Mar 10.

Violacein-Induced Chaperone System Collapse Underlies Multistage Antiplasmodial Activity

Affiliations

Violacein-Induced Chaperone System Collapse Underlies Multistage Antiplasmodial Activity

Tatyana Almeida Tavella et al. ACS Infect Dis. .

Abstract

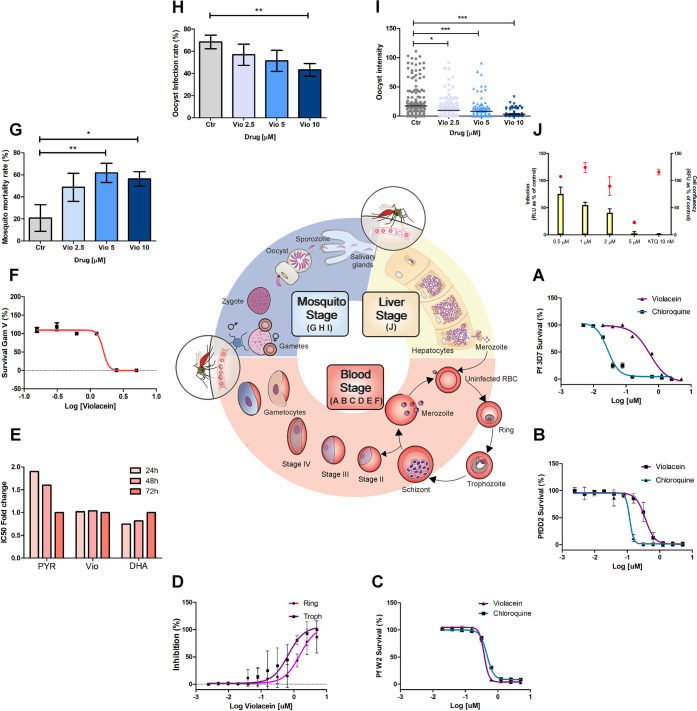
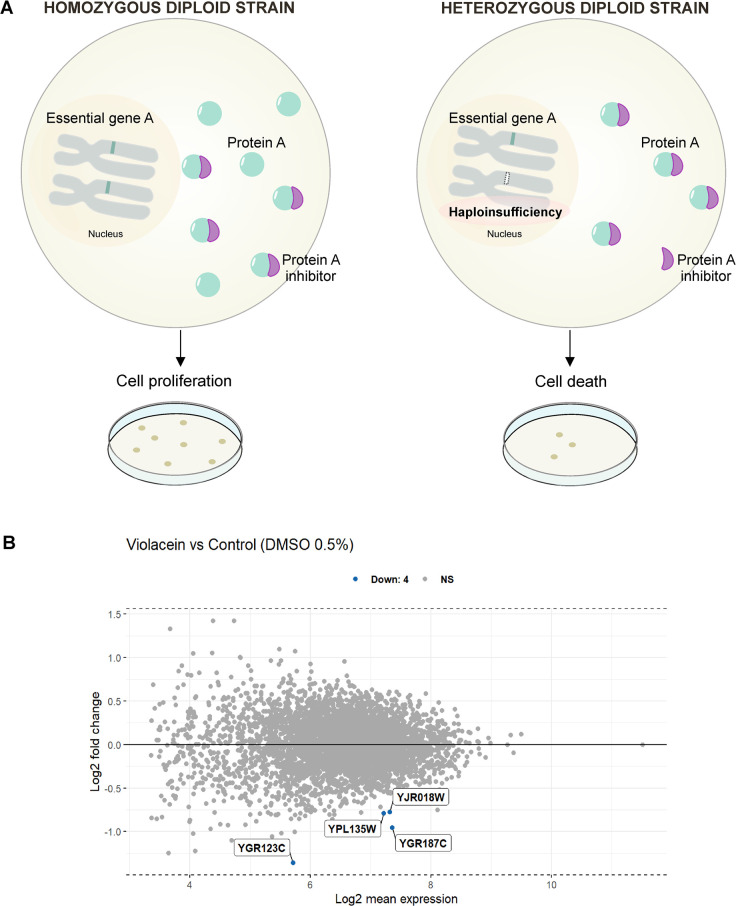
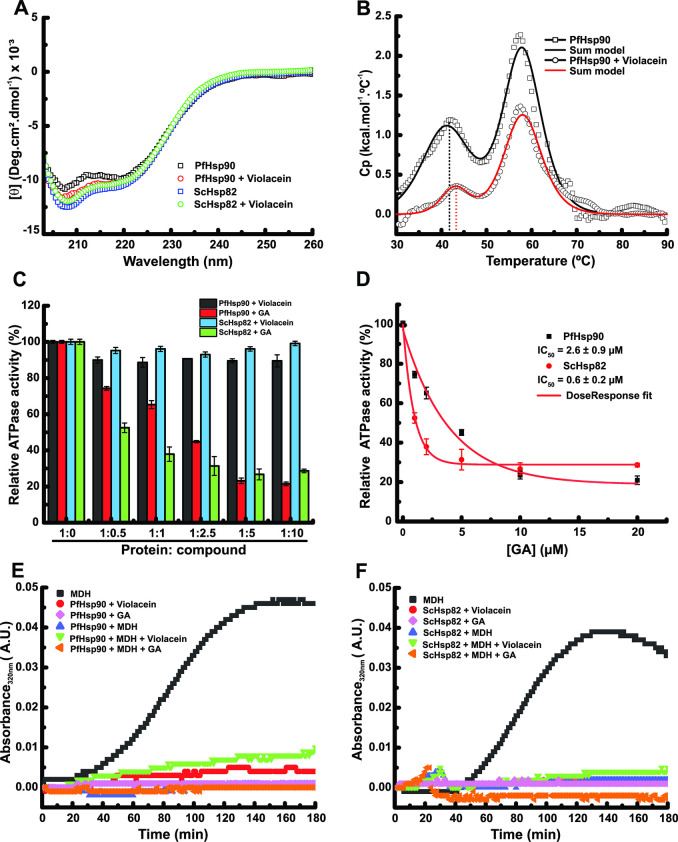
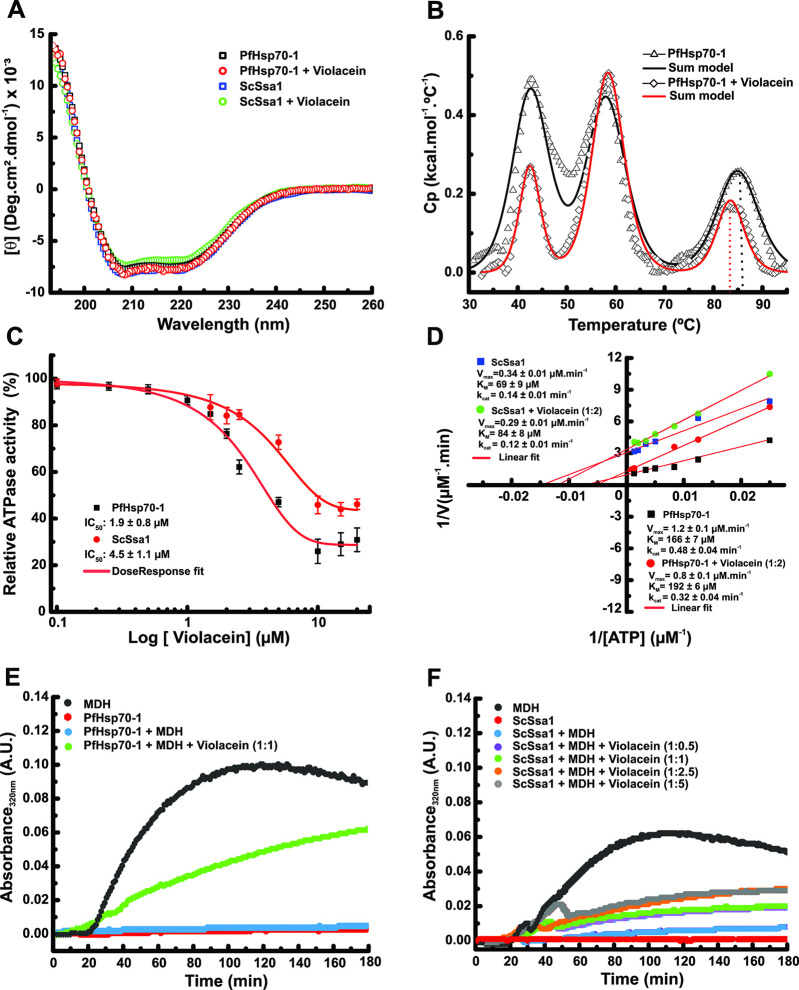
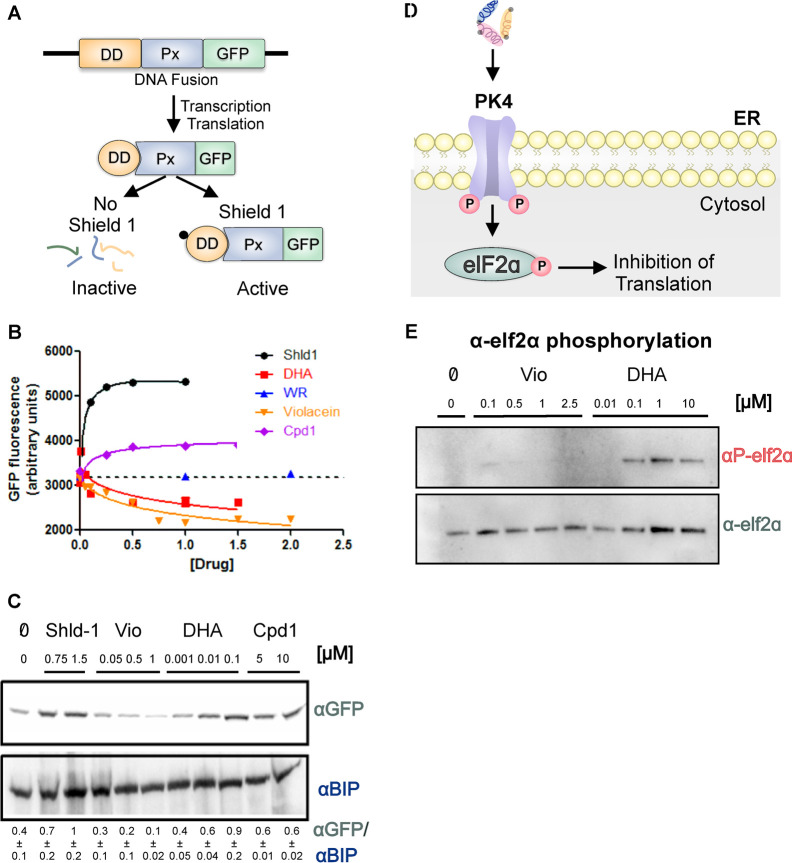
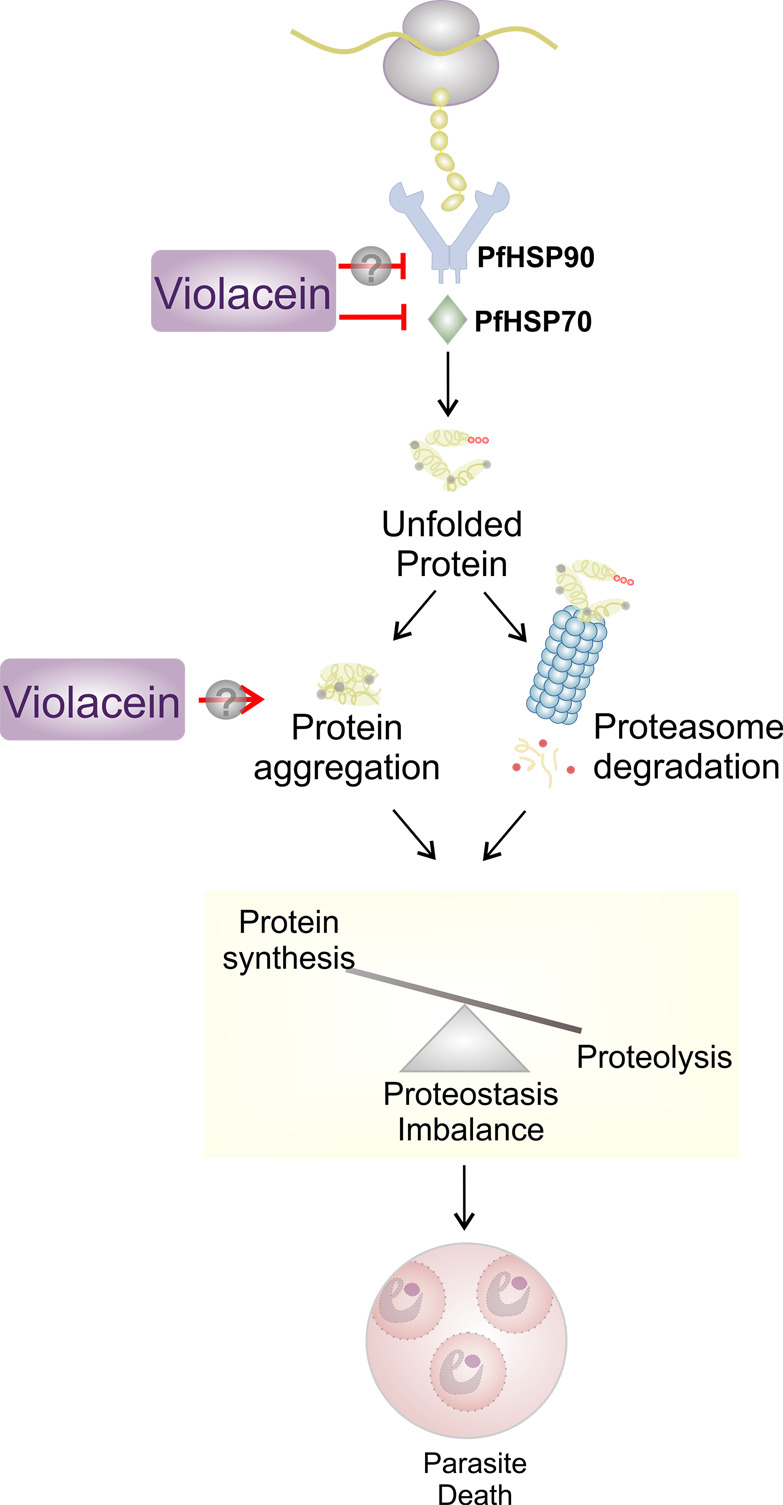
Antimalarial drugs with novel modes of action and wide therapeutic potential are needed to pave the way for malaria eradication. Violacein is a natural compound known for its biological activity against cancer cells and several pathogens, including the malaria parasite, Plasmodium falciparum (Pf). Herein, using chemical genomic profiling (CGP), we found that violacein affects protein homeostasis. Mechanistically, violacein binds Pf chaperones, PfHsp90 and PfHsp70-1, compromising the latter's ATPase and chaperone activities. Additionally, violacein-treated parasites exhibited increased protein unfolding and proteasomal degradation. The uncoupling of the parasite stress response reflects the multistage growth inhibitory effect promoted by violacein. Despite evidence of proteotoxic stress, violacein did not inhibit global protein synthesis via UPR activation-a process that is highly dependent on chaperones, in agreement with the notion of a violacein-induced proteostasis collapse. Our data highlight the importance of a functioning chaperone-proteasome system for parasite development and differentiation. Thus, a violacein-like small molecule might provide a good scaffold for development of a novel probe for examining the molecular chaperone network and/or antiplasmodial drug design.

Keywords: chaperone inhibitor; chemogenomics; malaria; proteostasis; violacein.


Conflict of interest statement

The authors declare no competing financial interest.

Figures

Figure 1
Figure 1
Violacein multistage antimalarial activity. (A–C) Violacein in vitro activity against asexual stage P. falciparum 3D7 strain (A) and chloroquine-resistant strains: Dd2 (B) and W2 (C). Graphs were calculated according with SYBRGreen measurements, and error bars represent SEM (n = 3). (D) Violacein stage specificity within asexual parasites. Error bars represents SD (n = 3). (E) Violacein speed of action. Asynchronous 3D7 parasites were treated with violacein for different times (24 and 48 h) to determine the EC50 fold changes in relation to the EC50 determined at 72 h. Pyrimethamine (PYR) and dihydroartemisinin (DHA) were used as controls for slow and fast killing compounds, respectively. The data represents one independent experiment (with internal replicates n = 3). (F) Violacein activity against stage V gametocytes; violacein EC50 = 2.5 and 1.25 μM. The data represent the means ± SD (n = 3). (G) Anopheles aquasalis mosquitoes were fed with blood samples collected from patients infected with P. vivax supplemented with different concentrations of violacein. Compound insecticide activity was evaluated as the relation between dead and fed mosquitoes. The data represent the means ± SEM (n = 6). (H) Oocyst infection rates were determined as a relation between infected and fed mosquitoes. The data represent the means ± SEM (n = 6). (I) Oocyst intensity in violacein treated groups. Dots represent oocyst counts present in the midgut of each dissected mosquito; solid lines represent mean values of oocyst counts found in mosquito groups fed with blood submitted to different violacein treatments. The data represent the means ± SEM (n = 6). (J) Inhibition of P. berghei hepatic infection in vitro by violacein. Atovaquone (ATQ) was used as a positive control. The data represent the means ± SD of triplicates (n = 1). The bars represent parasite load, assessed by the relative luminescence 48 h after infection of Huh7 cells with luciferase-expressing P. berghei sporozoites, whereas the dots represent cell confluency.
Figure 2
Figure 2
Violacein affects the chaperone system. (A) CGP works by comparing the growth of a pool of heterozygous diploid strains that was treated with a compound of interest with a pool treated with vehicle control, in a way to identify possible pathways targeted by the compound of study. As each mutant yeast strain carries a specific DNA-barcode, differential growth can be assessed by barcode sequencing. (B) Haploinsufficiency profile of heterozygous yeast pools treated with violacein. The log fold change is plotted on the y-axis as a function of the heterozygous yeast strains ordered alphabetically by their respective ORFs. The labels highlight the mutants that meet the condition of adjusted p-value < 0.01 and log2 fold change < 0. The four hits labeled are yeast strains heterozygous for YGR123C (ScPpt1 protein), YGR187C (ScHgh1 protein), YPL135W (ScIsu protein), and YJR018W (dubious ORF).
Figure 3
Figure 3
Violacein interactions with PfHsp90 and yHsp82 chaperones. (A) Structural changes in PfHsp90 and yHsp82 proteins in the presence of an equimolar concentration of violacein, determined by far-UV CD (n = 2). (B) Thermal unfolding of PfHsp90 in the presence of violacein, determined using DSC (n = 2). The black and red dot lines highlight the differences in the first Tm, respectively, observed for the PfHsp90 protein in the absence (Tm1 = 41.0 ± 0.2 °C) and the presence of violacein (Tm1 = 43 ± 0.2 °C) (n = 2). (C) Bar graph of the relative ATPase activity of the PfHsp90 and yHsp82 proteins against different proportions of violacein and GA (n = 2). (D) Relative ATPase activity assays for PfHsp90 and yHsp82 proteins as a function of GA concentrations. GA inhibited PfHsp90 and yHsp82 ATPase activity with IC50 values of 2.6 ± 0.9 and 0.6 ± 0.2 μM, respectively. Dose–response fitting performed by OriginPro 2016 software (n = 2). (E–F) Chaperone activity assays were performed using MDH protein as a model and an equimolar concentration of violacein and PfHsp90 (E) or yHsp82 (F). Black, blue, green, and orange symbols indicate MDH aggregation, MDH aggregation in the presence of PfHsp90 or yHsp82, MDH aggregation in the presence of PfHsp90 or yHsp82 and violacein, MDH aggregation in the presence of PfHsp90 or yHsp82 and GA, and PfHsp90 or yHsp82 aggregation alone, respectively. The controls of the chaperones in the presence of violacein or GA are indicated by the red and lilac symbols, respectively (n = 2).
Figure 4
Figure 4
Violacein interactions with PfHsp70-1 and SSA1 chaperones. (A) Structural changes in PfHsp70-1 and SSA1 proteins in the presence of an equimolar concentration of violacein, determined by far-UV CD (n = 2). (B) Thermal unfolding of PfHsp70-1 in the presence of violacein, determined using DSC. The black and red dotted lines highlight the differences in the third Tm observed for the PfHsp70-1 protein respectively in the absence (Tm3 = 85.0 + 0.1 °C) and presence of violacein (Tm3 = 83.5 + 0.1 °C) (n = 2). (C) Relative ATPase activity for PfHsp70-1 and SSA1 proteins in the presence of different violacein concentrations. The dose–response curves illustrate the inhibition profile, obtaining IC50 values of 1.9 ± 0.8 and 4.5 ± 1.1 μM, respectively. Dose–response fitting performed by OriginPro 2016 software (n = 2). (D) Lineweaver–Burk graphs for PfHsp70-1 and SSA1 proteins ATPase activity in the absence and in the presence of violacein suggesting noncompetitive or mixed inhibition mechanism, abruptly changing the Vmax values and smoothly altering KM. (inset) Enzyme kinetic properties at each condition. The Vmax, KM and kcat values for PfHsp70-1 in the absence of violacein were 1.2 ± 0.1 μM/min, 166 ± 7 μM, and 0.48 ± 0.04 1/min. The Vmax, KM, and kcat values for the PfHsp70-1 in the presence of violacein (1:2) were 0.8 ± 0.1 μM/min, 192 ± 6 μM, and 0.32 ± 0.04 1/min, respectively. The Vmax, KM, and kcat values for the SSA1 in the absence of violacein were 0.34 ± 0.01 μM/min, 69 ± 9 μM, and 0.14 ± 0.01 1/min. The Vmax, KM, and kcat values for the SSA1 in the presence of violacein (1:2) were 0.29 ± 0.01 μM/min, 84 ± 8 μM, and 0.12 ± 0.01 1/min, respectively. Enzyme kinetic properties at each condition estimated by linear fitting routine implemented by OriginPro 2016 software, accordingly to Lineweaver–Burk equation (n = 2). (E) Chaperone activity assays were performed using MDH as a client protein model and an equimolar concentration of violacein and PfHsp70-1. Black, blue, green, and red symbols indicate MDH aggregation, MDH aggregation in the presence of PfHsp70-1, MDH aggregation in the presence of PfHsp70-1 and violacein, and PfHsp70-1 aggregation alone, respectively (n = 2).(F) Assays for SSA1 chaperone activity were performed using MDH as a client protein model and different proportions of violacein. Black, blue, lilac, green, orange, gray, and red symbols indicate MDH aggregation, MDH aggregation in the presence of SSA1, MDH aggregation in the presence of SSA1 and violacein (1:0.5), MDH aggregation in the presence of SSA1 and violacein (1:1), MDH aggregation in the presence of SSA1 and violacein (1:2.5), MDH aggregation in the presence of SSA1 and violacein (1:5), and SSA1 aggregation alone, respectively (n = 2).
Figure 5
Figure 5
UPR and UPS response in Plasmodium upon violacein treatment. (A) P. falciparum 3D7-GFP-DD mutant parasite design. A gene encoding a destabilizing domain (DD) that is only stable in the presence of its ligand Shield-1, together with a GFP reporter gene (GFP) were attached to a protein known to be degraded by the Plasmodium proteasome (Px). In the presence of Shield-1, Px acquires a stable conformation and can be monitored by fluorescence via its GFP domain, while in the absence of Shield-1, Px gets unfolded due to the loss of the DD conformation and is targeted to proteasome degradation. (B) GFP fluorescence signals from mutant parasites are maintained in Shield-1 for 24 h before wash-out. Trophozoites were then treated for 3 h with compounds of interest: Shield (black), DHA (red), WR (blue), Cpd1 (purple), and violacein (orange) and fluorescence units were recorded by flow cytometry. Concentrations of Shield-1, violacein, DHA, and cpd1 are given in μM; WR in nM × 10. The dotted line represents background (sample fluorescence without Shield-1) (n = 3). (C) The same mutant parasites analyzed in B were lysed, subjected to Western blotting, and probed with anti-GFP. The concentration (μM) of compound used for the samples subjected to Western blotting is shown below the name of each compound. Anti-Bip was used as a loading control. Densitometry analysis (ImageJ) of the ratio between αGFP/αBip (mean ± SE) is shown in the gray box (n = 3). (D) PK4 pathway activation in Plasmodium. Protein Kinase 4 (PK4) is an ER transmembrane protein that plays a major role in Plasmodium UPR. It is proposed that under ER stress conditions, unfolded peptides compete with PK4 for binding immunoglobulin protein (Bip) binding, causing the dissociation of Bip–PK4 interactions. Once no longer bound to Bip, it is suggested that the N-terminal domains of PK4 dimerize, inducing the autophosphorylation of the C-terminal eIF2a kinase domain, followed by phosphorylation eIF2a, which then leads to shut down in protein translation. (E) Western blotting against p-eIF2α. NF54 parental line parasites were treated with different doses of violacein, DHA, or vehicle for 90 min at 37 °C, and parasite lysates were used for Western blotting. The concentration (μM) of the compound used for Western blotting is shown below the name of each compound. Anti-eIf2α was used as a loading control as indicated in the figure. (n = 2).
Figure 6
Figure 6
Proposed mechanism for violacein mode-of-action in Plasmodium. Violacein promotes PfHsp70-1 inhibition with possible impairment on PfHsp90 chaperone activity, preventing folding of damaged and newly synthesized peptides. Chaperone overburden shifts its function toward proteolytic pathways, culminating in protein polyubiquitination and intense proteasome degradation that leads to imbalanced proteostasis, causing parasite death. Despite intense proteolysis, protein synthesis continues, possibly in an attempt to compensate for the loss of essential proteins by the proteasome, reinforcing violacein-induced proteostasis collapse.

Similar articles

Cited by

References

    1. World Health Organization . World Malaria Report 2019; Geneva, 2019.
    1. Cowman A. F.; Healer J.; Marapana D.; Marsh K. (2016) Review Malaria: Biology and Disease. Cell 167 (3), 610–624. 10.1016/j.cell.2016.07.055. - DOI - PubMed
    1. Derbyshire E. R.; Mota M. M.; Clardy J. (2011) The Next Opportunity in Anti-Malaria Drug Discovery: The Liver Stage. Plos Pathog. 10.1371/journal.ppat.1002178. - DOI - PMC - PubMed
    1. Delves M. J.; Angrisano F.; Blagborough A. M. (2018) Antimalarial Transmission-Blocking Interventions: Past, Present, and Future. Trends Parasitol. 34 (9), 735–746. 10.1016/j.pt.2018.07.001. - DOI - PubMed
    1. Malaria: Strategy Overview; Bill Melinda Gates Foundation, 2011; April, pp 1–6.

Publication types

LinkOut - more resources