. 2021 Aug 19;32(18):1614-1623.
doi: 10.1091/mbc.E20-01-0089. Epub 2021 Mar 10.

Osmosensing by WNK Kinases

Affiliations

Osmosensing by WNK Kinases

Radha Akella et al. Mol Biol Cell. .

Abstract

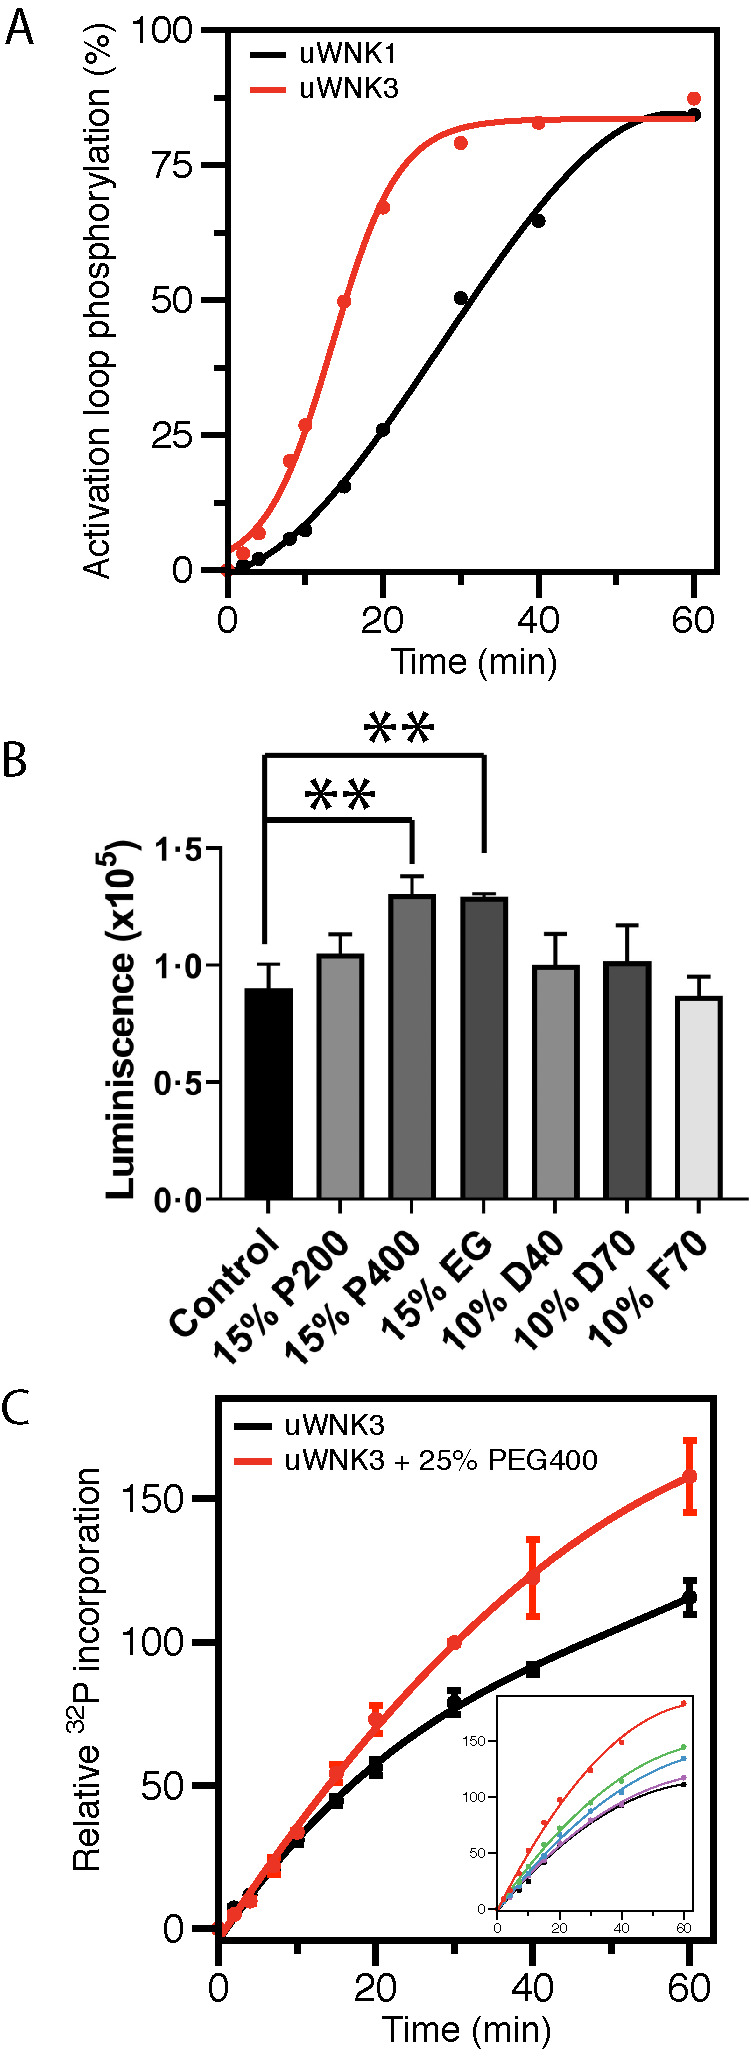
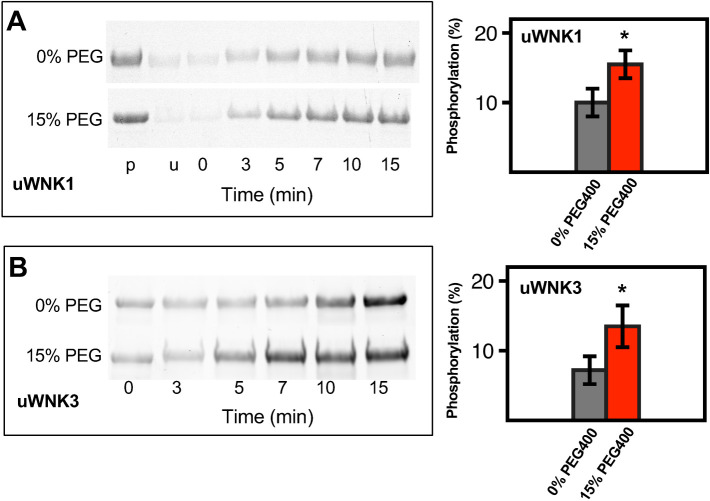
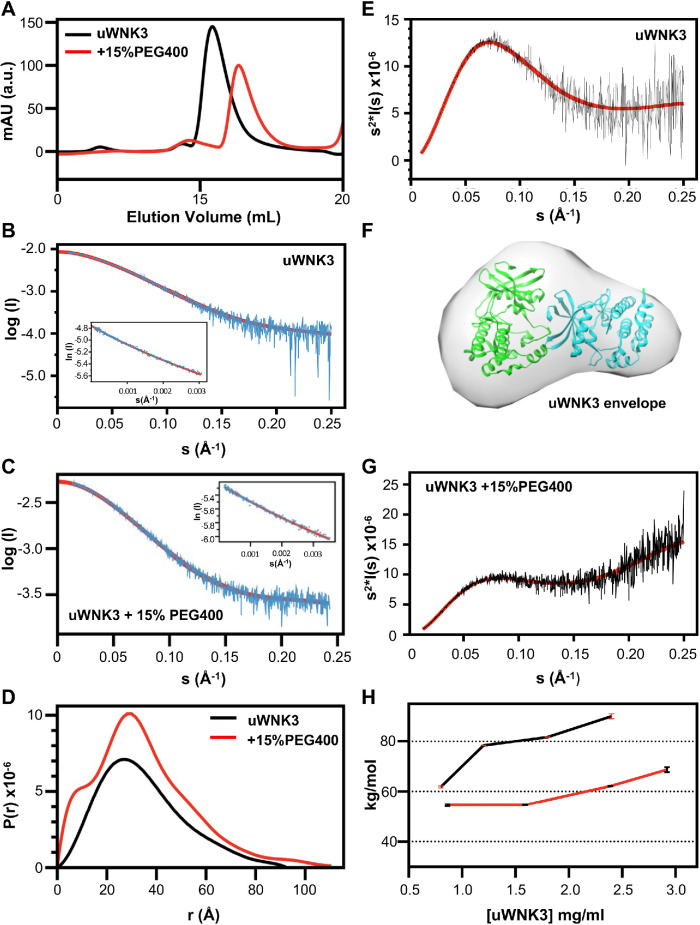
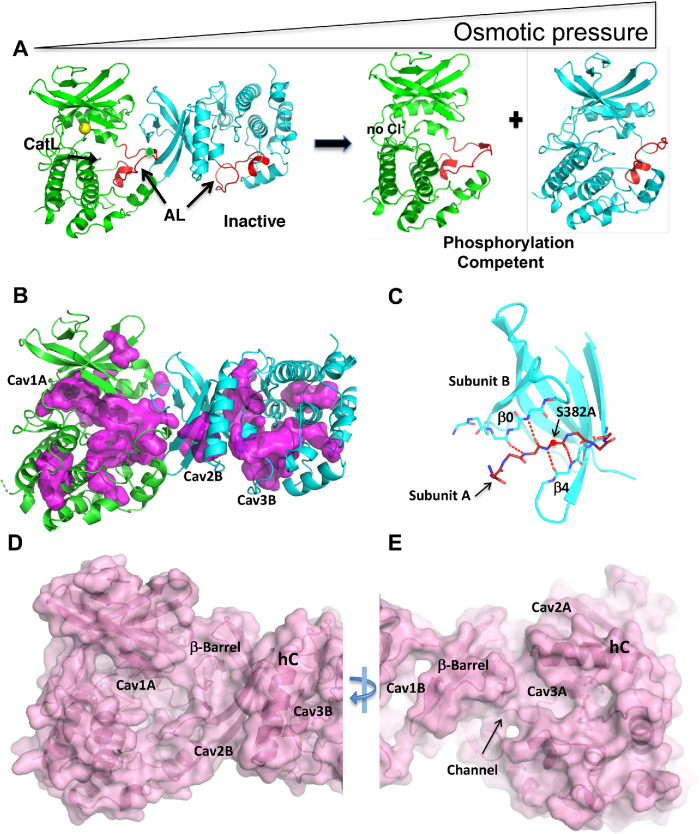
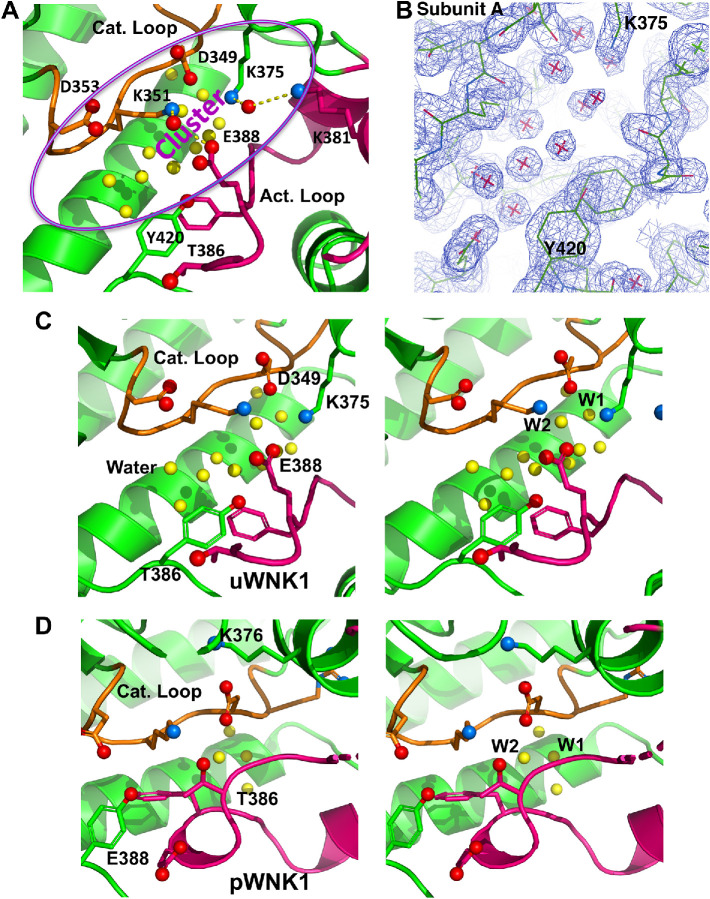
With No Lysine (K) WNK kinases regulate electro-neutral cotransporters that are controlled by osmotic stress and chloride. We showed previously that autophosphorylation of WNK1 is inhibited by chloride, raising the possibility that WNKs are activated by osmotic stress. Here we demonstrate that unphosphorylated WNK isoforms 3 and 1 autophosphorylate in response to osmotic pressure in vitro, applied with the crowding agent polyethylene glycol (PEG)400 or osmolyte ethylene glycol (EG), and that this activation is opposed by chloride. Small angle x-ray scattering of WNK3 in the presence and absence of PEG400, static light scattering in EG, and crystallography of WNK1 were used to understand the mechanism. Osmosensing in WNK3 and WNK1 appears to occur through a conformational equilibrium between an inactive, unphosphorylated, chloride-binding dimer and an autophosphorylation-competent monomer. An improved structure of the inactive kinase domain of WNK1, and a comparison with the structure of a monophosphorylated form of WNK1, suggests that large cavities, greater hydration, and specific bound water may participate in the osmosensing mechanism. Our prior work showed that osmolytes have effects on the structure of phosphorylated WNK1, suggestive of multiple stages of osmotic regulation in WNKs.


Figures

FIGURE 1:
FIGURE 1:
Activity of uWNK3 and uWNK1. (A) In vitro autophosphorylation of the primary activating phosphorylation sites of uWNK3 (Ser 308) (red) (R-value = 0.996) and uWNK1 (Ser382) (black) (R-value = 0.998) tracked by mass spectrometry over time. (B) Total phosphorylation (both gOSR1 peptide and uWNK3 autophosphorylation) in the presence of crowding agents, PEG200/400 (P200/P400), dextran40/70 (D40/D70), and Ficoll70 (F70), and an osmolyte, EG at 15 min, 25°C. Luminescence is proportional to ATP consumption as measured using ADP-Glo. **P < 0.01. (C) Time-course of uWNK3 autophosphorylation with (red) and without (black) 25% vol/vol PEG400 tracked by 32P incorporation. Inset shows progress curves over 60 min with increasing PEG400. Colors for the inset: black (0% PEG400), purple (5%), blue (10%), green (15%), and red (25%). Error bars are SDs from triplicate measurements.
FIGURE 2:
FIGURE 2:
Effects of PEG400 on uWNK1 and uWNK3 autophosphorylation and substrate phosphorylation. (A) Time-course of uWNK1 autophosphorylation with and without PEG400 visualized by Pro-Q Diamond phospho-protein stain at indicated times. Densitometry of triplicated gels shown in associated bar graph. *p < 0.1 (right). (B) Time-course of uWNK3 autophosphorylation with and without PEG400.
FIGURE 3:
FIGURE 3:
Size and shape of uWNK3 ∓ 15% PEG400 from SEC-SAXS and SLS. (A) uWNK3 SEC elution profile (no PEG, black, 15% PEG400, red). uWNK3 scattering profile vs. s and Guinier plot (insert), (B) without PEG400, and (C) with PEG400. Scattering data are cyan, best fit from PRIMUS is red and shown extrapolated to I(0). The scattering curve was truncated at s = 0.25 Å–1. Fit to the Guinier approximation (red). (D) Pairwise distance distribution functions for uWNK3 (black) and uWNK3 with 15% PEG400 (red). (E) Kratky plot (I(s)*s2 vs. s) for uWNK3 (black) with averaged plot (red). (F) Envelope for uWNK3 (generated in DAMMIF) superimposed in CHIMERA on PDB file 6CN9 (dimeric WNK1). (G) Kratky plot uWNK3 in 15% PEG400. (H) SLS of uWNK3 (black) and uWNK3 in 10% EG (red).
FIGURE 4:
FIGURE 4:
Model for osmotic pressure-induced autophosphorylation involving changes in oligomerization and cavities. (A) Inactive dimer to phosphorylation-competent monomer equilibrium model based on the structure of WNK1SA (PDB file 6CN9). Subunit A is green, Subunit B is cyan, Activation Loops are red, and chloride is yellow. (B) WNK1SA cavities, displayed in magenta, for Subunits A and B as calculated in PyMOL. Cavities in WNK1SA (Cav1A, Cav2B, and Cav3B) are labeled. (C) Dimer interface. The Activation Loop encompassing the phosphorylation site at position 382 (alanine in WNK1SA) is inserted as a β-strand in the β-sheet of Subunit B. (D) Surface rendering of WNK1SA (same view as B) calculated in PyMOL highlighting the Cav1A indentation. (E) Surface rendering rotated 180° about the y-axis from D showing a channel and Cav3A.
FIGURE 5:
FIGURE 5:
Cluster of charged residues in the Catalytic Loop and the Activation Loop in WNK1SA with associated buried water. (A) Cluster of charged residues in the WNK1SA active site with participating residues rendered in ball and stick and highlighted in purple oval. Buried waters underneath ion pairs are yellow. (B) Electron density on water molecules (contoured at 1σ). Same orientation as in A and centered on the water. (C) Stereogram of WNK1SA Catalytic Loop and Activation Loop (similar view as in A). (D) Stereogram of pWNK1 Catalytic Loop and Activation Loop (PDB 5W7T) viewed from the same perspective as C.

References

    1. Airola MV, Sukomon N, Samanta D, Borbat PP, Freed JH, Watts KJ, Crane BR (2013). HAMP domain conformers that propagate opposite signals in bacterial chemoreceptors. PLoS Biol 11, e1001479. - PMC - PubMed
    1. Akella R, Drozdz MA, Humphreys JM, Jiou J, Durbacz MZ, Mohammed ZJ, He H, Liwocha J, Sekulski K, Goldsmith EJ (2020). A phosphorylated intermediate in the activation of WNK kinases. Biochemistry 59, 1747–1755. - PMC - PubMed
    1. Begum G, Yuan H, Kahle KT, Li L, Wang S, Shi Y, Shmukler BE, Yang S-S, Lin S-H, Alper SL, Sun D (2015). Inhibition of WNK3 kinase signaling reduces brain damage and accelerates neurological recovery after stroke. Stroke 46, 1956–1965. - PMC - PubMed
    1. Ben-Ari Y (2017). NKCC1 chloride importer antagonists attenuate many neurological and psychiatric disorders. Trends Neurosci 40, 536–554. - PubMed
    1. Bergaya S, Faure S, Baudrie V, Rio M, Escoubet B, Bonnin P, Henrion D, Loirand G, Achard JM, Jeunemaitre X, Hadchouel J (2011). WNK1 regulates vasoconstriction and blood pressure response to alpha 1-­adrenergic stimulation in mice. Hypertension 58, 439–445. - PubMed

Publication types

MeSH terms

LinkOut - more resources