. 2021 Mar 8;39(3):380-393.e8.
doi: 10.1016/j.ccell.2021.02.003.

A hotspot mutation in transcription factor IKZF3 drives B cell neoplasia via transcriptional dysregulation

Affiliations

A hotspot mutation in transcription factor IKZF3 drives B cell neoplasia via transcriptional dysregulation

Gregory Lazarian et al. Cancer Cell. .

Abstract

Hotspot mutation of IKZF3 (IKZF3-L162R) has been identified as a putative driver of chronic lymphocytic leukemia (CLL), but its function remains unknown. Here, we demonstrate its driving role in CLL through a B cell-restricted conditional knockin mouse model. Mutant Ikzf3 alters DNA binding specificity and target selection, leading to hyperactivation of B cell receptor (BCR) signaling, overexpression of nuclear factor κB (NF-κB) target genes, and development of CLL-like disease in elderly mice with a penetrance of ~40%. Human CLL carrying either IKZF3 mutation or high IKZF3 expression was associated with overexpression of BCR/NF-κB pathway members and reduced sensitivity to BCR signaling inhibition by ibrutinib. Our results thus highlight IKZF3 oncogenic function in CLL via transcriptional dysregulation and demonstrate that this pro-survival function can be achieved by either somatic mutation or overexpression of this CLL driver. This emphasizes the need for combinatorial approaches to overcome IKZF3-mediated BCR inhibitor resistance.

Keywords: BCR signaling; CLL; IKZF3; NF-κB; murine mode.


Conflict of interest statement

Declaration of interests C.J.W. is an equity holder of Biontech, Inc. and receives research funding from Pharmacyclics. D.S.N. has been a consultant for H3 Biomedicine and received research funding from Celgene. J.A.B. reports receiving grant support and advisory board fees from Pharmacyclics, grant support, advisory board fees, and lecture fees from Gilead, advisory board fees from AstraZeneca, and lecture fees and travel support from Janssen. T.J.K. has received research funding and/or has served as an advisor to Ascerta/AstraZeneca, Celgene, Genentech/Roche, Gilead, Janssen, Loxo Oncology, Octernal Therapeutics, Pharmacyclics/AbbVie, TG Therapeutics, VelosBio, and Verastem. Cirmtuzumab was developed by T.J.K. and licensed by the University of California to Oncternal Therapeutics, Inc., which has provided stock/options to the university and T.J.K. All other authors do not have any relevant conflict of interest.

Figures

Figure 1:
Figure 1:. Conditional expression of Ikzf3-L161R mutation in a mouse model.
(A) Schematic representation of human and murine IKZF3 gene with the exons, the corresponding zinc finger domains (Zf) and the position of the homologous mutation. (B) Allele knock-in strategy. (C) Schema of the breeding strategy. Presence of the activated Ikzf3-L161R allele was restricted in B-cell DNA as detected by DNA PCR. (D) The percentage of WT and mutant Ikzf3 alleles from pyrosequencing profiles are shown. (E) Western blot of IKZF3 protein in Ikzf3WT, Ikzf3Het and Ikzf3Homo B cells. (F) Left, immunofluorescence staining of IKZF3 WT in Ikzf3WT B cells and of IKZF3 L161R in Ikzf3Homo B cells. Right, nuclear dot density in Ikzf3WT and Ikzf3Homo B cells. The nuclear dots density was quantified using ImageJ software. Data represent the mean number of dots per nucleus counted on 100 cells in 3 Ikzf3WT and 3 Ikzf3Homo mice. Scale bar: 10μm. See also Figure S1.
Figure 2:
Figure 2:. Ikzf3 mutant mice have an abnormal splenic B cell development and function
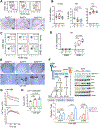
(A) Top, representative FACS plot analysis of marginal zone B cells (MZ) and follicular B cells (FO) from the total splenocytes suspension. Bottom, representative immunohistochemical staining of spleen sections from Ikzf3WT, Ikzf3Het and Ikzf3Homo mice (3 months of age). Red dash lines indicate marginal zone. Scale bar: 200μm. (B) Boxplot with an inter-quartile range represent the percentages of B cells per spleens and different B-cell populations in the spleens are shown. FO: follicular B-cells, MZ: marginal zone B-cells. Median (line inside the box), 25th (bottom line) and the 75th quartile (upper line) are indicated; whiskers mark the full range of measurements. Data were compaired using one-way ANOVA followed by Tukey’s multiple comparison test. (C) Representative FACS plot analysis of germinal center B cells (GC) from the total splenocytes suspension 10 days after immunization with sheep red blood cells (SRBC) or with the vehicle. (D) The percentage of germinal centers B cells per spleen 10 days after immunization with SRBC or with the vehicle. Data are represented and compared as per panel (B). (E) Representative immunohistochemical staining of spleen sections from immunized mice (3 months of age). Scale bars, black: 500 μm, white: 50 μm. (F) top left, BCR signaling pathway schema. Right, Representative Western Blot of BCR signaling components in splenic B cells 5 min following BCR stimulation with anti-IgM. Data represent Mean±SEM and were compaired using one-way ANOVA followed by Tukey’s multiple comparison test. (G) Calcium flux measurements following anti-IgM stimulation (top) and with ionomycin (bottom) of splenic B cells. (H) Area under the curve (AUC) of the calcium flux in B cells stimulated with anti-IgM. Data represent Mean±SEM and were compaired using one-way ANOVA followed by Tukey’s multiple comparison test. See also Figure S1 and S2.
Figure 3:
Figure 3:. Conditional expression of Ikzf3-L161R mutation is sufficient to generate murine CLL-like disease.
(A) Top, Detection of B220+CD5+ cells in peripheral blood. Bottom, number of cases of CLL and diffuse large B cell lymphoma (DLBCL) in each group. (B) Flow cytometry analysis of B220+ CD5+ cells within peripheral blood (PB), spleen (SP) and bone marrow (BM) of Ikzf3WT, Ikzf3Het-CLL and Ikzf3Homo-CLL mice. (C) Left, size of the spleens of leukemic and non-leukemic mice. Right, representative pictures of spleens of the indicated genotypes. Median values are indicated by horizontal lines; p value, unpaired t test. (D) HE staining and immunohistochemical staining of CD5+PAX5+ cells in the spleen and the bone marrow tissues. Representative spleens are shown for each group of mice. Scale bars, black: 500 μm, white: 50μm. (E) Percentage (Mean ± SEM) of CLL cells in bone marrow (BM), spleen (SP) and peritoneum cavity (PC) of CLL mice. See also Figure S3 and Table S1.
Figure 4 :
Figure 4 :. Ikzf3 mutation alters DNA binding and target selection.
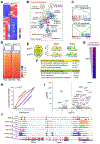
(A) Heatmap shows normalized expression of significantly deregulated genes between Ikzf3Homo and Ikzf3WT B cells (n = 3 per group). (B) Network enrichment analysis of the differentially expressed genes using Metascape. Functional categories are represented by different colors, and each circle denotes an enriched term (see Table S3). (C) GSEA for enrichment of light zone B cell genes and Btk pathway targets in Ikzf3Homo versus Ikzf3WT B cells. (D) Heatmap of IKZF3 ChIP-seq signals around all genes in the genome. TSS: transcription start site; TES: transcription end site. (E) Venn diagram of the overlap of IKZF3 peaks between Ikzf3Homo and Ikzf3WT B cells. The DNA sequence motifs of the peaks, and the number of peaks containing the motif are shown. (F) Top KEGG pathways significantly enriched for genes with WT- or mut-IKZF3 peaks. (G) Significantly changed genes, ranked by Cistrome-GO ranks (red - upregulated genes, blue-downregulated genes). (H) Cumulative distribution of up- or down-regulated genes based on Cistrome-GO ranks. Genes were equally divided into 19 bins, with the top most-ranked genes in Bin 1. (I) Log2 fold change versus logFDR of all differentially expressed genes. Red dots - topmost ranked genes per Cistrome-GO. (J) IGV tracks of ChIP-seq, ATAC-seq and RNA-seq coverage of the top three target genes in Ikzf3WT and Ikzf3Homo B cells. Red arrows - the novel/enhanced binding sites of mut-IKZF3. See also Figure S4 and Table S2–S3.
Figure 5 :
Figure 5 :. Ikzf3 mutation activates BCR signaling in CLL-like cells.
(A) Representative gating strategies for flow cytometric sorting of non-CLL B cells (B220+ CD5) and CLL-like cells (B220+ CD5+) from splenocytes, used for RNA-seq analysis. (B) PCA analysis of gene expression profiles from the collected cells. (C) Normalized expression of significantly deregulated genes between CLL-like cells and Ikzf3WT B cells (n=3–5 per group). Genes were divided into four groups based on K-means cluster. Black lines-significantly upregulated genes in Ikzf3Homo versus Ikzf3WT B cells from 3 months old mice. (D) GSEA analysis for enrichment of BCR signaling genes in CLL-like cells versus non-CLL cells from the same mice. (E) Log2FC change versus logFDR of all BCR signaling genes. FC, fold change. (F) Scatterplot of transcription factors predicted to regulate cluster I genes (% of cluster I genes regulated by certain transcription factor and the logP-value of enrichment). Line indicates p-value of 0.05. (G) Western Blot analysis of BCR signaling activity B cells from Ikzf3WT, Ikzf3Het mice (without CLL) or from Ikzf3Het CLL cells, 5 min following BCR stimulation with anti-IgM. β-ACTIN was probed as a loading control. (H) IGV tracks of ChIP-seq and ATAC-seq coverage of the Lyn gene in Ikzf3WT and Ikzf3Homo B cells. (I) Viability of cells treated for 24 h with bafetinib (5 μM), ibrutinib (5 μM), rapamycin (5 μM) or γ-secretase inhibitor (5 μM). Data were compared using a one-sided paired t test followed by Bonferroni correction. (J) Chromosomal copy-number variants in mut-Ikzf3 CLL cells detected using whole-genome sequencing. The copy-number ratios to normal tissue are shown. (K) Changes in gene expression of Chr15 genes between CLL and normal B cells. Genes were sorted by CLL/normal expression fold change (FC). (L) Expression of Myc in normal B cells and CLL cells by RNA-seq. See also Figure S5 and Table S4–S5.
Figure 6:
Figure 6:. IKZF3 as a key regulator of BCR signaling and drug response in human CLLs
(A) Heatmap shows normalized expression of significantly changed genes between IKZF3 WT (n=6) and mut (n=4) CLLs. (B) GSEA analysis for enrichment of BCR signaling genes in IKZF3 WT versus IKZF3 mutant human primary CLL cells. (C) Log2 fold change versus logFDR of differential gene expression between WT and mut CLLs; BCR signaling genes are labelled. (D) Boxplot with an inter-quartile range (IQR) indicate BCR scores (defined by mean expression (TPM) of 75 BCR signaling genes) in CLL patients with high or low IKZF3 expression (defined by median) in two independent cohorts are shown. Median is represented as a line inside the box, and the 25th and the 75th quartiles are indicated by lines at the bottom and top of the box; and whiskers indicate the range of 1.5*IQR. (E) Kaplan-Meier survival curve of CLL patients with high or low IKZF3 expression. Data were obtained from GSE22762. (F) Schematic of scRNA-seq experiment of patients undergoing ibrutinib treatment. (G) IKZF3 expression in different cell types pre- and post-treatment are shown. “%zeroes” represents the percent of total cells samples with zero expression within the population. Cell # indicates the number of cells with signals of the particular gene and are included in the box plot. (H) Expression of different BCR signaling genes in CLL cells pre- and post-treatment are shown. (I) Boxplot with an interquartile range (IQR) indicate response of primary CLL cells with either low, high or mutant IKZF3 expression to ibrutinib in vitro following BCR stimulation with anti-IgM for 24h. Median is represented as a line inside the box, and the 25th and the 75th quartile are indicated by lines at the bottom and top of the box; whiskers indicate the full range of measurements. Data were compaired using one-way ANOVA followed by Tukey’s multiple comparison test. See also Figure S6 and Table S6.

References

    1. Ahn IE, Chen Y-C, Underbayev C, Gaglione EM, Sun C, Soto S, Nierman P, Pirooznia M, and Wiestner A (2019). Diverging Clonal Evolution during Sequential Therapy with Chemoimmunotherapy Followed By BTK Inhibitors. In, (American Society of Hematology; Washington, DC: ).
    1. Bea S, Valdes-Mas R, Navarro A, Salaverria I, Martin-Garcia D, Jares P, Gine E, Pinyol M, Royo C, Nadeu F, et al. (2013). Landscape of somatic mutations and clonal evolution in mantle cell lymphoma. Proc Natl Acad Sci U S A 110, 18250–18255. - PMC - PubMed
    1. Bichi R, Shinton SA, Martin ES, Koval A, Calin GA, Cesari R, Russo G, Hardy RR, and Croce CM (2002). Human chronic lymphocytic leukemia modeled in mouse by targeted TCL1 expression. Proc Natl Acad Sci U S A 99, 6955–6960. - PMC - PubMed
    1. Billot K, Soeur J, Chereau F, Arrouss I, Merle-Beral H, Huang ME, Mazier D, Baud V, and Rebollo A (2011). Deregulation of Aiolos expression in chronic lymphocytic leukemia is associated with epigenetic modifications. Blood 117, 1917–1927. - PubMed
    1. Burger JA, Burger M, and Kipps TJ (1999). Chronic lymphocytic leukemia B cells express functional CXCR4 chemokine receptors that mediate spontaneous migration beneath bone marrow stromal cells. Blood 94, 3658–3667. - PubMed

Publication types