. 2021 Mar 9;17(3):e1008772.
doi: 10.1371/journal.pcbi.1008772. eCollection 2021 Mar.

Transcriptional bursts explain autosomal random monoallelic expression and affect allelic imbalance

Affiliations

Transcriptional bursts explain autosomal random monoallelic expression and affect allelic imbalance

Anton J M Larsson et al. PLoS Comput Biol. .

Abstract

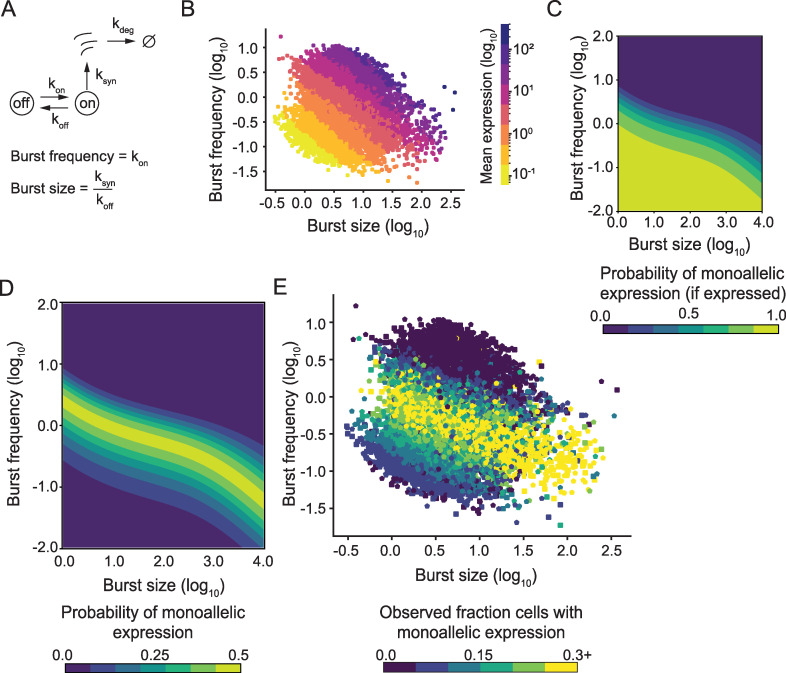
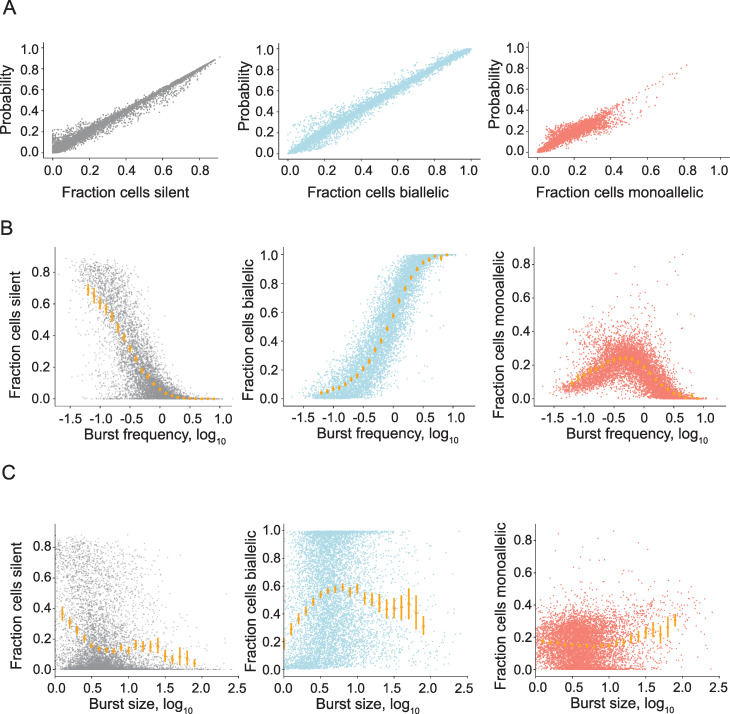
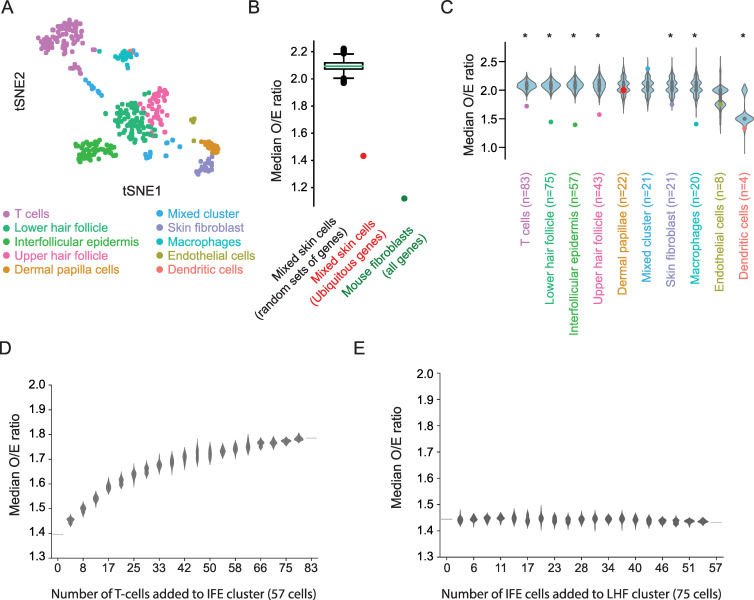
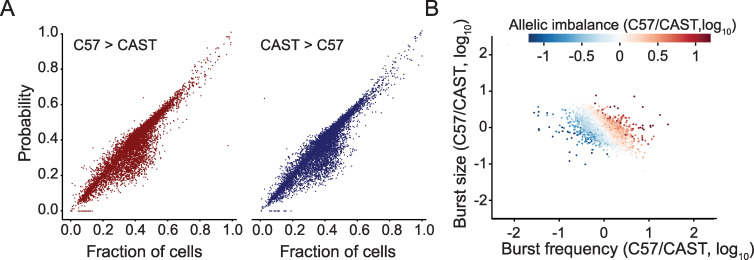
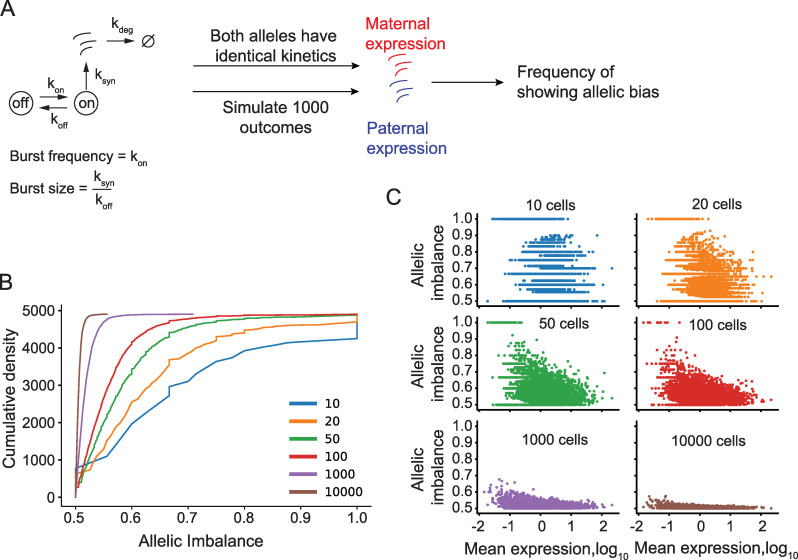
Transcriptional bursts render substantial biological noise in cellular transcriptomes. Here, we investigated the theoretical extent of allelic expression resulting from transcriptional bursting and how it compared to the amount biallelic, monoallelic and allele-biased expression observed in single-cell RNA-sequencing (scRNA-seq) data. We found that transcriptional bursting can explain the allelic expression patterns observed in single cells, including the frequent observations of autosomal monoallelic gene expression. Importantly, we identified that the burst frequency largely determined the fraction of cells with monoallelic expression, whereas the burst size had little effect on monoallelic observations. The high consistency between the bursting model predictions and scRNA-seq observations made it possible to assess the heterogeneity of a group of cells as their deviation in allelic observations from the expected. Finally, both burst frequency and size contributed to allelic imbalance observations and reinforced that studies of allelic imbalance can be confounded from the inherent noise in transcriptional bursting. Altogether, we demonstrate that allele-level transcriptional bursting renders widespread, although predictable, amounts of monoallelic and biallelic expression in single cells and cell populations.


Conflict of interest statement

The authors have declared that no competing interests exist.

Figures

Fig 1
Fig 1. The theoretical effect of transcriptional bursting on dynamic random monoallelic expression.
(A) Illustration of the model used for transcriptional burst kinetics. The time for the gene to transition are given by the exponentially distributed parameters kon (from off to on) and koff (from on to off). While the gene is active, the gene is transcribed at rate ksyn. The burst frequency is given by kon and the average number of transcripts produced in a burst (burst size) is given by ksyn /koff. (B) A scatter plot showing burst frequency and burst size estimates from the C57 allele of autosomal genes in mouse fibroblasts (CAST/EiJ × C57BL/6J, n = 7,606 genes), where each gene is colored based on the mean expression level of that gene (mean number of observed UMIs per cell). (C) Contour plot of the conditional probability of observing monoallelic expression when there is expression of that gene in the parameter space of burst frequency and size. (D) Contour plot of the probability of observing monoallelic expression in the parameter space of burst frequency and size, irrespectively if the gene is expressed or not. (E) A scatter plot showing burst frequency and burst size estimates from both alleles in mouse fibroblasts (C57 square, CAST pentagon, n = 7,606 autosomal genes), where each gene is colored based on the fraction of cells which expressed the gene monoallelically from that allele (n = 682 cells).
Fig 2
Fig 2. The relationship between transcriptional burst kinetics and dynamic random monoallelic expression in primary mouse fibroblasts.
(A) Correlations between the predicted and observed fraction of cells with: no expression (left), biallelic expression (middle) and monoallelic expression from the C57 allele (right), n = 7,606 genes. (B) The observed fraction of cells with silent (right), biallelic (middle), and monoallelic (C57, right) compared to burst frequency for 7,606 autosomal genes inferred in mouse fibroblasts. (C) The observed fraction of cells with silent (right), biallelic (middle), and monoallelic (C57, right) compared to burst size for 7,606 autosomal genes inferred in mouse fibroblasts.
Fig 3
Fig 3. Heterogeneity in cell clusters from an in vivo experiment in mouse skin measured by observed-to-expected biallelic expression.
(A) T-distributed stochastic neighbour embedding (tSNE) of the skin cells, colored by SNN-based clustering (n = 354 cells). (B) The median observed-to-expected (O/E) ratio of biallelic expression, comparing the theoretical predictions from burst kinetics to that observed in all cells without stratifying cells to clusters. Boxplot show median O/E biallelic expression from random sets of genes (n = 3,727 autosomal genes and 100,000 permutations) whereas the red dot show the O/E ratio when analyzing ubiquitously expressed genes in all cells. For comparison, the analyses of all genes in primary fibroblasts are shown in green. (C) The median O/E ratio of biallelic expression within cell clusters shown as colored dots. These were compared to randomly selected cells of the same size (n = 83, 75, 57, 43, 22, 21, 21, 20, 8, 4 cells respectively, 1,000 permutations for each cluster). Asterisk denotes significance at alpha = 0.05. (D) The median O/E ratio after adding n number of cells from the T-cell cluster to the Interfollicular epidermis (IFE) cluster. Bootstrapped 20 times. (E) The median O/E ratio after adding n number of cells from the Interfollicular epidermis (IFE) cluster to the Lower hair follicle (LHF) cluster. Bootstrapped 20 times.
Fig 4
Fig 4. Allelic bias is affected by relative changes in both burst frequency and size.
(A) Comparison between the probability of observing allelic imbalance between the alleles and the actual fraction of cells with the imbalance (n = 7,606 autosomal genes). (B) The relative allelic differences in burst kinetics for each gene, colored by their allelic bias (n = 7,606 genes).
Fig 5
Fig 5. Low-expressed genes frequently show false positive allelic imbalance due to transcriptional bursting.
(A) Outline of the simulation strategy. (B) The cumulative distribution of allelic bias of the simulated genes with the same kinetics (n = 4,905 autosomal genes), where allele with the highest allelic bias is the chosen value for each gene. (C) The relationship between the mean expression of a gene and allelic bias based on the number of simulated cells (n = 4,905 genes). Figure based on data from [6].

References

    1. Elowitz MB, Levine AJ, Siggia ED, Swain PS. Stochastic gene expression in a single cell. Science. 2002;297: 1183–1186. 10.1126/science.1070919 - DOI - PubMed
    1. Symmons O, Raj A. What’s Luck Got to Do with It: Single Cells, Multiple Fates, and Biological Nondeterminism. Mol Cell. 2016;62: 788–802. 10.1016/j.molcel.2016.05.023 - DOI - PMC - PubMed
    1. Chubb JR, Trcek T, Shenoy SM, Singer RH. Transcriptional pulsing of a developmental gene. Curr Biol. 2006;16: 1018–1025. 10.1016/j.cub.2006.03.092 - DOI - PMC - PubMed
    1. Raj A, Peskin CS, Tranchina D, Vargas DY, Tyagi S. Stochastic mRNA synthesis in mammalian cells. PLoS Biol. 2006;4: e309. 10.1371/journal.pbio.0040309 - DOI - PMC - PubMed
    1. Suter DM, Molina N, Gatfield D, Schneider K, Schibler U, Naef F. Mammalian genes are transcribed with widely different bursting kinetics. Science. 2011;332: 472–474. 10.1126/science.1198817 - DOI - PubMed

Publication types

LinkOut - more resources