. 2021 Mar 10;19(3):e3001093.
doi: 10.1371/journal.pbio.3001093. eCollection 2021 Mar.

Bacterial defenses against a natural antibiotic promote collateral resilience to clinical antibiotics

Affiliations

Bacterial defenses against a natural antibiotic promote collateral resilience to clinical antibiotics

Lucas A Meirelles et al. PLoS Biol. .

Abstract

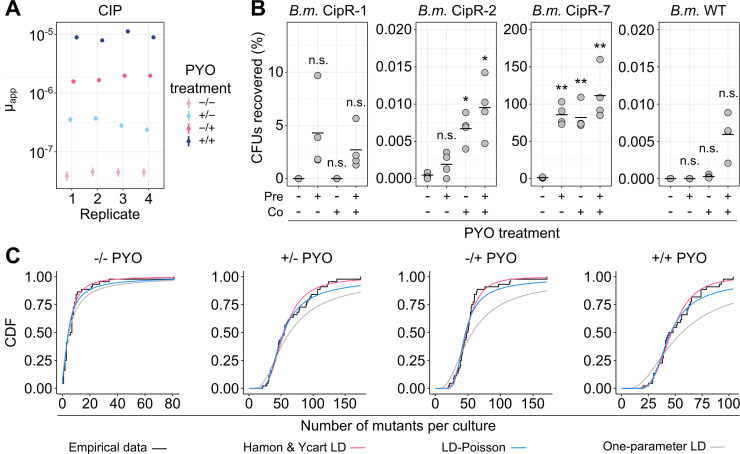
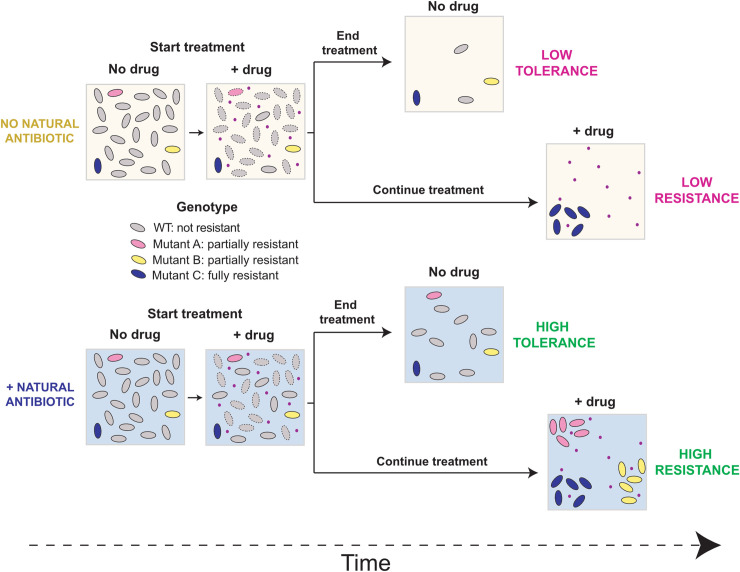
Bacterial opportunistic human pathogens frequently exhibit intrinsic antibiotic tolerance and resistance, resulting in infections that can be nearly impossible to eradicate. We asked whether this recalcitrance could be driven by these organisms' evolutionary history as environmental microbes that engage in chemical warfare. Using Pseudomonas aeruginosa as a model, we demonstrate that the self-produced antibiotic pyocyanin (PYO) activates defenses that confer collateral tolerance specifically to structurally similar synthetic clinical antibiotics. Non-PYO-producing opportunistic pathogens, such as members of the Burkholderia cepacia complex, likewise display elevated antibiotic tolerance when cocultured with PYO-producing strains. Furthermore, by widening the population bottleneck that occurs during antibiotic selection and promoting the establishment of a more diverse range of mutant lineages, PYO increases apparent rates of mutation to antibiotic resistance to a degree that can rival clinically relevant hypermutator strains. Together, these results reveal an overlooked mechanism by which opportunistic pathogens that produce natural toxins can dramatically modulate the efficacy of clinical antibiotics and the evolution of antibiotic resistance, both for themselves and other members of clinically relevant polymicrobial communities.


Conflict of interest statement

The authors have declared that no competing interests exist.

Figures

Fig 1
Fig 1. Mechanisms of tolerance to the self-produced natural antibiotic PYO in P. aeruginosa.
(A) Genome-wide Tn-seq experimental design. Cells were incubated with and without PYO under nutrient starvation for maximum PYO toxicity [16] (see Methods for details). Bar graphs shown are hypothetical representations of the expected results for genes with different fitness effects and are not derived from the obtained data. (B) Statistically significant fitness effects of transposon insertions in different representative genes under conditions that maximize PYO toxicity (for full dataset, see S1 Table). See Methods for details on calculation of fitness. Asterisks show genes for which chromosomal clean deletion mutants were constructed and validated. (C) Tn-seq validations. Chromosomal clean deletion mutants were exposed to PYO under carbon starvation, similar to the conditions used for the Tn-seq experiment. Survival of each strain was measured by CFUs and compared to the survival of the parent Δphz strain for fitness calculation (see Methods for details). Statistical significance was calculated using 1-way ANOVA with Tukey HSD multiple comparison test, with asterisks showing significant differences relative to Δphz (*** p < 0.001). Data points represent independent replicates, and black horizontal lines mark the mean fitness for each strain. (D) Tolerance to PYO toxicity in the presence and absence of the efflux inhibitor PAβN. Each data point represents an independent biological replicate (n = 4), and the horizontal black lines mark the mean survival for each condition and time point. (E) Fitness correlation analysis between PYO tolerance Tn-seq (this study) and CIP persistence Tn-seq [24]. Efflux repressors present in both datasets are highlighted in green. For full analysis, see S1 Table. The data underlying this figure can be found in Table A in S1 Data. ANOVA, analysis of variance; CFU, colony-forming unit; CIP, ciprofloxacin; HSD, honestly significant difference; PAβN, phenylalanine-arginine β-naphthylamide; PYO, pyocyanin; Tn-seq, transposon sequencing.
Fig 2
Fig 2. PYO induces expression of specific efflux systems, conferring cross-tolerance to fluoroquinolones.
(A) Structures of PYO, 2 representative fluoroquinolones (CIP and LVX) and 2 representative aminoglycosides (GEN and TOB). PYO and fluoroquinolones are pumped by MexEF-OprN and MexGHI-OpmD, while aminoglycosides are not [21,22]. Rings with an aromatic character are highlighted in red. (B) Normalized cDNA levels for genes within operons coding for the 11 main RND efflux systems in P. aeruginosa (left; n = 3) and PYO-dose-dependent changes in expression of mexEF-oprN and mexGHI-opmD systems (right; n = 3). For full qRT-PCR dataset, see S1–S3 Figs. (C) Effect of PYO on tolerance to CIP (1 μg/mL), LVX (1 μg/mL), and CST (16 μg/mL) in GMM (n = 4). (D) Effect of PYO on tolerance to CIP (1 μg/mL) and TOB (40 μg/mL) in SCFM (n = 4). PYO itself was not toxic under the experimental conditions [16] (S4C Fig). WT made 50–80 μM PYO as measured by absorbance of the culture supernatant at 691 nm. See S5A Fig for experimental design. (E) Effect on tolerance to CIP (1 μg/mL) in GMM caused by the presence of the 4 main phenazines produced by P. aeruginosa (PYO, PCA, PCN, and 1-OH-PHZ) (n = 4). For this experiment, a Δphz* strain that cannot produce or modify any phenazine was used (see Methods). (F, G) Effect of PYO on lag during outgrowth after exposure to CIP in GMM. A representative field of view over different time points (F; magenta = WT::mApple, green = Δphz::GFP; see S1 Movie) is shown together with the quantification of growth area on the agarose pads at time 0 hour and 15 hours (G). For these experiments, a culture of each strain tested was grown and exposed to CIP (10 μg/mL) separately, then cells of both cultures were washed, mixed, and placed together on a pad and imaged during outgrowth. The pads did not contain any PYO or CIP (see Methods and S5D Fig for details). White arrows in the displayed images point to regions with faster recovery of WT growth. The field of view displayed is marked with a black arrow in the quantification plot. The results for the experiment with swapped fluorescent proteins are shown in S4E Fig. See S4C Fig for complementary data about effects of PYO on lag. Scale bar: 20 μm. (H) Tolerance of Δphz to CIP (1 μg/mL) in GMM in the presence of different concentrations of PYO (n = 4). (G) Tolerance of Δphz to CIP (1 μg/mL) in GMM upon artificial induction of the mexGHI-opmD operon with arabinose (n = 4). The dashed green line marks the average survival of PYO-producing WT under similar conditions (without arabinose). Statistics: C, D, E, H—1-way ANOVA with Tukey HSD multiple comparison test, with asterisks showing significant differences relative to untreated Δphz (no PYO); G, I—Welch unpaired t test (* p < 0.05, ** p < 0.01, *** p < 0.001, n.s. p > 0.05). In all panels with quantitative data, black horizontal lines mark the mean value for each condition. Individual data points represent independent biological replicates, except for in panel G, where the data points represent different fields of view. The data underlying this figure can be found in Table B in S1 Data. 1-OH-PHZ, 1-hydroxyphenazine; ANOVA, analysis of variance; CIP, ciprofloxacin; CST, colistin; GEN, gentamicin; GMM, glucose minimal medium; HSD, honestly significant difference; LVX, levofloxacin; PCA, phenazine-1-carboxylic acid; PCN, phenazine-1-carboxamide; PYO, pyocyanin; qRT-PCR, quantitative reverse transcriptase PCR; RND, resistance-nodulation-division; SCFM, synthetic cystic fibrosis sputum medium; TOB, tobramycin; WT, wild-type.
Fig 3
Fig 3. PYO increases the apparent rate of mutation to antibiotic resistance in P. aeruginosa.
(A) Experimental design for fluctuation tests to determine the effect of PYO (100 μM unless otherwise noted) on apparent mutation rates. For panels B–E, mutation rates were calculated using an established maximum likelihood-based method that accounts for the effects of plating a small proportion of the total culture volume (see Methods for details). Each data point in those panels represents a single biological replicate comprising 44 parallel cultures, and the vertical lines represent the 84% confidence intervals. Lack of overlap in these confidence intervals corresponds to statistical significance at the p < 0.05 threshold [99]. For statistical significance as determined by a likelihood ratio test, see S2 Table. In B, D, and E, the PYO treatments correspond to the following: −/− denotes no PYO pretreatment (in the liquid culture stage) or co-treatment (in the antibiotic agar plates), +/− denotes PYO pretreatment but no co-treatment, −/+ denotes PYO co-treatment without pretreatment, and +/+ denotes both PYO pretreatment and co-treatment. (B) Apparent mutation rates of log-phase Δphz grown in GMM and plated on MH agar containing CIP (0.5 μg/mL; n = 4) or LVX (1 μg/mL; n = 5), with or without pre- and/or co-exposure to PYO relative to the antibiotic selection step. (C) The apparent rate of mutation to resistance for Δphz cells that were pretreated with different concentrations of PYO in GMM and plated onto MH agar containing CIP (0.5 μg/mL). (D) Apparent mutation rates of log-phase Δphz grown in SCFM and plated on SCFM agar containing CIP (1 μg/mL; n = 4) with or without pre- and/or co-exposure to PYO. (E) Apparent mutation rates of log-phase Δphz grown in GMM and plated during onto MH agar containing GEN (16 μg/mL; n = 4) or TOB (4 μg/mL; n = 4), with or without pre- and/or co-exposure to PYO. The data underlying this figure can be found in Table C in S1 Data. CIP, ciprofloxacin; GEN, gentamicin; GMM, glucose minimal medium; LVX, levofloxacin; MH, Mueller–Hinton; PYO, pyocyanin; SCFM, synthetic cystic fibrosis sputum medium; TOB, tobramycin.
Fig 4
Fig 4. PYO promotes the growth of partially resistant mutants and the occurrence of post-plating mutations.
(A) Putative CIP-resistant mutants of P.a. isolated from fluctuation test plates were grown to mid-log phase in liquid GMM with or without 100 μM PYO, before plating for CFUs on nonselective MH agar plates, plates containing CIP alone (0.5 μg/mL), and plates containing CIP and PYO. Plotted values represent the percentage of CFUs recovered on the CIP plates, calculated relative to total CFUs counted on nonselective plates. On the x-axis, “pre” denotes the presence of PYO in the liquid cultures, and “co” denotes the presence of PYO in the agar plates. Data points represent independent biological cultures (n = 4). Black horizontal lines mark the mean values for each condition. (B) Goodness of fit of different mathematical models for P. aeruginosa Δphz fluctuation test data. Data from the fluctuation tests performed on CIP are plotted for different combinations of PYO in liquid (pretreatment) and PYO in agar (co-exposure to antibiotic selection). The empirical CDFs of the data (black) are plotted against (1) a variation of the LD model fit with 2 parameters, m (the expected number of mutations per culture) and w (the relative fitness of mutant cells vs. WT), as implemented by Hamon and Ycart [44] (pink); (2) a mixed LD and Poisson distribution fit with 2 parameters, m and d (the number of generations that occur post-plating), allowing for the possibility of post-plating mutations, as implemented by Lang and Murray [45] (blue); and (3) the basic LD distribution model fit only with m, as implemented by Lang and Murray [45] (gray). In each condition, the plotted experimental data represent the biological replicate with the lowest chi-squared goodness of fit p-value (i.e., least good fit) for the Hamon and Ycart model, demonstrating that this model was still a reasonable fit for these samples. Statistics: A—Welch unpaired t tests with Benjamini–Hochberg correction for controlling false discovery rate (* p < 0.05, ** p < 0.01, *** p < 0.001, n.s. p > 0.05). The data underlying this figure can be found in Table D in S1 Data. CDF, cumulative distribution function; CFU, colony-forming unit; CIP, ciprofloxacin; GMM, glucose minimal medium; LD, Luria–Delbrück; P.a., P. aeruginosa; PYO, pyocyanin; WT, wild-type.
Fig 5
Fig 5. PYO promotes antibiotic tolerance in other opportunistic pathogens.
(A) Growth in GMM + AA of several strains in the presence of different concentrations of PYO. Plotted lines represent averages of 4–6 replicates, and shaded areas in gray represent the standard deviation. Burkholderia multivorans 1 = B. multivorans AU42096. For complete information on strains, see S5 Table. (B) Tolerance of S. maltophilia to different concentrations of CIP (1 or 10 μg/mL) after growth in the presence of different concentrations of PYO (0, 10, or 50 μM) in GMM + AA (n = 4). (C) Schematic depicting the experimental design for coculture antibiotic tolerance assays (see Methods for details). (D) CFUs recovered from cocultures of P. aeruginosa (PA14 WT and Δphz) and S. maltophilia (n = 3), showing that the latter struggled to grow in the presence of P. aeruginosa in GMM + AA. (E) Effect of PYO on the tolerance to CIP (10 μg/mL) in GMM + AA of multiple Burkholderia species isolated from environmental and clinical samples (n = 4). (F) Effect of PYO produced by P. aeruginosa in cocultures on the tolerance of different Burkholderia species to CIP (10 μg/mL) in GMM + AA. PA14 is our model laboratory strain of P. aeruginosa, while PA 76–11 is a PYO-producing strain of P. aeruginosa isolated from a CF patient. The Burkholderia strains were plated separately for CFUs to assess survival following treatment with CIP in the cocultures (n = 3). (G) Tolerance of P. aeruginosa PA14 WT and Δphz to CIP (1 μg/mL) when grown in cocultures with B. multivorans 1 in GMM + AA (n = 3). (H) Effect of PYO on the tolerance to CIP (10 μg/mL) of B. multivorans 1 in SCFM (n = 4). (I) Tolerance to CIP (1 μg/mL) in SCFM of B. multivorans 1 grown in cocultures with P. aeruginosa PA14 WT, Δphz, or alone with 100 μM PYO added exogenously (n = 3). Statistics: B, E, F, G, H, I—1-way ANOVA with Tukey HSD multiple comparison test for comparisons of 3 conditions or Welch unpaired t test for comparison of 2 conditions, with asterisks showing the statistical significance of comparisons with the untreated (no PYO or Δphz) condition (* p < 0.05, ** p < 0.01, *** p < 0.001). In all panels, data points represent independent biological replicates, and black horizontal bars mark the mean values for each condition. The data underlying this figure can be found in Table E in S1 Data. AA, amino acids; ANOVA, analysis of variance; CF, cystic fibrosis; CFU, colony-forming unit; CIP, ciprofloxacin; GMM, glucose minimal medium; HSD, honestly significant difference; PYO, pyocyanin; SCFM, synthetic cystic fibrosis sputum medium; WT, wild-type.
Fig 6
Fig 6. PYO promotes antibiotic resistance in B. multivorans.
(A) The apparent rate of mutation to resistance when log-phase B. multivorans 1 cells grown in GMM + AA were plated on MH agar containing CIP (8 μg/mL), with or without pre- and/or co-exposure to 100 μM PYO relative to the antibiotic selection step. Each data point represents a biological replicate comprising 44 parallel cultures (n = 4). The vertical lines represent 84% confidence intervals, in which lack of overlap corresponds to statistical significance at the p < 0.05 level [99]. The PYO treatments correspond to the following: −/− denotes no PYO pretreatment (in the liquid culture stage) or co-treatment (in the antibiotic agar plates), +/− denotes PYO pretreatment but no co-treatment, −/+ denotes PYO co-treatment without pretreatment, and +/+ denotes both PYO pretreatment and co-treatment. (B) The percentage of CFUs recovered on CIP plates either with or without PYO in the agar, for exponential phase cultures of different partially resistant B. multivorans 1 (B.m.) mutants that were pre-grown with or without PYO in liquid cultures in GMM + AA. Plotted values represent the percentage of CFUs recovered on the CIP plates, calculated relative to total CFUs counted on nonselective plates. On the x-axis, “pre” denotes the presence of PYO in the liquid cultures, and “co” denotes the presence of PYO in the agar plates. Data points represent independent biological replicates (n = 4), and black horizontal bars mark the mean values for each condition. (C) Goodness of fit of different mathematical models for B. multivorans 1 fluctuation test data. Data are plotted for different combinations of PYO in liquid (pretreatment) and PYO in agar (co-exposure to antibiotic selection). The empirical CDFs of the data (black) are plotted against (1) a variation of the LD model fit with 2 parameters, m (the expected number of mutations per culture) and w (the relative fitness of mutant cells vs. WT), as implemented by Hamon and Ycart [44] (pink); (2) a mixed LD and Poisson distribution fit with 2 parameters, m and d (the number of generations that occur post-plating), allowing for the possibility of post-plating mutations, as implemented by Lang and Murray [45] (blue); and (3) the basic LD distribution model fit only with m, as implemented by Lang and Murray [45] (gray). In each condition, the plotted experimental data represent the biological replicate with the lowest chi-squared goodness of fit p-value (i.e., least good fit) for the Hamon and Ycart model. Statistics: B—Welch unpaired t tests with Benjamini–Hochberg correction for controlling false discovery rate (* p < 0.05, ** p < 0.01, *** p < 0.001). The data underlying this figure can be found in Table F in S1 Data. AA, amino acids; CDF, cumulative distribution function; CFU, colony-forming unit; CIP, ciprofloxacin; GMM, glucose minimal medium; LD, Luria–Delbrück; MH, Mueller–Hinton; PYO, pyocyanin; WT, wild-type.
Fig 7
Fig 7. Proposed model for how natural antibiotics increase bacterial tolerance and resistance to clinical drugs.
In the first scenario (tolerance), cells are exposed to the clinical drug (pink dots) for a short period of time. Surviving cells will eventually restart growth after the drug is removed. The presence of the natural antibiotic (bottom) increases tolerance of both WT and partially resistant mutants. In the second scenario (resistance), cells are constantly exposed to the drug for an extended period of time, and only mutants are maintained in the population. The presence of the natural antibiotic (bottom) widens the population bottleneck and allows partially resistant mutants to grow under drug selection, preserving a greater range of genetic diversity in the population. WT, wild-type.

References

    1. Fair RJ, Tor Y. Antibiotics and bacterial resistance in the 21st century. Perspect Medicin Chem. 2014;6:25–64. 10.4137/PMC.S14459 - DOI - PMC - PubMed
    1. Brauner A, Fridman O, Gefen O, Balaban NQ. Distinguishing between resistance, tolerance and persistence to antibiotic treatment. Nat Rev Microbiol. 2016;14:320–330. 10.1038/nrmicro.2016.34 - DOI - PubMed
    1. Levin-Reisman I, Ronin I, Gefen O, Braniss I, Shoresh N, Balaban NQ. Antibiotic tolerance facilitates the evolution of resistance. Science. 2017;355:826–830. 10.1126/science.aaj2191 - DOI - PubMed
    1. Windels EM, Michiels JE, Fauvart M, Wenseleers T, Van den Bergh B, Michiels J. Bacterial persistence promotes the evolution of antibiotic resistance by increasing survival and mutation rates. ISME J. 2019;13:1239–1251. 10.1038/s41396-019-0344-9 - DOI - PMC - PubMed
    1. Martinez JL. The role of natural environments in the evolution of resistance traits in pathogenic bacteria. Proc Biol Sci. 2009;276:2521–2530. 10.1098/rspb.2009.0320 - DOI - PMC - PubMed

Publication types

MeSH terms