. 2021 Mar 10;17(3):e1009387.
doi: 10.1371/journal.ppat.1009387. eCollection 2021 Mar.

SOCS-1 inhibition of type I interferon restrains Staphylococcus aureus skin host defense

Affiliations

SOCS-1 inhibition of type I interferon restrains Staphylococcus aureus skin host defense

Nathan Klopfenstein et al. PLoS Pathog. .

Abstract

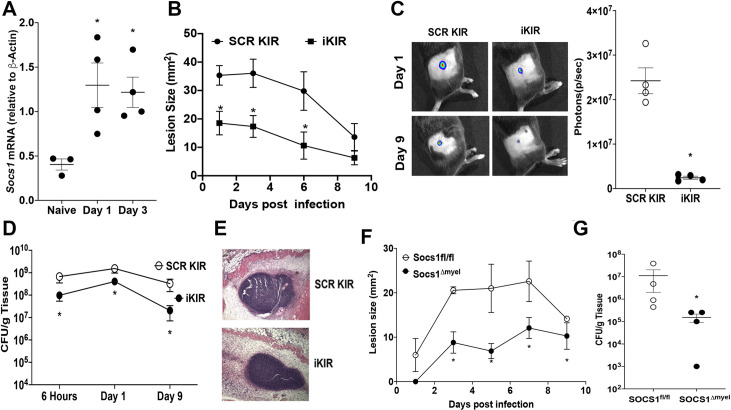
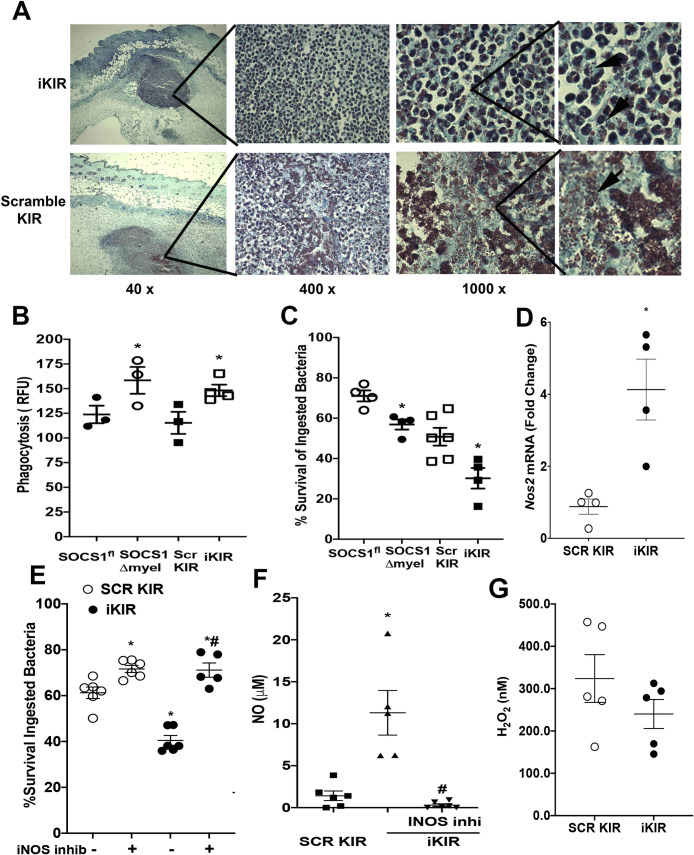
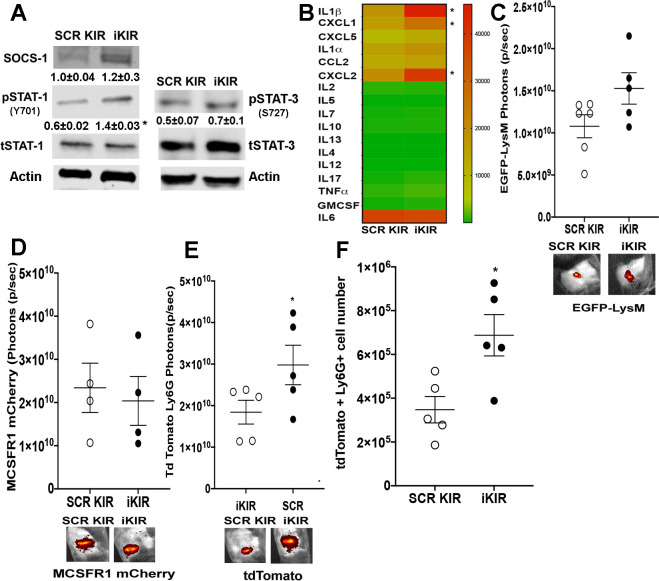
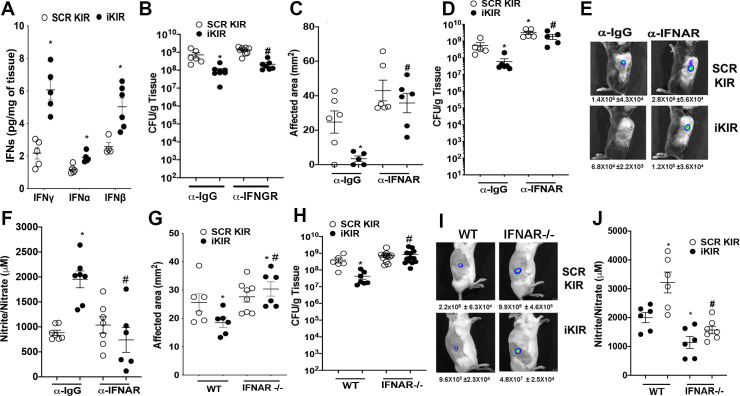
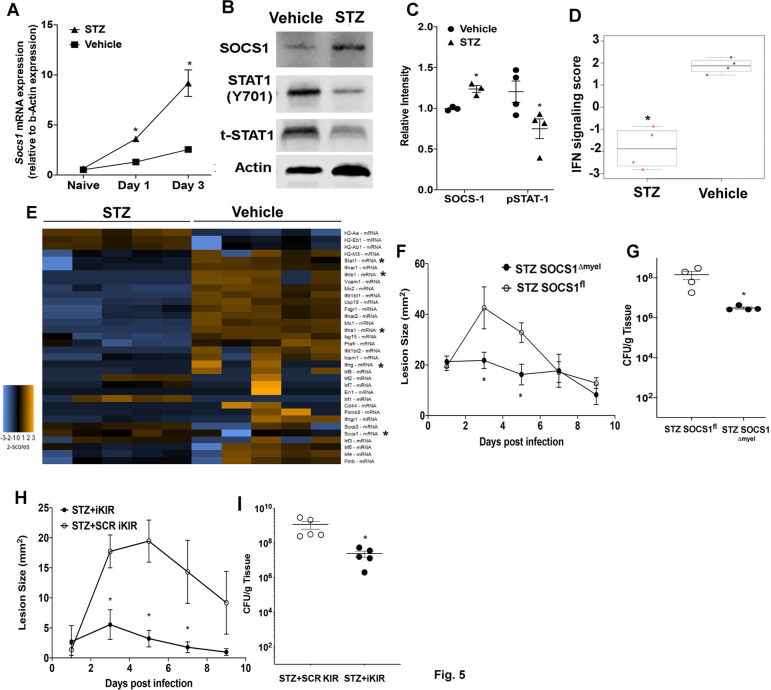
The skin innate immune response to methicillin-resistant Staphylococcus aureus (MRSA) culminates in the formation of an abscess to prevent bacterial spread and tissue damage. Pathogen recognition receptors (PRRs) dictate the balance between microbial control and injury. Therefore, intracellular brakes are of fundamental importance to tune the appropriate host defense while inducing resolution. The intracellular inhibitor suppressor of cytokine signaling 1 (SOCS-1), a known JAK/STAT inhibitor, prevents the expression and actions of PRR adaptors and downstream effectors. Whether SOCS-1 is a molecular component of skin host defense remains to be determined. We hypothesized that SOCS-1 decreases type I interferon production and IFNAR-mediated antimicrobial effector functions, limiting the inflammatory response during skin infection. Our data show that MRSA skin infection enhances SOCS-1 expression, and both SOCS-1 inhibitor peptide-treated and myeloid-specific SOCS-1 deficient mice display decreased lesion size, bacterial loads, and increased abscess thickness when compared to wild-type mice treated with the scrambled peptide control. SOCS-1 deletion/inhibition increases phagocytosis and bacterial killing, dependent on nitric oxide release. SOCS-1 inhibition also increases the levels of type I and type II interferon levels in vivo. IFNAR deletion and antibody blockage abolished the beneficial effects of SOCS-1 inhibition in vivo. Notably, we unveiled that hyperglycemia triggers aberrant SOCS-1 expression that correlates with decreased overall IFN signatures in the infected skin. SOCS-1 inhibition restores skin host defense in the highly susceptible hyperglycemic mice. Overall, these data demonstrate a role for SOCS-1-mediated type I interferon actions in host defense and inflammation during MRSA skin infection.


Conflict of interest statement

The authors have declared that no competing interests exist.

Figures

Fig 1
Fig 1. Inhibition of SOCS-1 actions improves subcutaneous skin infection outcome.
A) mRNA expression of Socs1 in the skin of mice infected subcutaneously with MRSA at day 1 and day 3 post-infection as determined by qPCR. B) Bioluminescent infection area in mice treated with SCR or SOCS-1 iKIR peptide using the in vivo animal imaging (IVIS Spectrum) detection system. C) Right–Total flux (photons/sec) of bioluminescent MRSA detected in mice treated as in B using IVIS Spectrum. Left–Representative images of bioluminescent MRSA in the skin of mice treated as in B using planar bioluminescent imaging. D) Bacterial load determined by CFU measured in the skin biopsy homogenates from mice treated as in B determined at the indicated time points after infection. E) Representative H&E stains from mice treated as in B and shown at 10X magnification F) Infection area measured every other day for 9 days post-infection in SOCS1fl and SOCS1Δmyel mice. G) Bacterial load determined by CFU measured in the skin biopsy homogenates in SOCS1fl and SOCS1Δmyel mice at day 9 post-infection. Data represent the mean ± SEM from 3–9 mice from 2–3 independent experiments. *p < 0.05 vs. SCR KIR.
Fig 2
Fig 2. SOCS-1 inhibition enhances antimicrobial effector functions in BMDMs.
A) Gram staining of skin biopsies collected at day 1 post-MRSA skin infection from iKIR and scrambled KIR treated mice. Gram staining to label gram-positive bacteria is shown in purple/brown. Magnifications are as shown. Black arrows indicate extracellular MRSA clusters. Images are representative of 3–5 mice per group. B) Phagocytosis of GFP tagged MRSA by BMDM’s from SOCS1fl and SOCS1Δmyel mice or BMDM’s from WT mice treated with the SCR KIR or iKIR peptide. C) Determination of Bacterial killing of GFP tagged MRSA by BMDMs from B as described in Phagocytosis and Killing assays—Methods. D) mRNA expression of Nos2 in the skin of infected mice treated with either SCR KIR or iKIR peptide at day 1 post-infection as determined via qPCR. E) Determination of bacterial killing of GFP-tagged MRSA as in C with BMDMs from WT mice treated with either SCR KIR, iKIR, or iKIR+ an iNOS inhibitor (1400W dihydrochloride). F) Measurement of nitric oxide in the supernatant of BMDMs from E. G) H2O2 levels in the skin of mice treated with either SCR KIR or iKIR at day 1 post infection as determined by Amplex Red assay. Data represent the mean ± SEM from 3–6 mice from 2–3 independent experiments. *p < 0.05 vs. SOCS1fl or SCR KIR treated mice. #p < .05 vs. iKIR treated mice.
Fig 3
Fig 3. SOCS-1 inhibition increases pro-inflammatory cytokines and immune cell recruitment during skin infection.
A) Representative Western blots for SOCS-1, pSTAT-1 (Y701), tSTAT-1, pSTAT-3 (S727), tSTAT-3, and Actin from biopsies collected at day 3 post-infection in SCR KIR and iKIR treated animals. The numbers represent mean densitometry analysis of the bands ± SEM (n = four to five mice/group). B) Heat-map of proteins involved in the inflammatory immune response and its resolution in mice treated with either iKIR or SCR KIR at day 1 post-infection as measured using bead array multiplex (Eve Technologies). Proteins are listed on the left-hand y-axis, grouped alphabetically in clades. Red indicates higher abundance, whereas green represents lower abundance. Each column for each condition represents a technical replicate (n = 4-5/group). C) Total flux (photons/sec) of EGFP detected in EGFP-LysM mice at day 3 post infection treated with either SCR or iKIR. Representative pictures are shown below. D) Total flux of mCherry signal detected in MMDTR mice at day 3 post infection treated with either SCR or iKIR, representative pictures are shown below. E) Total flux of tdTomato signal detected in CatchupIVM-red mice at day 3 post infection treated with either SCR or iKIR with representative picture shown below. F) Total number of tdTomato+ cells in biopsies collected from mice in E. Data represent the mean ± SEM from 3–5 mice from 2–3 independent experiments. *p < 0.05 vs. SCR KIR treated mice.
Fig 4
Fig 4. Inhibition of type I interferon signaling removes the benefit of SOCS-1 inhibition.
A) Interferon levels in the skin at day 1 post-infection in SCR KIR and iKIR treated animals as measured via ELISA. B) Bacterial load as determined via CFU in skin biopsy homogenates of SCR KIR and iKIR treated mice treated with either IFNGR antibody or IgG control. C) Bioluminescent infection area in the skin of SCR KIR and iKIR treated animals treated with or without an IFNAR blocking antibody at day 1 post-infection. D) Bacterial load determined by CFU measured in the skin biopsy homogenates from mice treated as in C at day 1 post-infection. E) Representative images of bioluminescent MRSA in the skin of mice treated as in C using planar bioluminescent imaging with average flux (photons/sec) below F) Nitrite/Nitrate as measured via Griess assay from biopsies collected from mice treated as in C at day 1 post-infection. G) Surface lesion size as measured via caliper at day 3 post-infection in BALB/c or BALB/c IFNAR -/- mice treated with either iKIR or SCR KIR. H) Bacterial load determined by CFU measured in the skin biopsy homogenates from mice treated as in G at day 3 post-infection. I) Representative images of bioluminescent MRSA in the skin of mice treated as in G using planar bioluminescent imaging with average flux (photons/sec) below. J) Nitrite/Nitrate as measured via Griess assay from biopsies collected from mice treated as in I at day 3 post-infection. Data represent the mean ± SEM from 3–9 mice from 2–3 independent experiments. *p < 0.05 vs. SCR KIR+αIGG or SCR treated WT mice. #p<0.05 vs. iKIR+ αIGG or iKIR treated WT mice.
Fig 5
Fig 5. SOCS-1 impairs skin host defense in hyperglycemic mice.
A) Expression of Socs1 mRNA at day 1 and day 3 post-infection in biopsies collected from STZ induced hyperglycemic and control mice B) Representative Western blot for SOCS-1, pSTAT-1, and tSTAT-1 from biopsies collected at day 3 post-infection in STZ-induced hyperglycemic and control mice C) Densitometry quantification of separate Western Blots as shown in B. D) IFN signaling score determined using NanoSolver in mRNA isolated from infected skin of iKIR and scrambled KIR-treated mice. E) Heatmap of genes analyzed via NanoString from mRNA collected in D. F) Surface lesions size in STZ induced hyperglycemic and euglycemic SOCS1fl and SOCS1Δmyel mice over a 9 day subcutaneous MRSA infection. G) Bacterial load determined by CFU measured in the skin biopsy homogenates from mice treated as in F at day 9 post-infection. H) Surface lesions size in STZ induced hyperglycemic and euglycemic mice treated with either SCR KIR or iKIR over the course of a 9 day subcutaneous MRSA infection. I) Bacterial load determined by CFU measured in the skin biopsy homogenates from mice treated as in H at day 9 post-infection. Data represent the mean ± SEM from 3–6 mice from 2–3 independent experiments. *p < 0.05 vs. Vehicle controls, SOCS1fl or SCR KIR treated mice.

References

    1. Edelsberg J, Taneja C, Zervos M, Haque N, Moore C, Reyes K, et al.. Trends in US hospital admissions for skin and soft tissue infections. Emerg Infect Dis [Internet]. 2009. September [cited 2020 Apr 23];15(9):1516–8. Available from: http://www.ncbi.nlm.nih.gov/pubmed/19788830 10.3201/eid1509.081228 - DOI - PMC - PubMed
    1. Watkins RR, Holubar M, David MZ. Antimicrobial Resistance in Methicillin-Resistant Staphylococcus aureus to Newer Antimicrobial Agents. Antimicrob Agents Chemother [Internet]. 2019. September 16 [cited 2020 Apr 23];63(12). Available from: http://www.ncbi.nlm.nih.gov/pubmed/31527033 10.1128/AAC.01216-19 - DOI - PMC - PubMed
    1. Cho JS, Guo Y, Ramos RI, Hebroni F, Plaisier SB. Neutrophil-derived IL-1b Is Sufficient for Abscess Formation in Immunity against Staphylococcus aureus in Mice. PLoS Pathog [Internet]. 2012. [cited 2020 Apr 14];8(11):1003047. Available from: www.plospathogens.org - PMC - PubMed
    1. Cheng AG, DeDent AC, Schneewind O, Missiakas D. A play in four acts: Staphylococcus aureus abscess formation [Internet]. Vol. 19, Trends in Microbiology. 2011. [cited 2020 Apr 30]. p. 225–32. Available from: http://www.ncbi.nlm.nih.gov/pubmed/21353779 10.1016/j.tim.2011.01.007 - DOI - PMC - PubMed
    1. Brandt SL, Putnam NE, Cassat JE, Serezani CH. Innate Immunity to Staphylococcus aureus: Evolving Paradigms in Soft Tissue and Invasive Infections. J Immunol. 2018. June 15;200(12):3871–80. 10.4049/jimmunol.1701574 - DOI - PMC - PubMed

Publication types

MeSH terms

Substances