. 2021 Mar 9;34(10):108825.
doi: 10.1016/j.celrep.2021.108825.

Regulation of translation by methylation multiplicity of 18S rRNA

Affiliations

Regulation of translation by methylation multiplicity of 18S rRNA

Kuanqing Liu et al. Cell Rep. .

Abstract

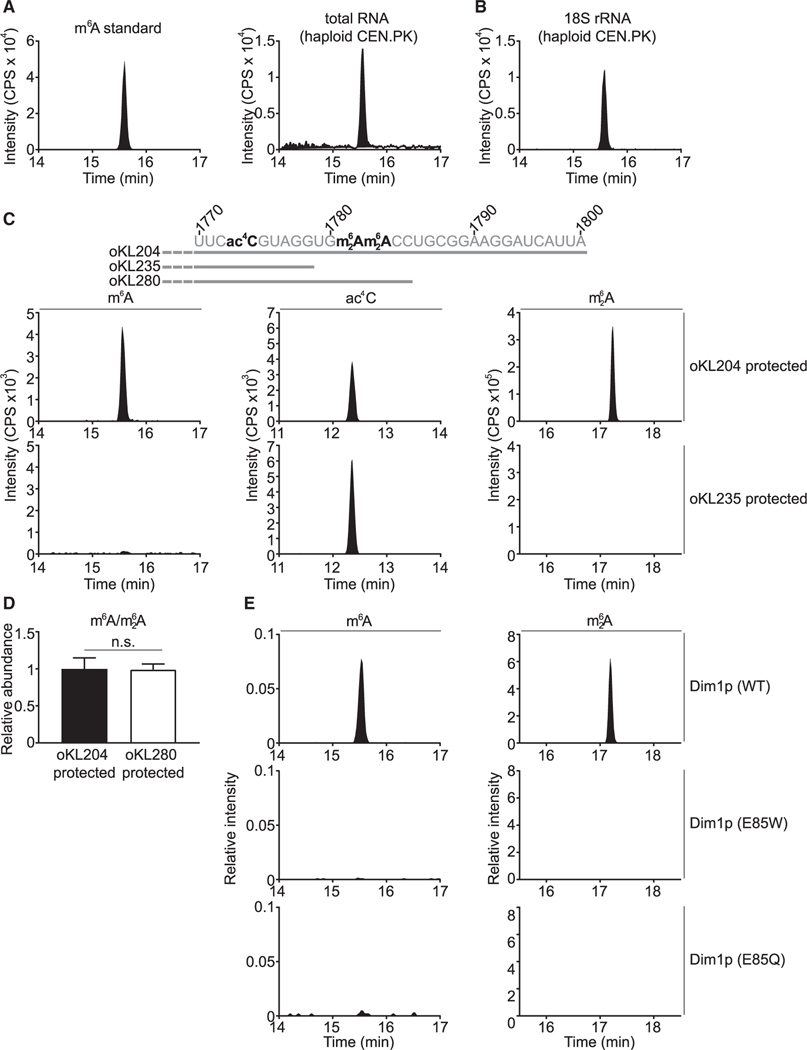
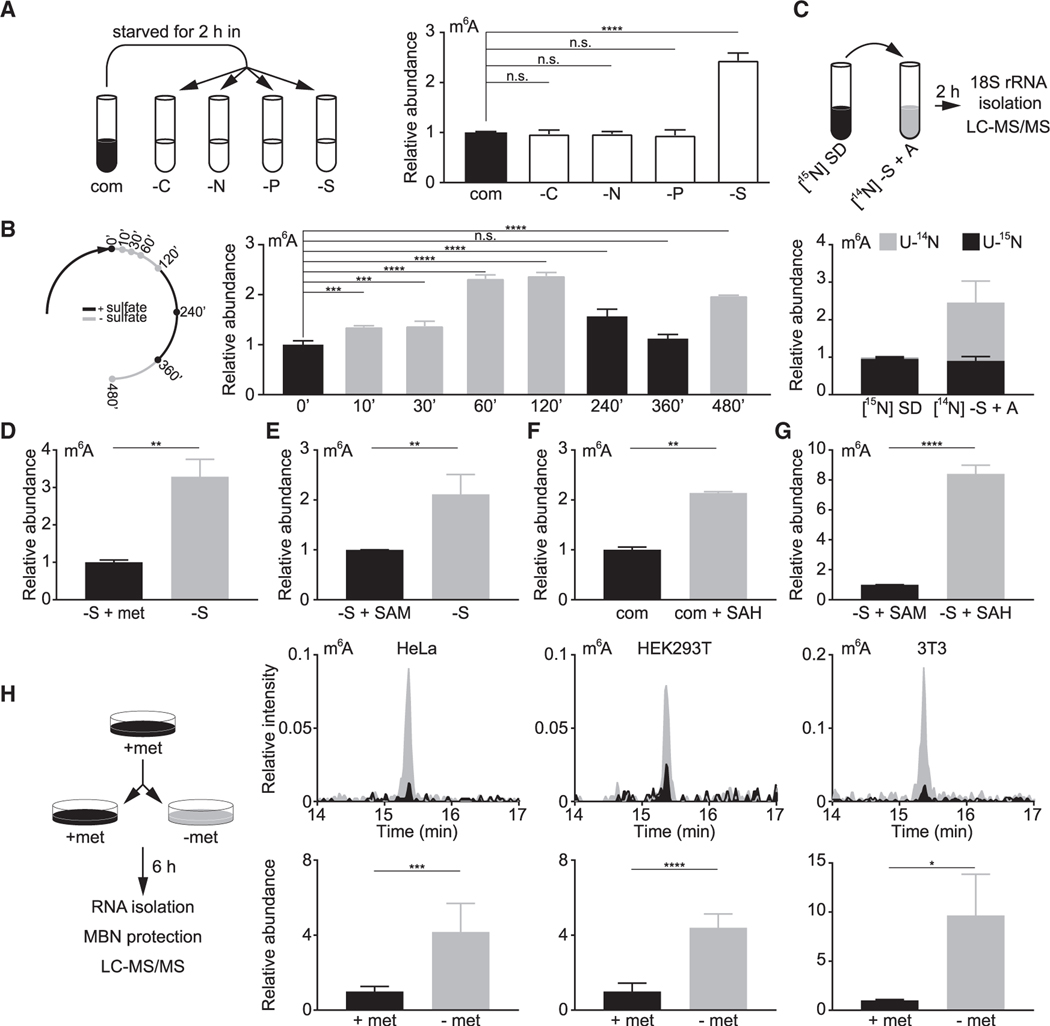
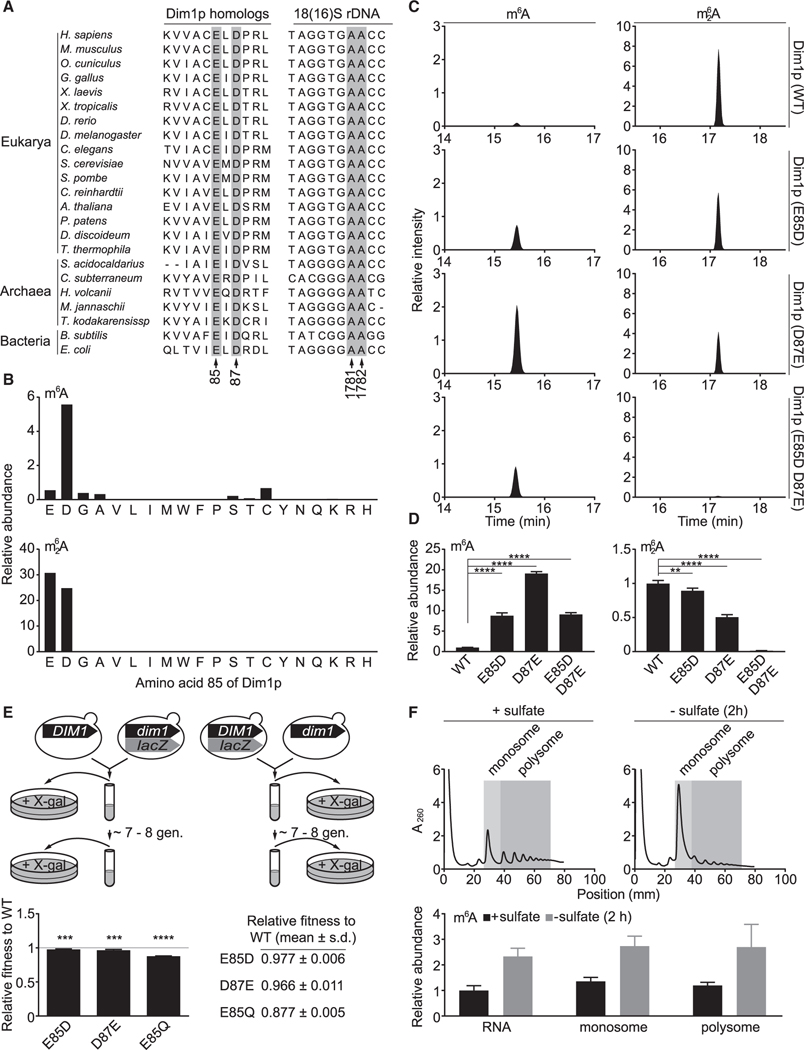
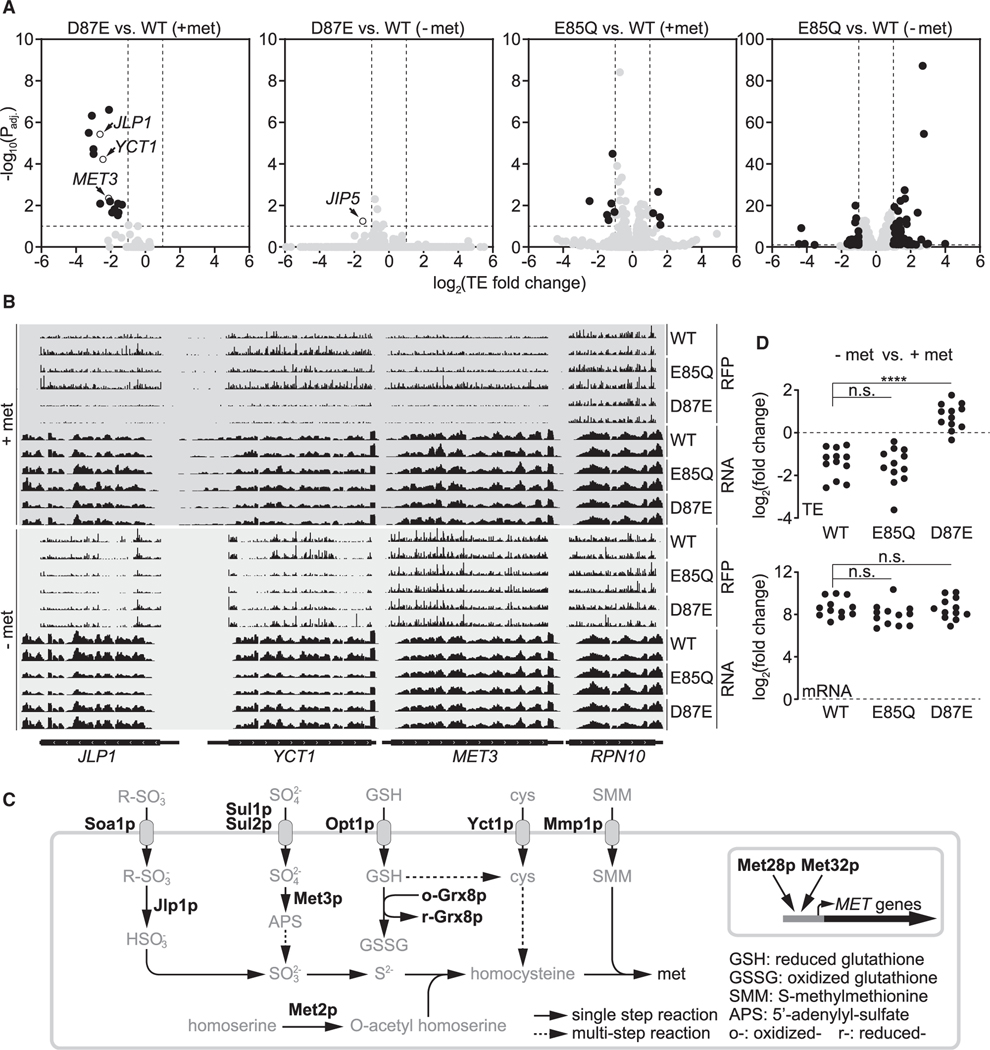
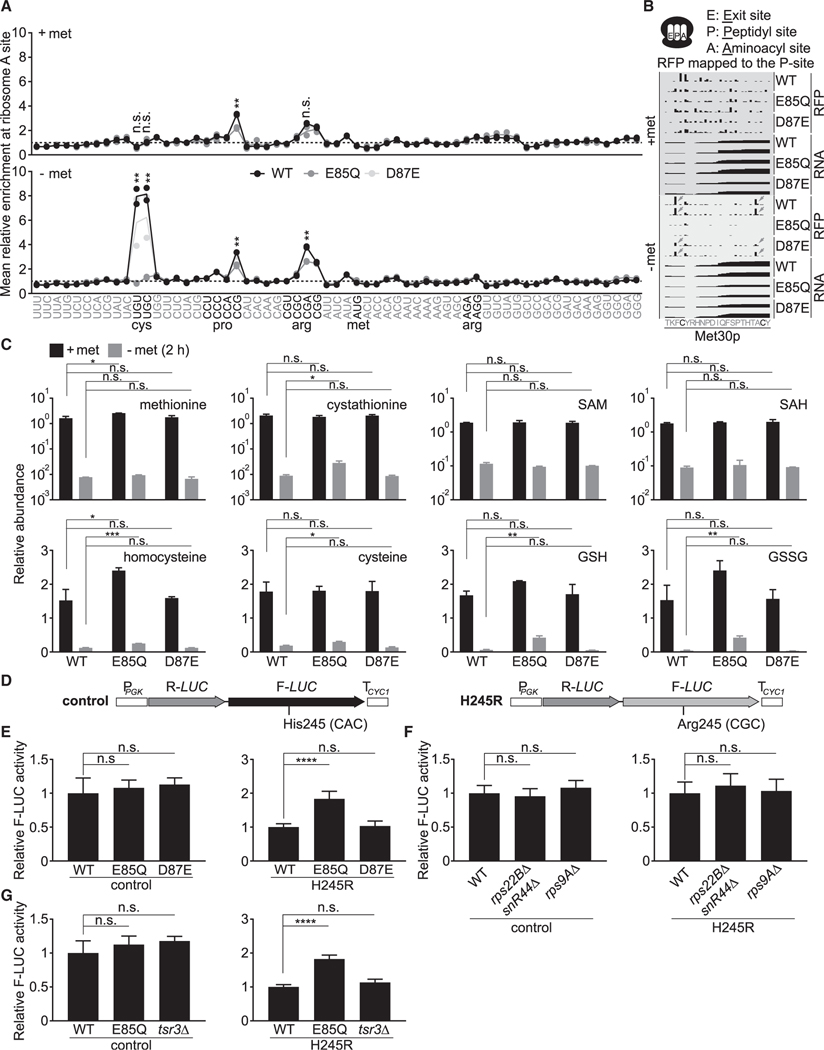
N6-methyladenosine (m6A) is a conserved ribonucleoside modification that regulates many facets of RNA metabolism. Using quantitative mass spectrometry, we find that the universally conserved tandem adenosines at the 3' end of 18S rRNA, thought to be constitutively di-methylated (m62A), are also mono-methylated (m6A). Although present at substoichiometric amounts, m6A at these positions increases significantly in response to sulfur starvation in yeast cells and mammalian cell lines. Combining yeast genetics and ribosome profiling, we provide evidence to suggest that m6A-bearing ribosomes carry out translation distinctly from m62A-bearing ribosomes, featuring a striking specificity for sulfur metabolism genes. Our work thus reveals methylation multiplicity as a mechanism to regulate translation.


Conflict of interest statement

Declaration of interests The authors declare no competing interests.

Figures

Figure 1.
Figure 1.. m6A is a bona fide modification located at A1781 and/or A1782 of 18S rRNA
(A) Detection of m6A in total RNA from vegetatively growing haploid S. cerevisiae. (B) m6A is detected in 18S rRNA of vegetatively growing haploid S. cerevisiae (strain: CEN.PK). (C) m6A is located in the last 22 nucleotides of 18S rRNA. ac4C, N4-acetylcytidine; m62A, N6, N6-dimethyladenosine. See Data S1 for other regions of 18S rRNA surveyed using the MBN protection assay. (D) m6A is located at A1781 and/or A1782 of 18S rRNA. The peak area of m6A was first normalized to that of m62A, and the m6A/m62A ratio was then normalized to the fragment protected by oKL204. Mean ± SD (n = 7 biological replicates). The p value was calculated using unpaired two-tailed Student’s t test, assuming equal variances. (E) m62A methyltransferase Dim1p is responsible for the m6A modification in yeast 18S rRNA. p > 0.05 (n.s.). CPS, counts per second. See also Figures S1 and S2 and Data S1.
Figure 2.
Figure 2.. Sulfur starvation increases m6A levels in 18S rRNA in yeast cells and mammalian cell lines
(A) m6A levels in 18S rRNA increase specifically under sulfate starvation. com, complete medium; −C, carbon starvation; −N, nitrogen starvation; −P, phosphate starvation; −S, sulfate starvation. Mean ± SD (n = 3 biological replicates). (B) Changes in m6A levels in response to sulfate availability. Mean ± SD (n = 2–3 biological replicates). (C) Increased m6A under sulfate starvation is synthesized de novo. Cells were fully labeled in [15N] SD and starved in [14N] sulfur-free medium + 50 mg L−1 adenine ([14N] S + A) for 2 h. Peak areas of [U-14N] and [U-15N] ac4C were combined to normalize the differentially labeled m6A. Normalized abundance was further divided by that of preswitch samples. Mean ± SD (n = 3 biological replicates). (D and E) Starvation of methionine (D) and SAM (E) increases m6A levels in 18S rRNA. Mean ± SD (n = 3 biological replicates). Methionine (D) and SAM (E) were supplemented at 1 and 0.5 mM, respectively. Data for −S + SAM in (E) were also used in (G). (F) SAH increases m6A levels in 18S rRNA. Mean ± SD (n = 2 biological replicates). (G) SAH enhances the impact of SAM starvation on increasing m6A levels in 18S rRNA. SAM and SAH were used at 0.5 mM. Mean ± SD (n = 3 biological replicates). (H) Methionine starvation increases m6A levels at the 3′ end of mammalian 18S rRNA. MBN protection assay was performed to specifically examine m6A in the last 37 nucleotides of mammalian 18S rRNA. Top panels are representative chromatograms, and bottom panels are quantification results. Mean ± SD (n = 3–7 biological replicates). Chromatograms were normalized to the peak area of ac4C to allow comparison between samples. The peak area of m6A was first normalized to that of ac4C and to samples with methionine. Ordinary one-way analysis of variance (ANOVA) and Dunnett’s multiple comparison test with a single pooled variance were performed to calculate the p values for (A) and (B), and unpaired two-tailed Student’s t test, assuming equal variances, was used for (D)–(H). p > 0.05 (n.s.), *p < 0.05, **p < 0.01, ***p < 0.001, ****p < 0.0001. See also Figure S3.
Figure 3.
Figure 3.. m6A and m62A in 18S rRNA are not functionally equivalent
(A) Partial sequence alignment of Dim1 homologs and 18S (16S) rDNA. Highlighted are E85 and D87 of S. cerevisiae Dim1p and the two adenosines modified as m6A or m62A. (B) E85 is a key determinant of the catalytic activity and methylation multiplicity of Dim1p. Data were acquired from the MBN protection assay using oKL204. Peak areas were normalized to that of ac4C. Chromatograms of E (WT), W (E85W), Q (E85Q), and A (E85A) were also presented in Figures 1E and S2D. (C) E85D and D87E mutations alter the methylation multiplicity of Dim1p. Chromatograms from the MBN protection assay using oKL204 were normalized to the peak area of ac4C to allow comparison between samples. (D) Quantification of m6A and m62A in 18S rRNA from dim1 mutants. Mean ± SD (n = 3–7 biological replicates). The p values were calculated using ordinary one-way ANOVA and Dunnett’s multiple comparison test with a single pooled variance. Data were also used for plotting Figure S3D (prestarvation). (E) Dim1p E85D, D87E, and E85Q mutants have lower fitness than WT. Mean ± SD (n = 4–6 biological replicates). The p values were calculated using one-sample Student’s t test. (F) m6A-bearing ribosomes participate in active translation. The peak area of m6A was normalized to that of ac4C. Mean ± SD (n = 5–6 biological replicates). **p < 0.01, ***p < 0.001, ****p < 0.0001. See also Figures S3, S4, and S8.
Figure 4.
Figure 4.. Translational regulation of sulfur metabolism genes via methylation multiplicity
(A) Change of translation efficiency (TE) under methionine-replete and methionine-starvation conditions. A 10% false discovery rate (FDR) (−log10(Padj) ≥1) and 2-fold change of TE (log2(TE fold change) ≥1 or log2(TE fold change) ≤ −1) are considered significant, and genes with significantly changed TE are highlighted in black. (B) Representative tracks of ribosome footprint (RFP) and mRNA for JLP1, YCT1, MET3, and RPN10. Two biological replicates for each genotype are shown, and tracks are comparable only within each RFP or RNA group. (C) Simplified schematic of yeast sulfur metabolism. Highlighted are proteins whose transcripts are translated with significantly lower TE in the D87E mutant under methionine-replete conditions. (D) Impact of methionine starvation on TE and mRNA levels of sulfur metabolism genes listed in (C). The p values were calculated using two-sided Mann-Whitney test. ****p < 0.0001. See also Figures S5–S7 and Tables S1, S2, and S3.
Figure 5.
Figure 5.. The E85Q mutation abolishes pausing/stalling at cysteine codons under methionine starvation
(A) Relative enrichment of ribosomes at each codon under methionine-replete and methionine-starvation conditions. Reads were mapped to the ribosome aminoacyl site (A site). Two biological replicates for each genotype are shown (two circles per genotype), with their average being represented by a solid line. The p values were calculated using unpaired two-tailed Student’s t test, assuming equal variances for comparison between WT and the E85Q mutant. (B) Representative tracks showing enrichment of ribosomes at two cysteine codons of the MET30 transcript following methionine starvation. (C) Changes in sulfurous metabolites under methionine-replete and methionine-starvation conditions. Mean ± SD (n = 2 biological replicates). (D) Schematic of the dual luciferase reporters. (E) E85Q mutant has higher decoding errors. Mean ± SD (n = 6 biological replicates). (F) Loss of RPS22B/snR44 or RPS9A does not affect decoding fidelity. Mean ± SD (n = 5–11 and n = 7–11 biological replicates for the control and the H245R reporter, respectively). (G) rRNA processing defects due to loss of TSR3 do not increase decoding errors. Mean ± SD (n = 3 biological replicates). The p values were calculated using ordinary one-way ANOVA and Dunnett’s multiple comparison test with a single pooled variance for (C) and (E)–(G). p > 0.05 (n.s.), *p < 0.05, **p < 0.01, ***p < 0.001, ****p < 0.0001. See also Figures S7 and S8.

References

    1. Agarwala SD, Blitzblau HG, Hochwagen A, and Fink GR (2012). RNA methylation by the MIS complex regulates a cell fate decision in yeast. PLoS Genet. 8, e1002732. - PMC - PubMed
    1. Alarcón CR, Goodarzi H, Lee H, Liu X, Tavazoie S, and Tavazoie SF (2015a). HNRNPA2B1 is a mediator of m(6)A-dependent nuclear RNA processing events. Cell 162, 1299–1308. - PMC - PubMed
    1. Alarcón CR, Lee H, Goodarzi H, Halberg N, and Tavazoie SF (2015b). N6-methyladenosine marks primary microRNAs for processing. Nature 519, 482–485. - PMC - PubMed
    1. Andersen TE, Porse BT, and Kirpekar F (2004). A novel partial modification at C2501 in Escherichia coli 23S ribosomal RNA. RNA 10, 907–913. - PMC - PubMed
    1. Atkinson D (1977). Cellular energy metabolism and its regulation (Academic Press; ), p. 75.

Publication types