. 2021 Mar 9;34(10):108815.
doi: 10.1016/j.celrep.2021.108815.

Most non-canonical proteins uniquely populate the proteome or immunopeptidome

Affiliations

Most non-canonical proteins uniquely populate the proteome or immunopeptidome

Maria Virginia Ruiz Cuevas et al. Cell Rep. .

Abstract

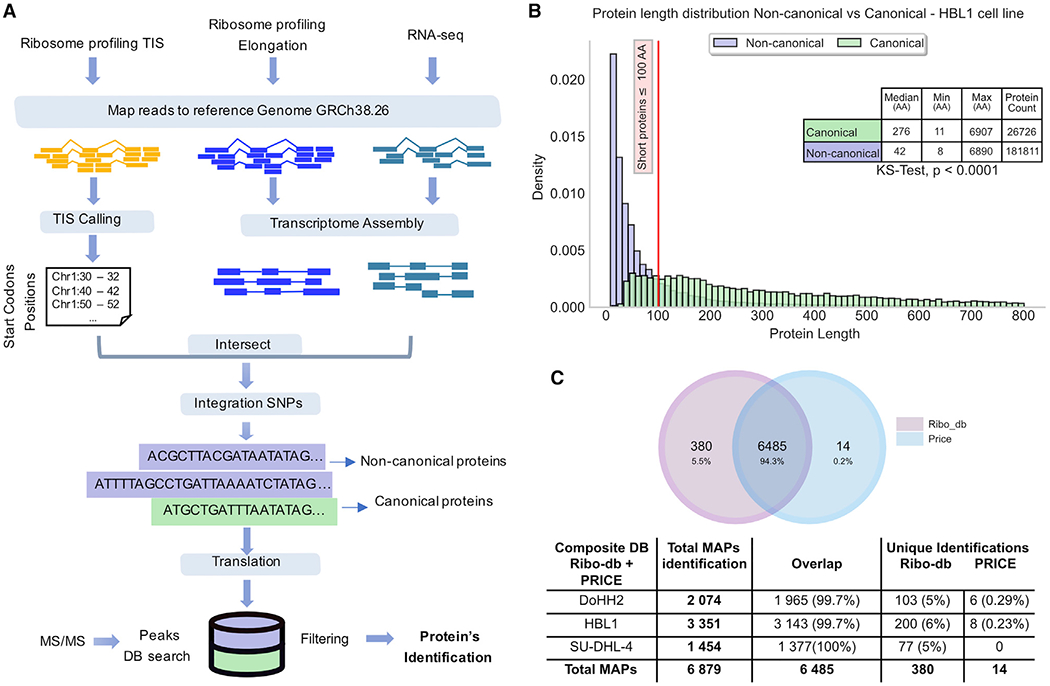
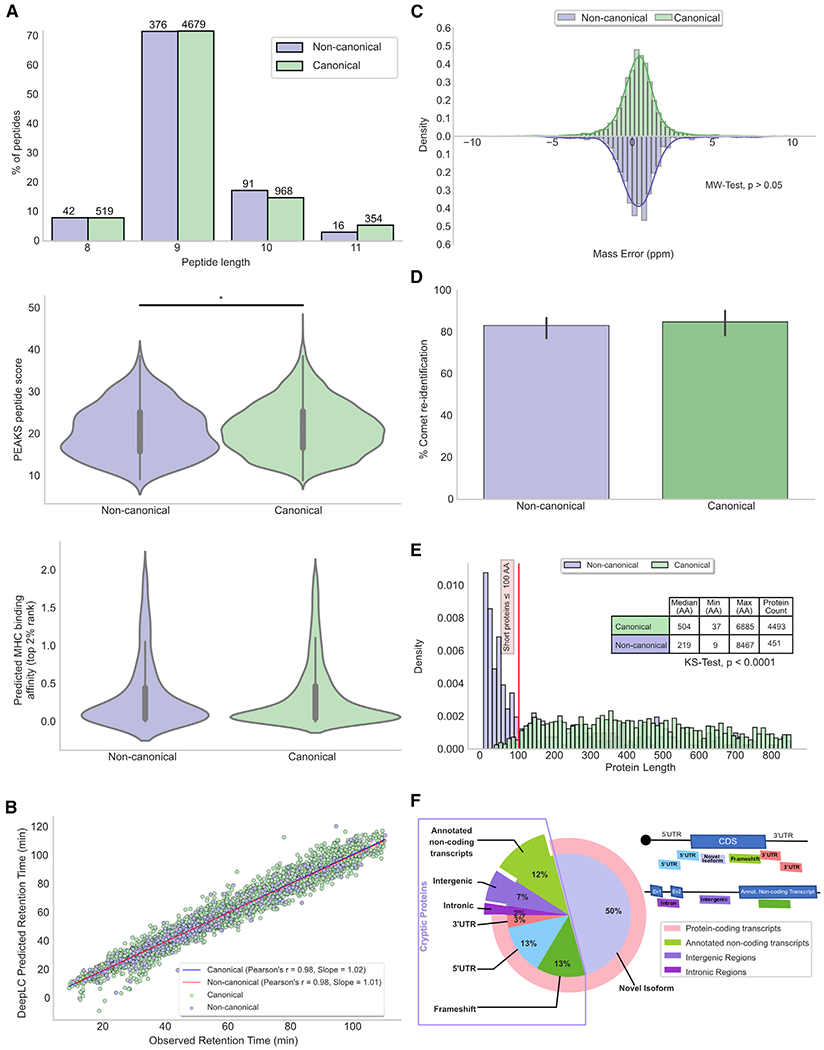
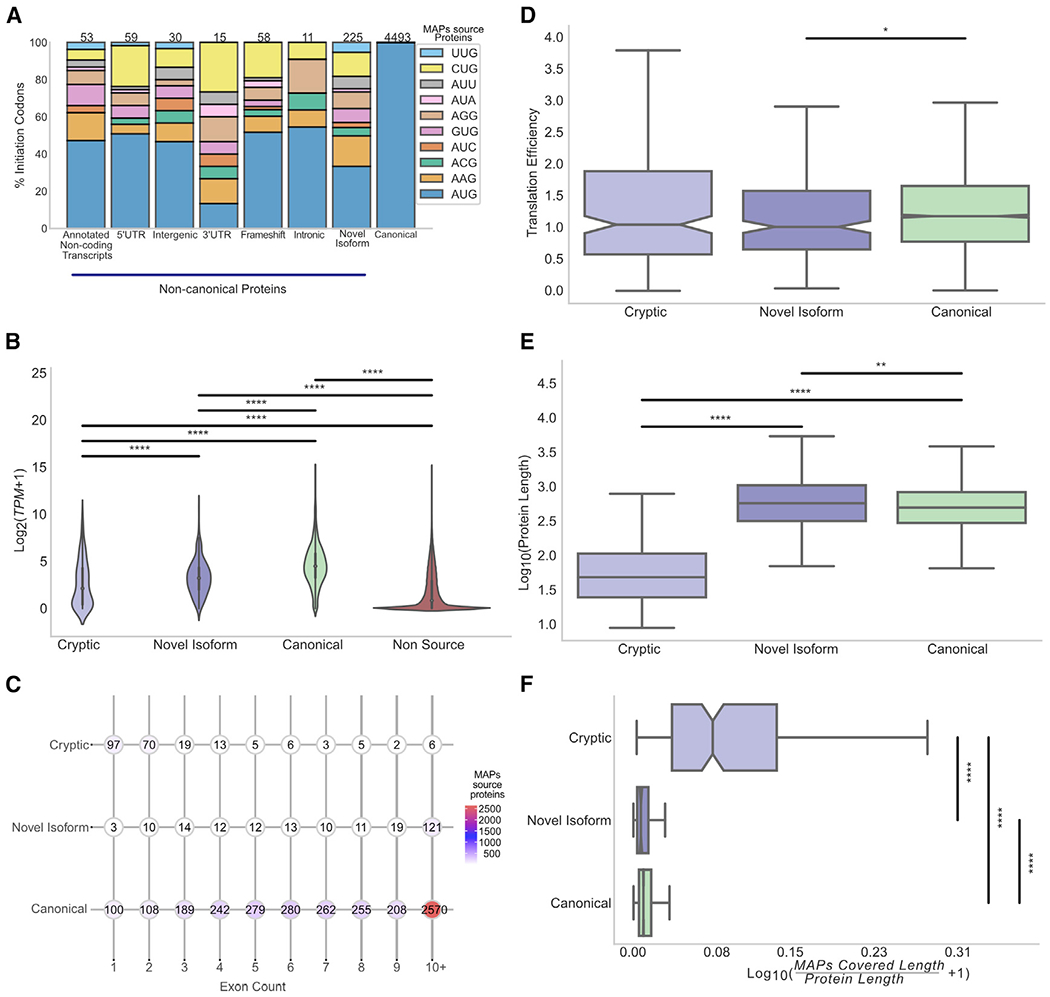
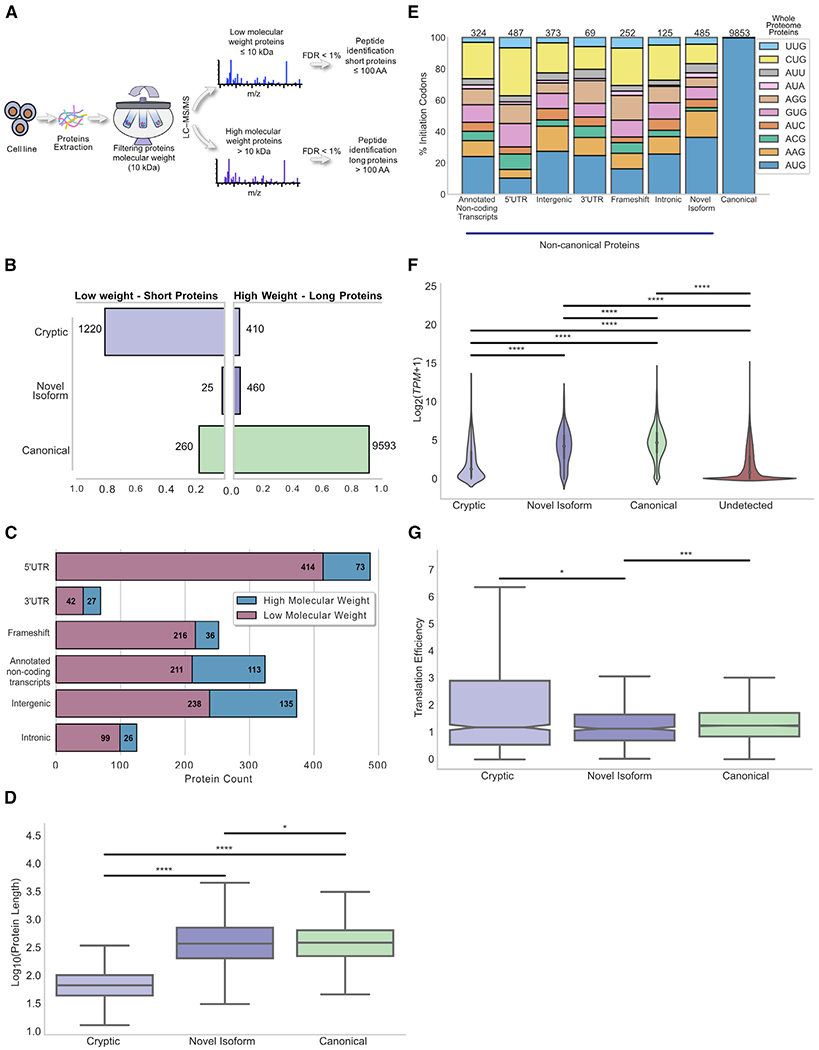
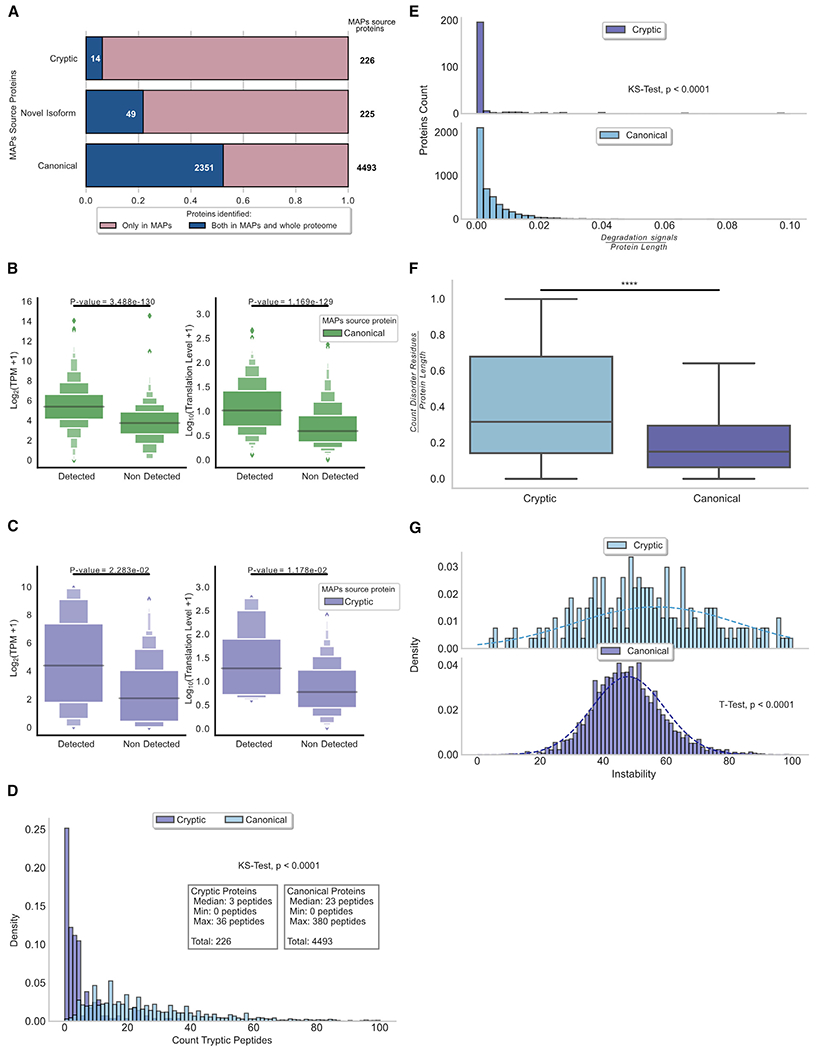
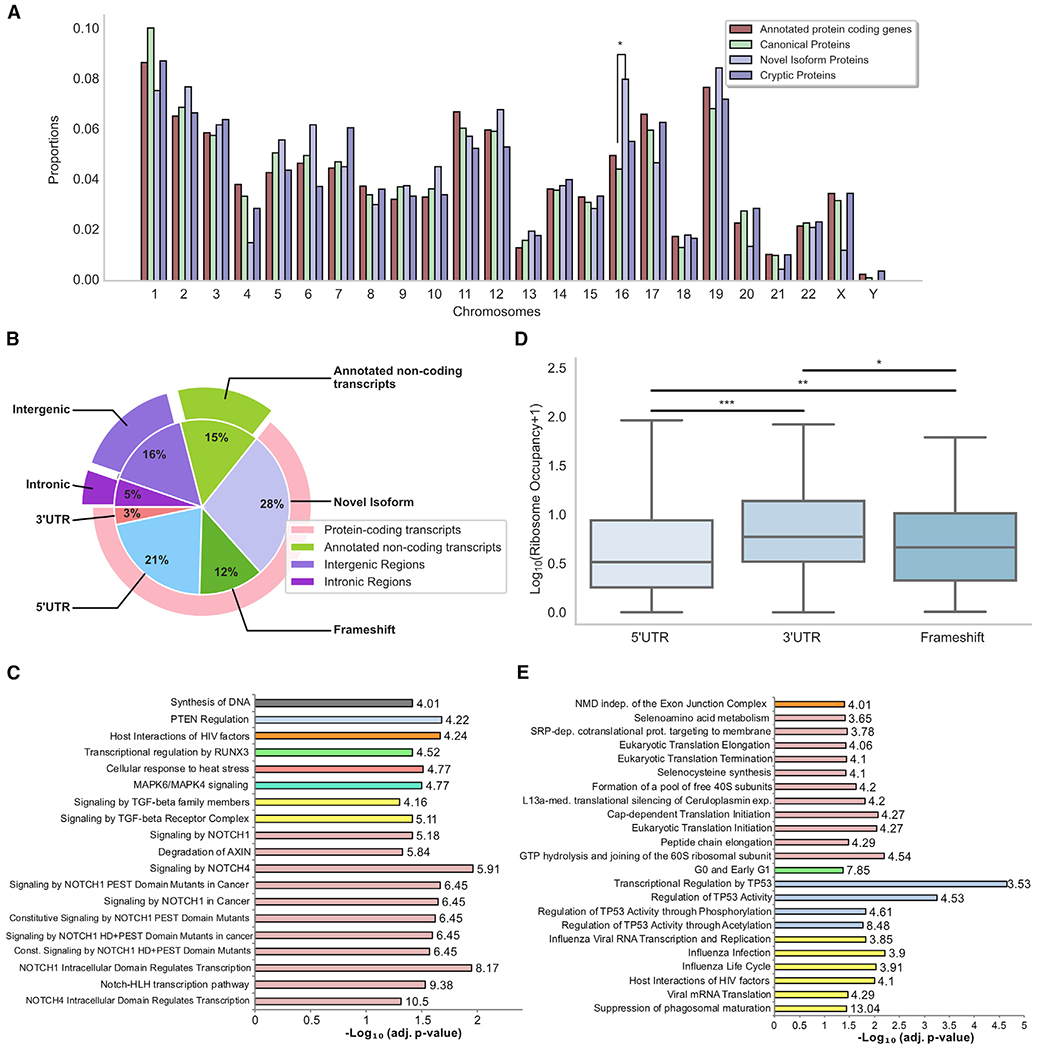
Combining RNA sequencing, ribosome profiling, and mass spectrometry, we elucidate the contribution of non-canonical translation to the proteome and major histocompatibility complex (MHC) class I immunopeptidome. Remarkably, of 14,498 proteins identified in three human B cell lymphomas, 2,503 are non-canonical proteins. Of these, 28% are novel isoforms and 72% are cryptic proteins encoded by ostensibly non-coding regions (60%) or frameshifted canonical genes (12%). Cryptic proteins are translated as efficiently as canonical proteins, have more predicted disordered residues and lower stability, and critically generate MHC-I peptides 5-fold more efficiently per translation event. Translating 5' "untranslated" regions hinders downstream translation of genes involved in transcription, translation, and antiviral responses. Novel protein isoforms show strong enrichment for signaling pathways deregulated in cancer. Only a small fraction of cryptic proteins detected in the proteome contribute to the MHC-I immunopeptidome, demonstrating the high preferential access of cryptic defective ribosomal products to the class I pathway.

Keywords: computational biology; defective ribosomal products; major histocompatibility complex; mass spectrometry; non-canonical translation; peptides; protein isoforms; proteomic methods; ribosome profiling.


Conflict of interest statement

Declaration of interests The authors declare no competing interests.

Figures

Figure 1.
Figure 1.. Ribo-seq-based proteogenomic approach for MS identification of non-canonical translation products
(A) General overview of the workflow used to generate sample-specific databases containing active canonical and non-canonical translations based on Ribo-seq data. (B) Length distribution of canonical versus non-canonical proteinsfrom HBL-1 cells. ****p < 0.0001; Kolmogorov-Smirnov test. Proteins with a length >800 amino acids are not displayed. (C) Venn diagram and table showing MAPs identified with the Ribo-db approach and the PRICE method.
Figure 2.
Figure 2.. Features of MAPs derived from canonical and non-canonical proteins
(A–C) Displayed data refer to all canonical (n = 6,520) and non-canonical (n = 525) MAPs (total from 3 cell lines, 2 replicates each). (A) Length, spectrum score (*p < 0.05; t test); MHC binding (p > 0.05; Kolmogorov-Smirnov test). (B) Pearson correlations between observed and DeepLC-predicted retention times of MAPs derived from canonical and non-canonical proteins. (C) Relative mass error of MAPs derived from canonical and non-canonical proteins. p > 0.05; two-sided Mann-Whitney U test. (D) Percentage of successful MAPs re-identification with Comet. p > 0.05; two-sided Mann-Whitney U test. Bar plot shows the median with error bars: 95% confidence interval (CI) (n = 3 cell lines). (E) Length distribution of canonical (n = 4,493) and non-canonical (n = 451) MAPs source proteins. ****p < 0.0001; Kolmogorov-Smirnov test. Proteins with a length >800 amino acids are not displayed. (F) Non-canonical MAPs source proteins derive from coding and non-coding transcripts. Pie chart showing the percentages of non-canonical proteins for each biotype and diagram illustrating how various types of transcripts were designated as a function of their genomic location.
Figure 3.
Figure 3.. Properties of MAP source proteins
(A) More than half of the non-canonical MAP source proteins (60%) initiated at a near-cognate codon. Stacked bar plot shows the percentage of proteins deriving from AUG and near-cognate codons for canonical proteins and various subgroups of non-canonical MAP source proteins. (B) Transcript expression level distribution of canonical (n = 4,493), novel isoforms (n = 225), and cryptic (n = 226) MAP source transcripts versus non-source proteins (n = 647,686). ****p < 0.0001; Kolmogorov-Smirnov test. (C) Dot charts displaying the exons count for each category of MAP source proteins; each dot corresponds to the number of proteins bearing a given number of exons (median = 2 exons for cryptic, 11 exons for novel isoform and canonical proteins). (D) Translation efficiency of MAP source proteins. Boxplots show the translation efficiency distribution for each category of MAP source proteins. *p < 0.05; two sided Mann-Whitney U test. (E) Boxplots indicate the length distribution of MAP source proteins for each category: cryptic; novel isoform; and canonical. Median length in cryptic (49 amino acids), canonical (504 amino acids), and novel isoform (582 amino acids) is shown. **p < 0.01; ****p < 0.0001; two-sided Mann-Whitney U test. (F) Cryptic proteins are proficient in generating MAPs. Boxplots show the ratio of the length covered by MAPs to the protein’s length in number of amino acids. ****p < 0.0001; two-sided Mann-Whitney U tests.
Figure 4.
Figure 4.. Features of canonical and cryptic proteins detected in tryptic digests of whole-cell extracts
(A) Schematic overview of the method used for whole-proteome analyses. Proteins were filtered according to their molecular weight to maximize the detection of short proteins, which are a rich source of cryptic proteins. (B–D) Displayed data refer to 3 cell lines, 1 replicate each. (B) Proportion of each protein category detected in low-versus high-molecular-weight fractions. Low-weight fraction is enriched in cryptic proteins, whereas high-weight fraction is enriched in canonical proteins. (C) Genomic origin of cryptic proteins identified in the whole-proteome extracts. (D) Boxplots indicating the length distribution of proteins for each category: cryptic; novel isoform; and canonical. Median length of cryptic (67 amino acids), canonical (387 amino acids), and novel isoform (372 amino acids) proteins is shown. *p < 0.05; ****p < 0.0001; two-sided Mann–Whitney U test. (E) Stacked bar plot showing the percentage of proteins deriving from AUG and near-cognate codons for canonical proteins along with each subgroup of the non-canonical proteins from whole-proteome extracts. (F) RNA expression level of transcripts coding for detected (n = 11,968) proteins compared to transcripts coding for undetected proteins (n = 640,662). ****p < 0.0001; Kolmogorov-Smirnov test. (G) Boxplots showing the translation efficiency of various categories of proteins identified from whole-proteome extracts. *p < 0.05; **p < 0.01; two-sided Mann-Whitney U test.
Figure 5.
Figure 5.. Cryptic proteins are disordered and unstable
(A) MAP source proteins are underrepresented in the whole-proteome analysis. Bar plot depicting the total number of proteins identified in the immunopeptidome (pink bars) and the overlap with proteins detected in the whole proteome (blue bars) is shown. Cryptic proteins showed a low overlap (6%) compared to novel isoforms (21%) and canonical proteins (52%). (B) Transcription- and translation-level abundance of canonical MAP source proteins. Left panel: box plots show the transcription expression level of transcripts at the origin of canonical MAP source proteins detected and non-detected in the whole-proteome analysis. Right panel: box plots show the translation level of transcripts at the origin of canonical MAP source proteins detected and non-detected in the whole-cell proteome analysis. Statistical difference was assessed by Mann-Whitney U test. (C) Transcription- and translation-level abundance of cryptic MAP source proteins. Left panel: box plots show the transcription expression level of transcripts at the origin of cryptic MAP source proteins detected and non-detected in the whole-proteome analysis. Right panel: box plots show the translation level of transcripts at the origin of cryptic MAP source proteins detected and non-detected in the whole-cell proteome analysis. Statistical difference was assessed by Mann-Whitney U test. (D) Distribution of the number of predicted tryptic peptides per MAP source protein (median = 3 peptides for cryptic proteins and 23 peptides for canonical proteins). Statistical significance was assessed by Kolmogorov-Smirnov test. (E) Cryptic proteins present fewer degradation signals compared to canonical proteins. Histogram plots in the top and bottom panels depict the number of predicted degradation signal (canonical ubiquitination sites, D box, and KEN box motifs) relative to the protein size for cryptic and canonical proteins, respectively. Statistical significance was assessed by Kolmogorov-Smirnov test. (F) Cryptic proteins contain significantly more disordered residues than canonical proteins. Boxplots depicting the number of disordered residues predicted per protein relative to the protein’s length for cryptic and canonical proteins source of MAPs are shown. ****p < 0.0001; two-sided Wilcoxon rank-sum test. (G) Cryptic proteins are less stable in vivo. Histogram plot showing the distribution of the instability index predicted for cryptic and canonical proteins. Statistical significance was assessed by Student’s t test.
Figure 6.
Figure 6.. Chromosomal origin and function of non-canonical proteins
(A) Non-canonical identified proteins derive from all chromosomes. Bar graph shows the chromosomal origin of each category of proteins. *p < 0.05; two-sided Fisher’s exact test. (B) Genomic origins of the whole set of non-canonical identified proteins. Pie chart shows the percentages of non-canonical proteins derived from different genomic regions. (C) Novel isoforms derive from genes that regulate pathways commonly perturbed in DLBCL and other cancers. Reactome pathways enriched in the list of genes corresponding to proteins for which a novel isoform was identified (n = 403 unique genes). Panther overrepresentation test; numbers in the bargraph correspond to fold enrichment of each pathway. Fisher’s exact test with FDR correction; adj. p < 0.05; fold enrichment >4. (D) 5′ UTR cryptic proteins hinder the translation of main ORFs. Ribosome occupancy of the canonical coding sequence (CDS) of genes producing a cryptic protein via frameshift, 5′ UTR, or 3′ UTR translation is shown. *p < 0.05; **p < 0.01; ***p < 0.001; two-sided Mann-Whitney U test. (E) 5′ UTR cryptic proteins regulate the translation of canonical proteins involved in transcription, translation, and antiviral responses (n = 501 unique genes). Panther overrepresentation test; numbers on the bargraph correspond to fold enrichment of each pathway. Fisher’sexacttest with FDR correction; adj. p < 0.05; fold enrichment >3.

References

    1. Apcher S, Millot G, Daskalogianni C, Scherl A, Manoury B, and Fåhraeus R (2013). Translation of pre-spliced RNAs in the nuclear compartment generates peptides for the MHC class I pathway. Proc. Natl. Acad. Sci. USA 110, 17951–17956. - PMC - PubMed
    1. Aster JC, Pear WS, and Blacklow SC (2017). The varied roles of Notch in cancer. Annu. Rev. Pathol. 12, 245–275. - PMC - PubMed
    1. Bassani-Sternberg M, Pletscher-Frankild S, Jensen LJ, and Mann M (2015). Mass spectrometry of human leukocyte antigen class I peptidomes reveals strong effects of protein abundance and turnover on antigen presentation. Mol. Cell. Proteomics 14, 658–673. - PMC - PubMed
    1. Blaha DT, Anderson SD, Yoakum DM, Hager MV, Zha Y, Gajewski TF, and Kranz DM (2019). High-throughput stability screening of neoantigen/HLA complexes improves immunogenicity predictions. Cancer Immunol. Res. 7, 50–61. - PMC - PubMed
    1. Blakeley P, Overton IM, and Hubbard SJ (2012). Addressing statistical biases in nucleotide-derived protein databases for proteogenomic search strategies. J. Proteome Res. 11, 5221–5234. - PMC - PubMed

Publication types

MeSH terms