. 2021 Mar 9;54(3):499-513.e5.
doi: 10.1016/j.immuni.2021.02.002.

Interleukin-6 produced by enteric neurons regulates the number and phenotype of microbe-responsive regulatory T cells in the gut

Affiliations

Interleukin-6 produced by enteric neurons regulates the number and phenotype of microbe-responsive regulatory T cells in the gut

Yiqing Yan et al. Immunity. .

Abstract

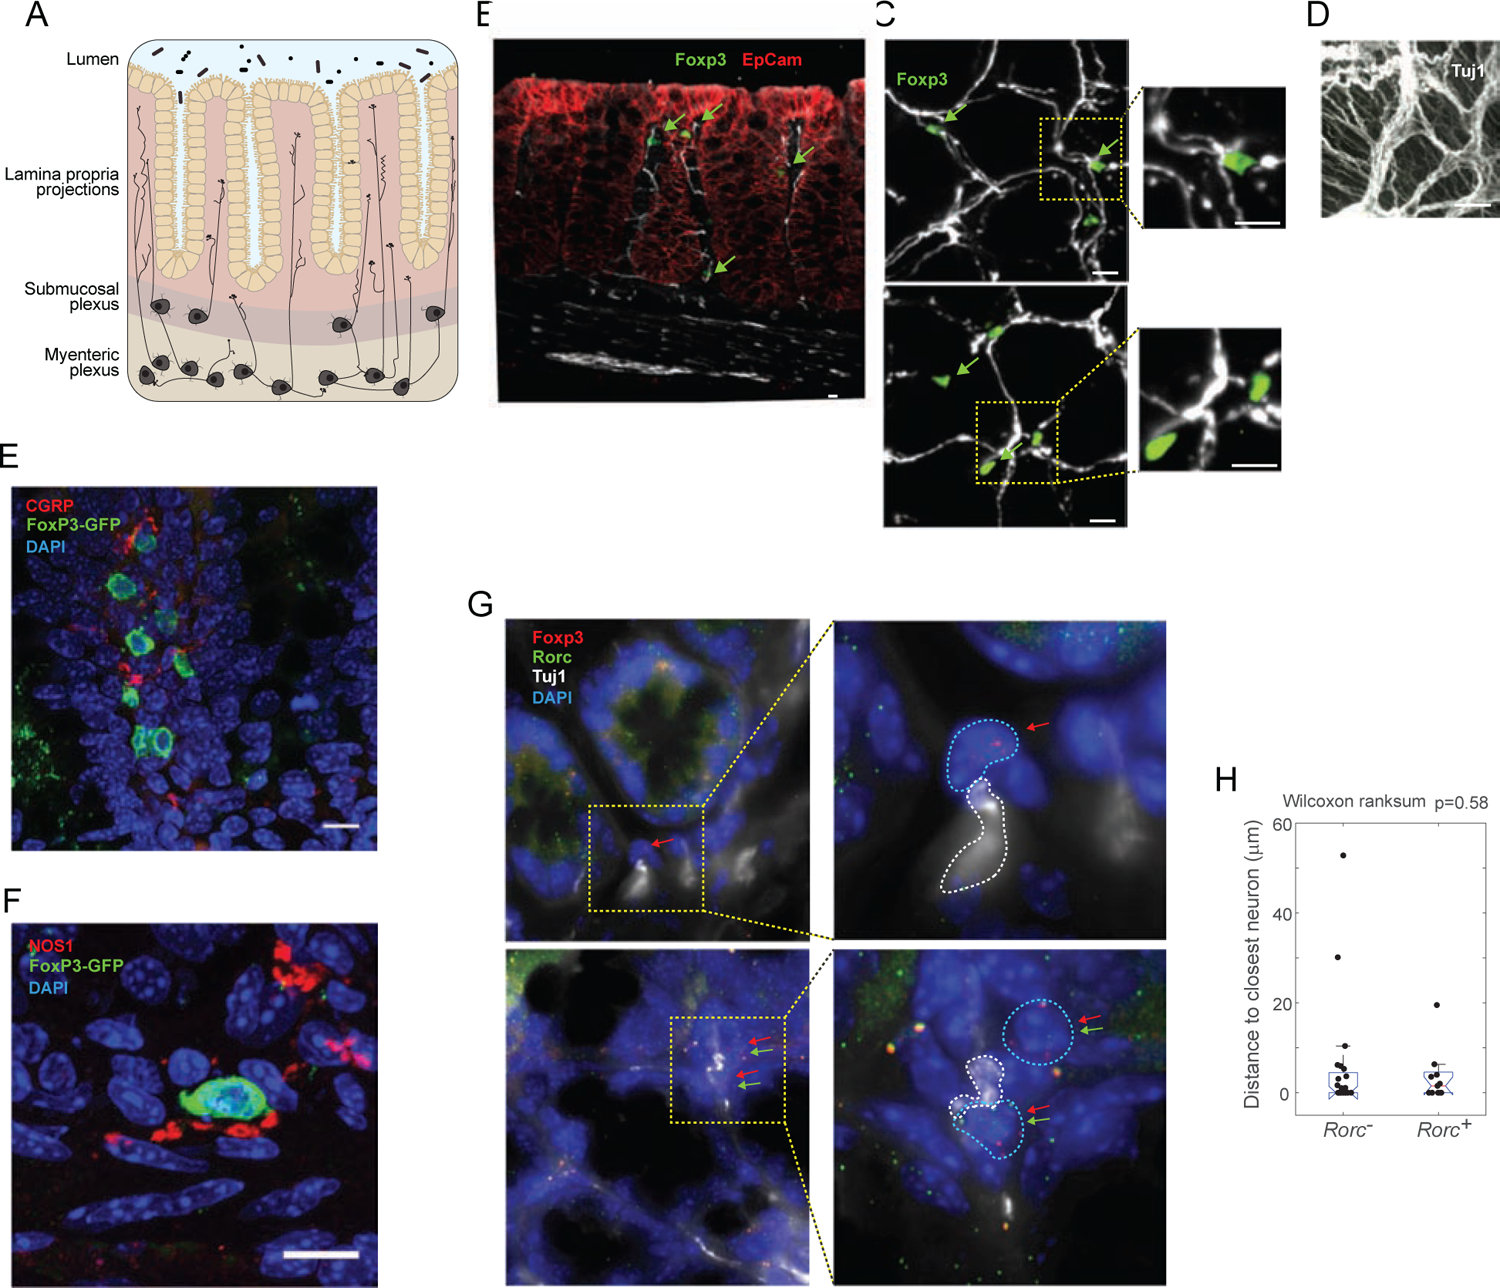
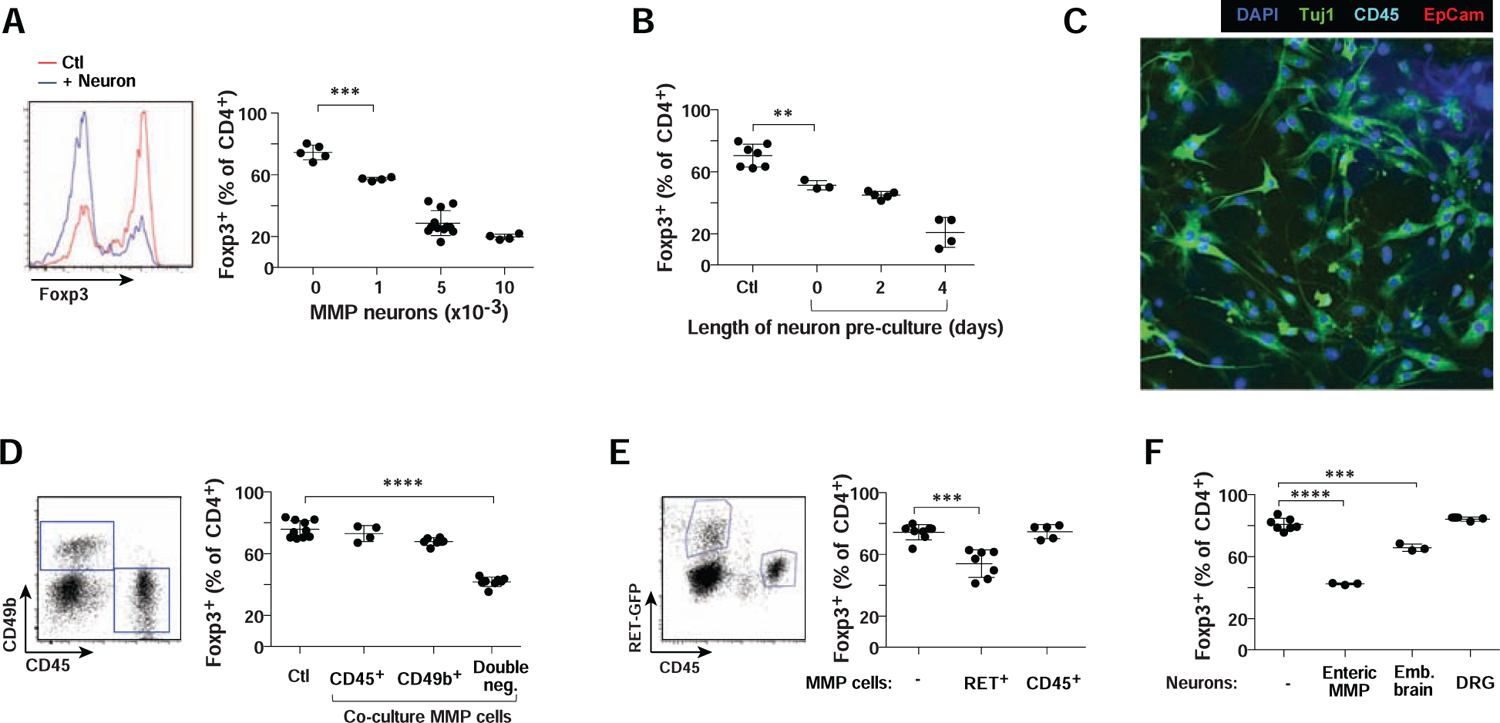
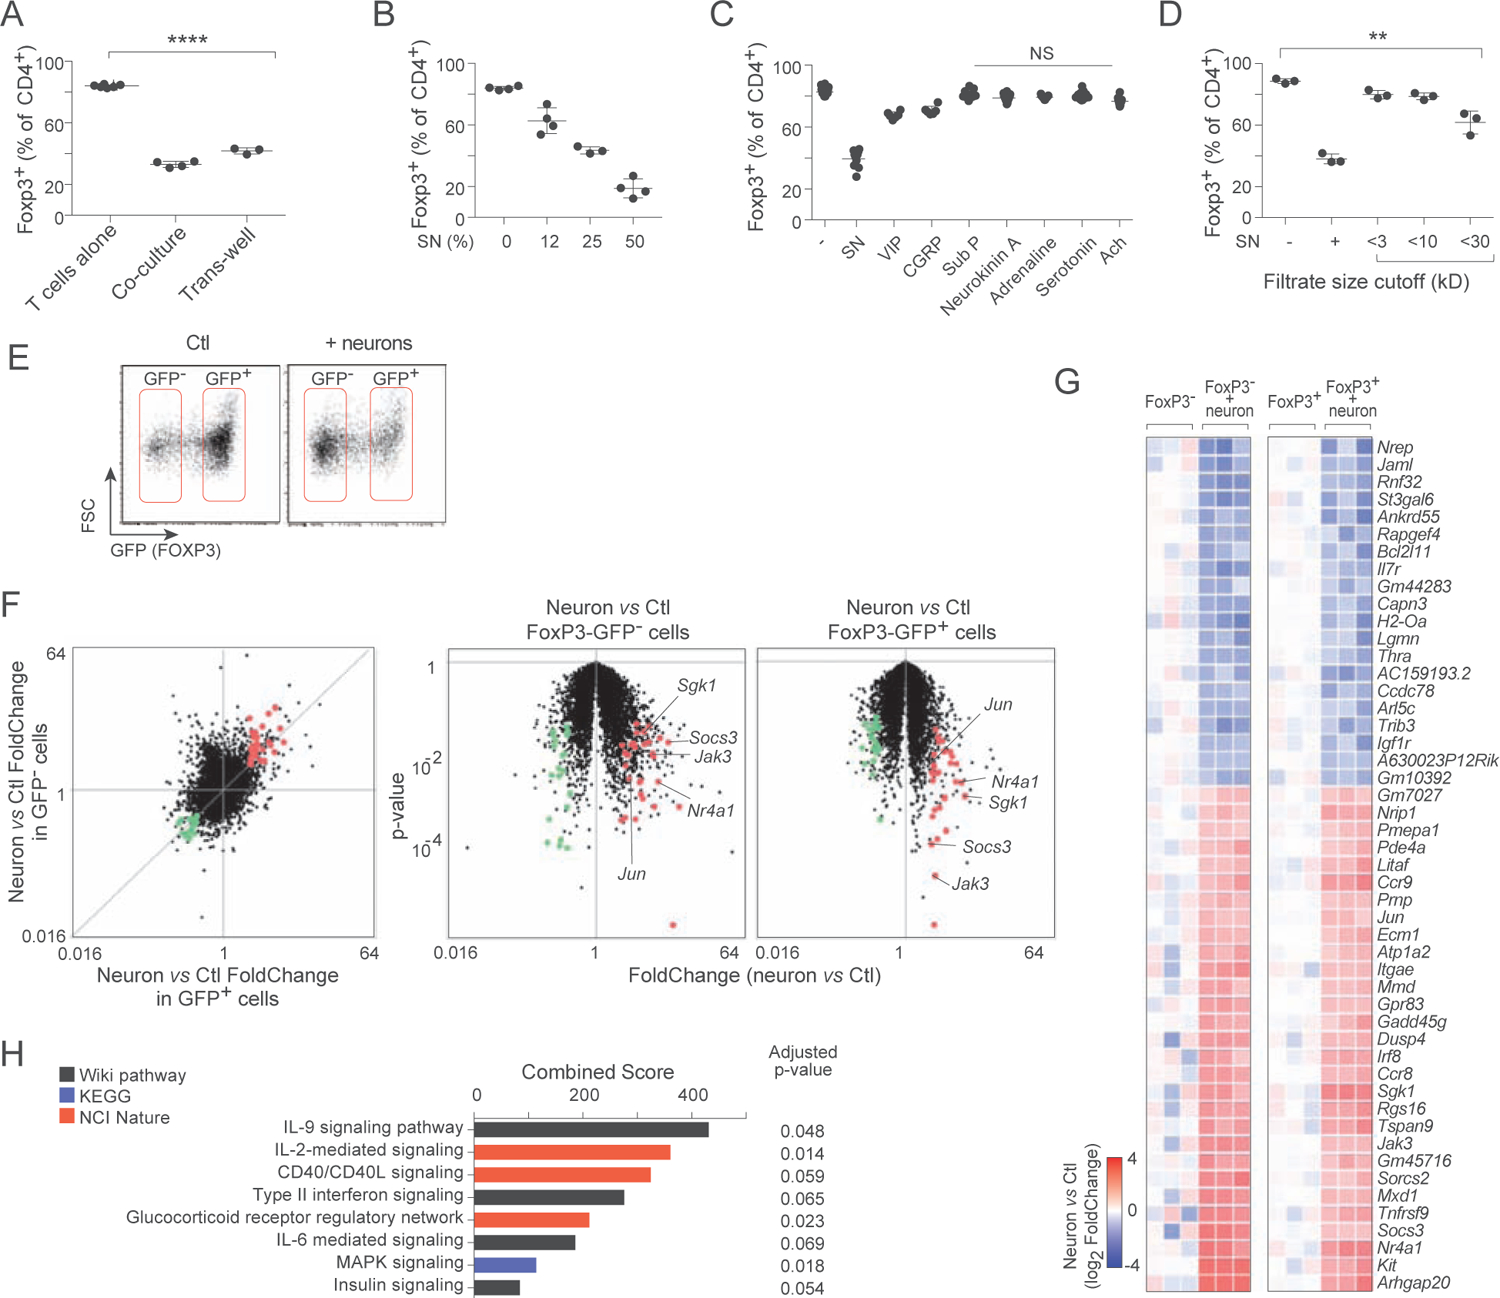
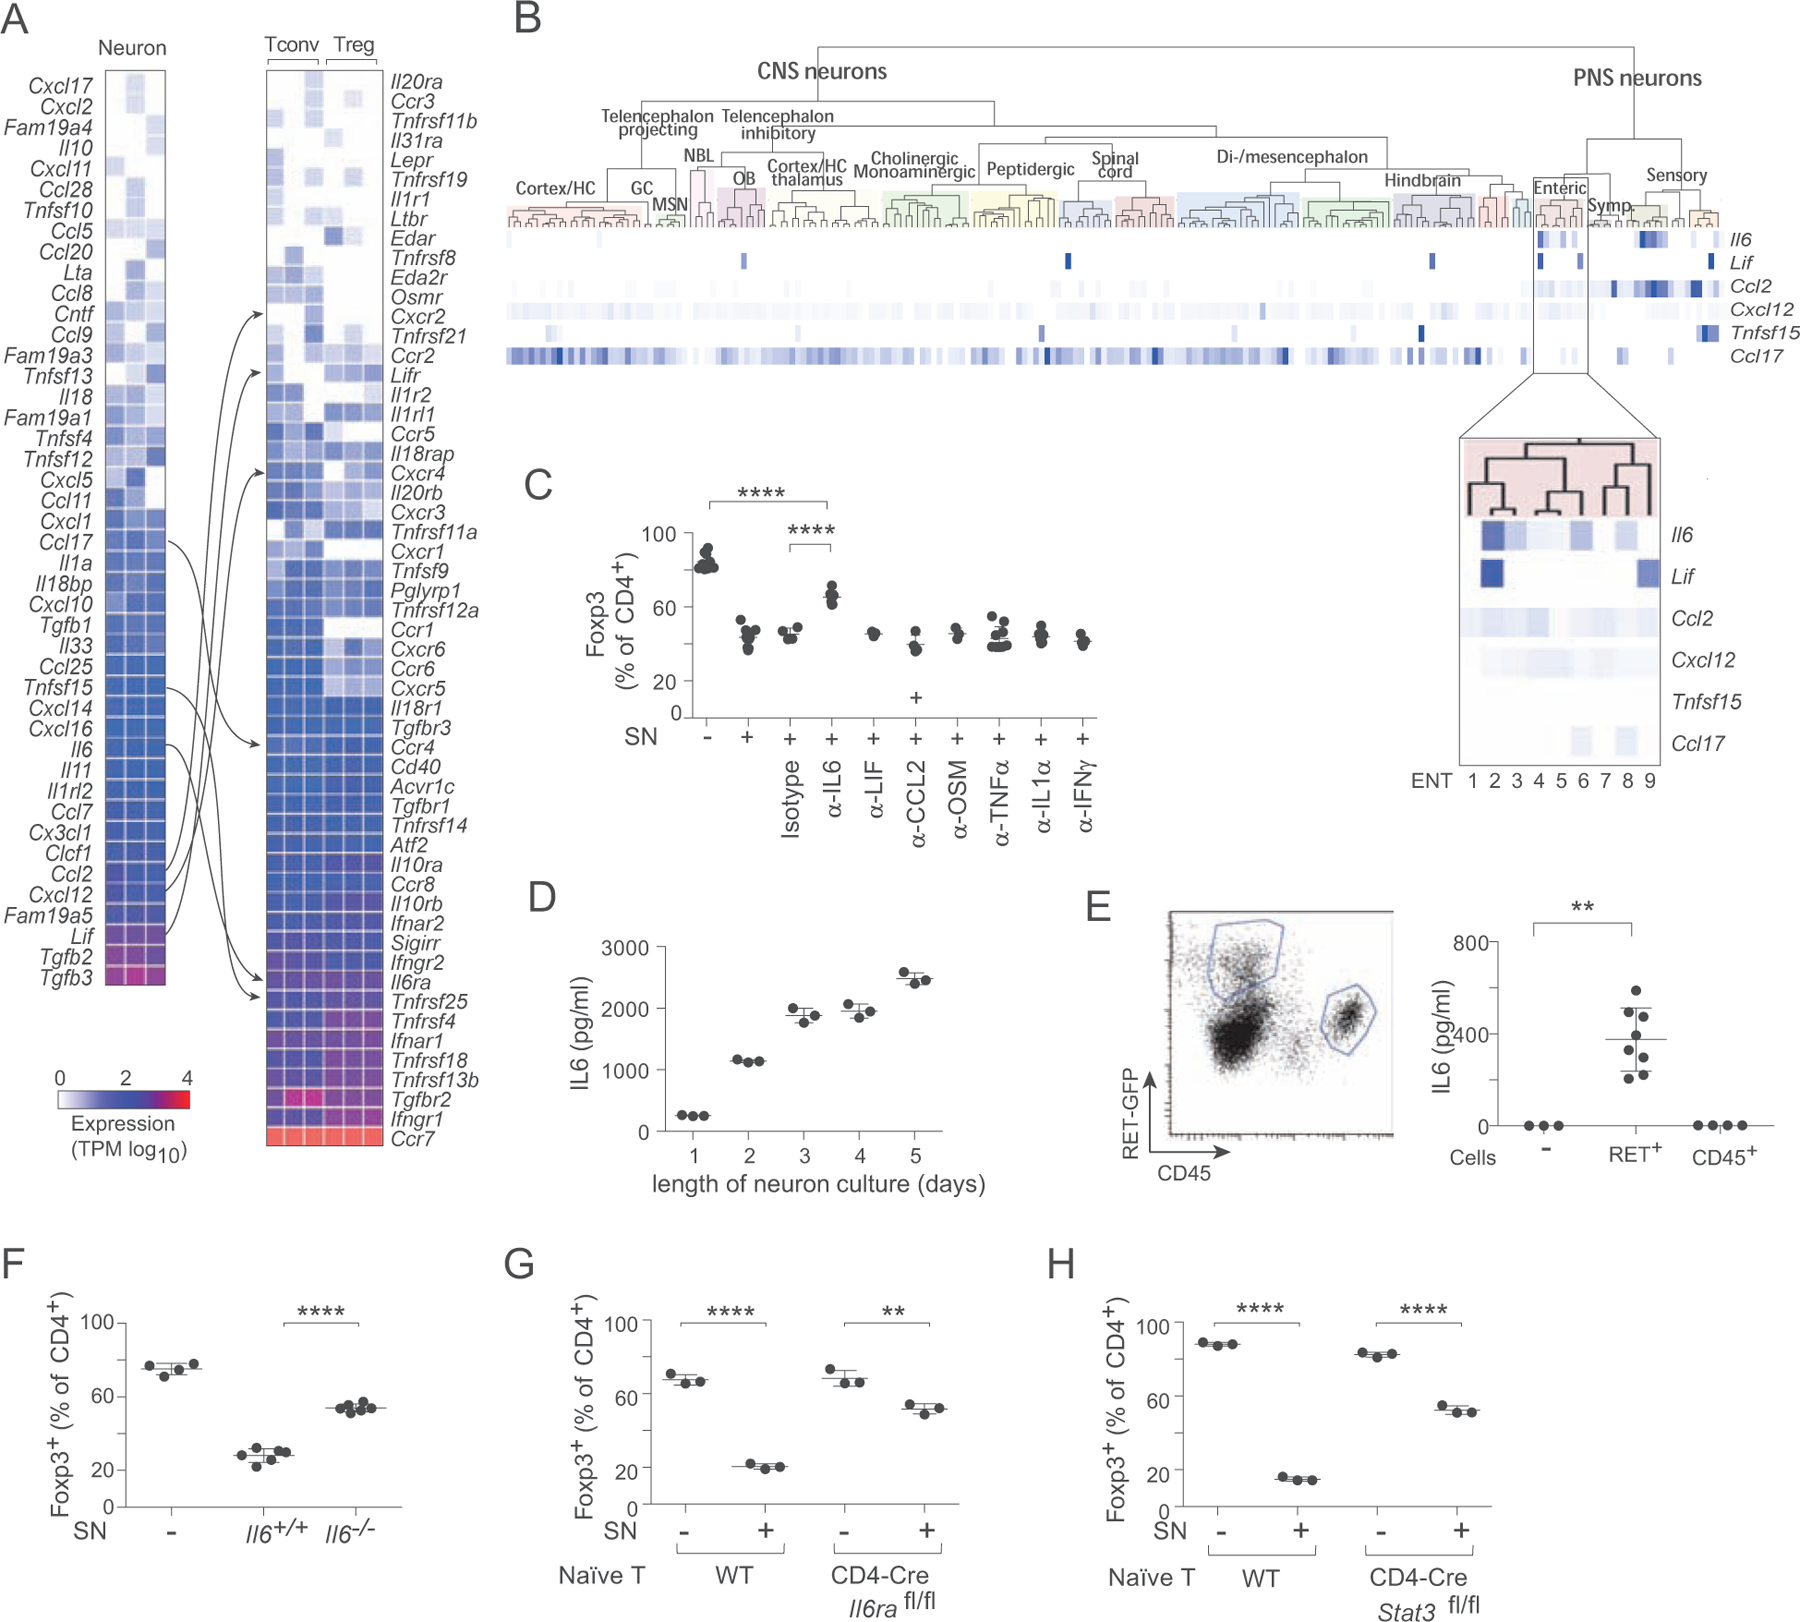
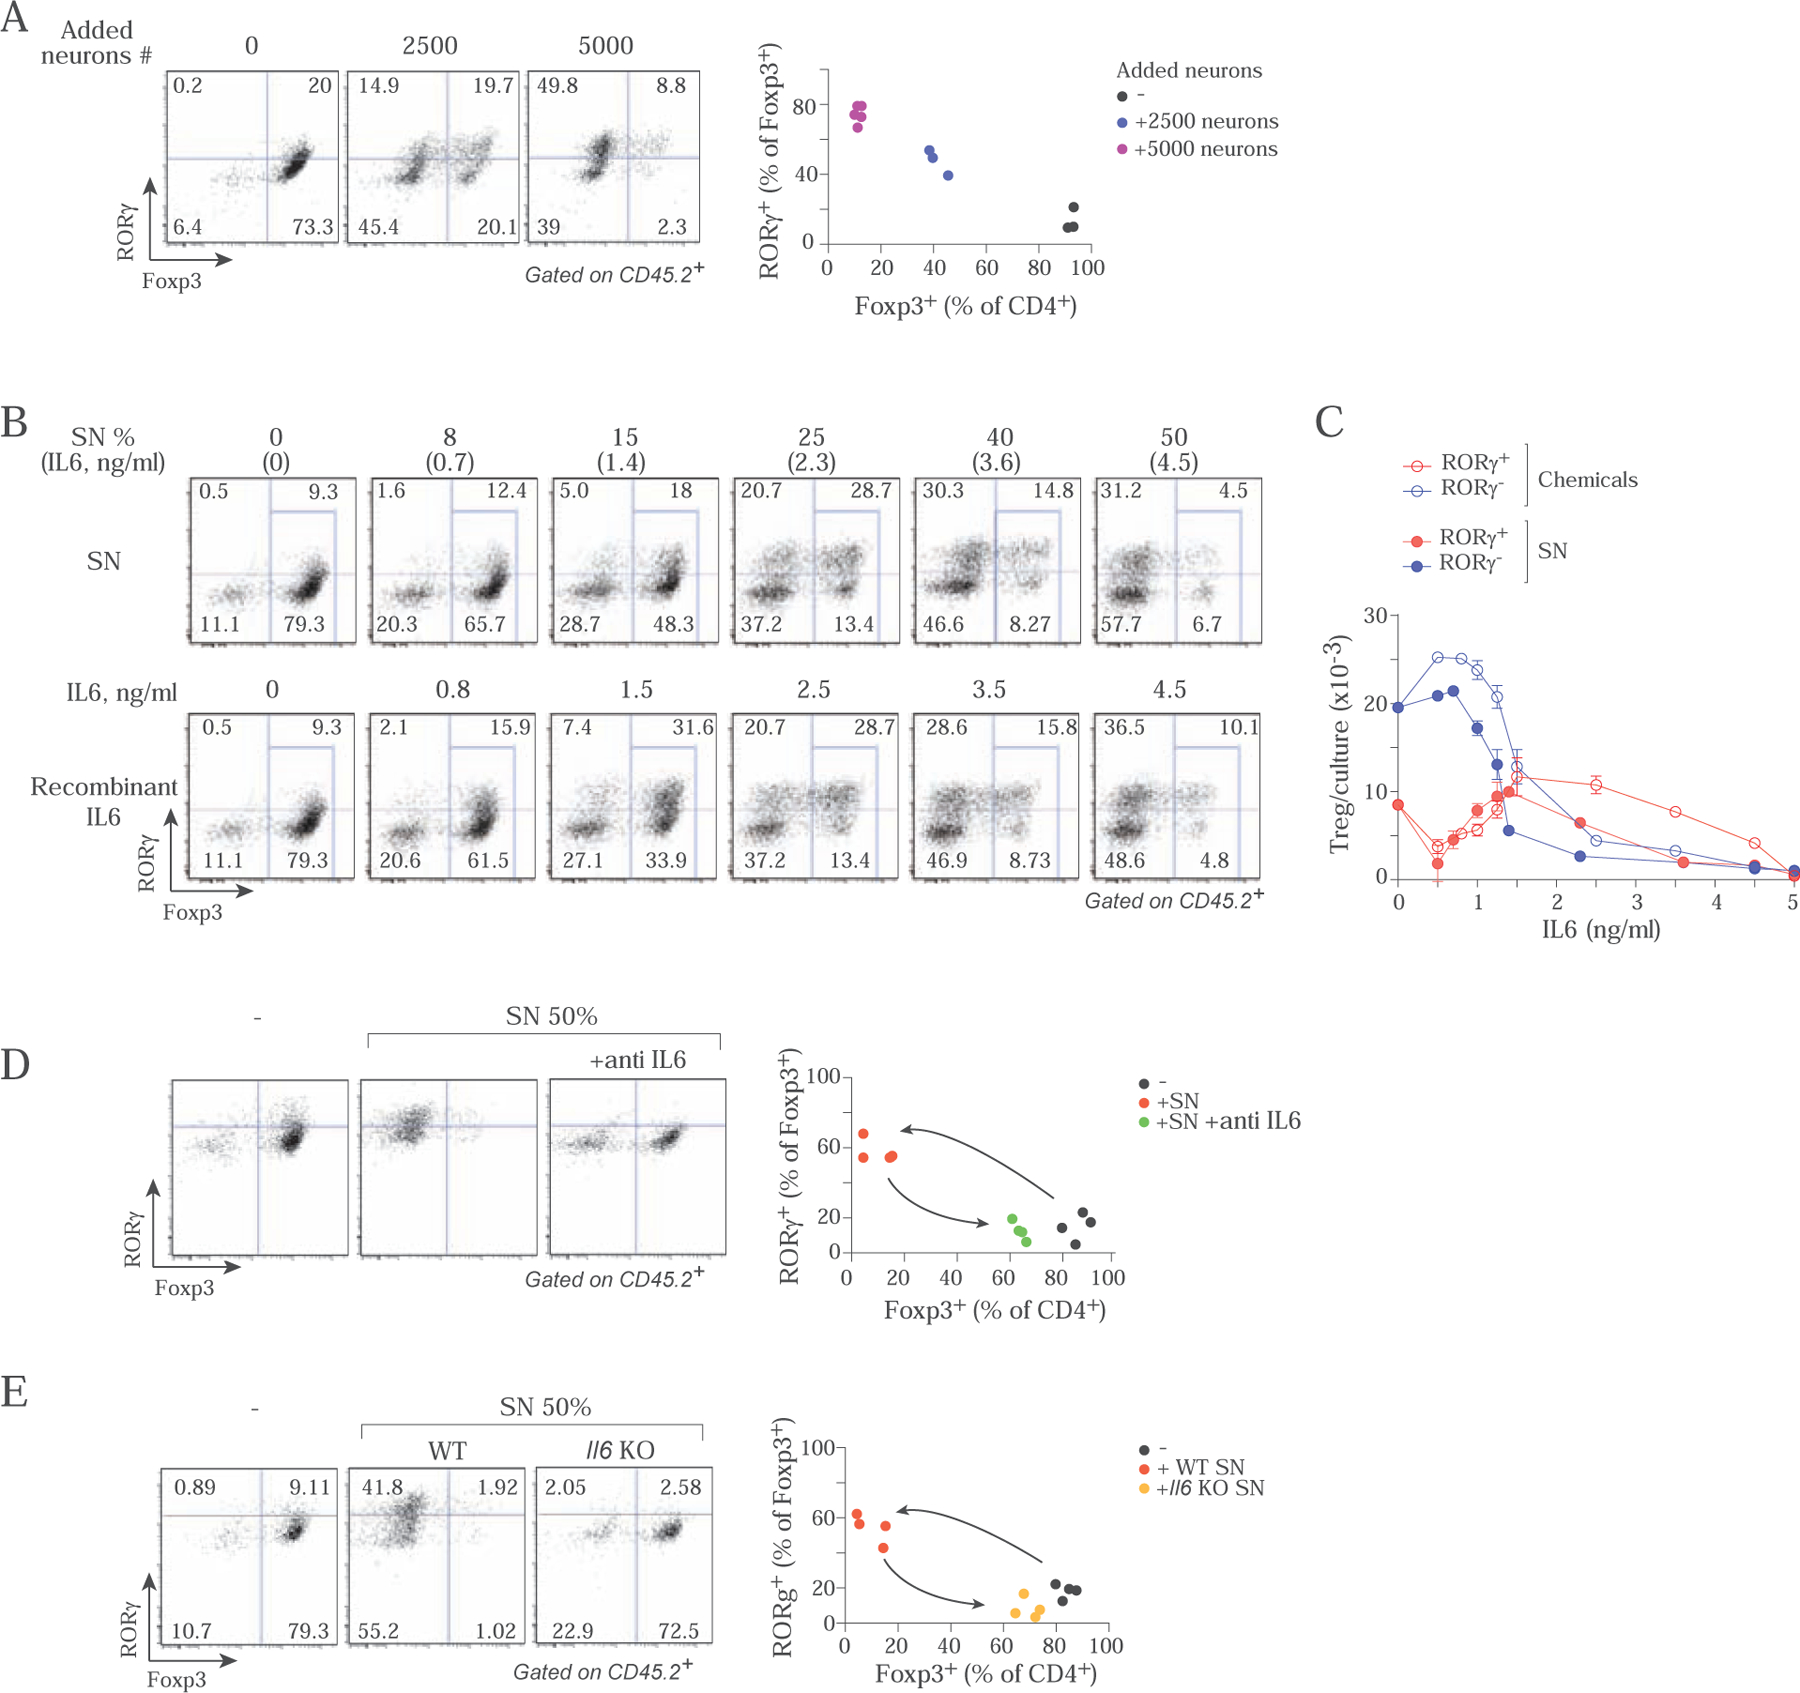
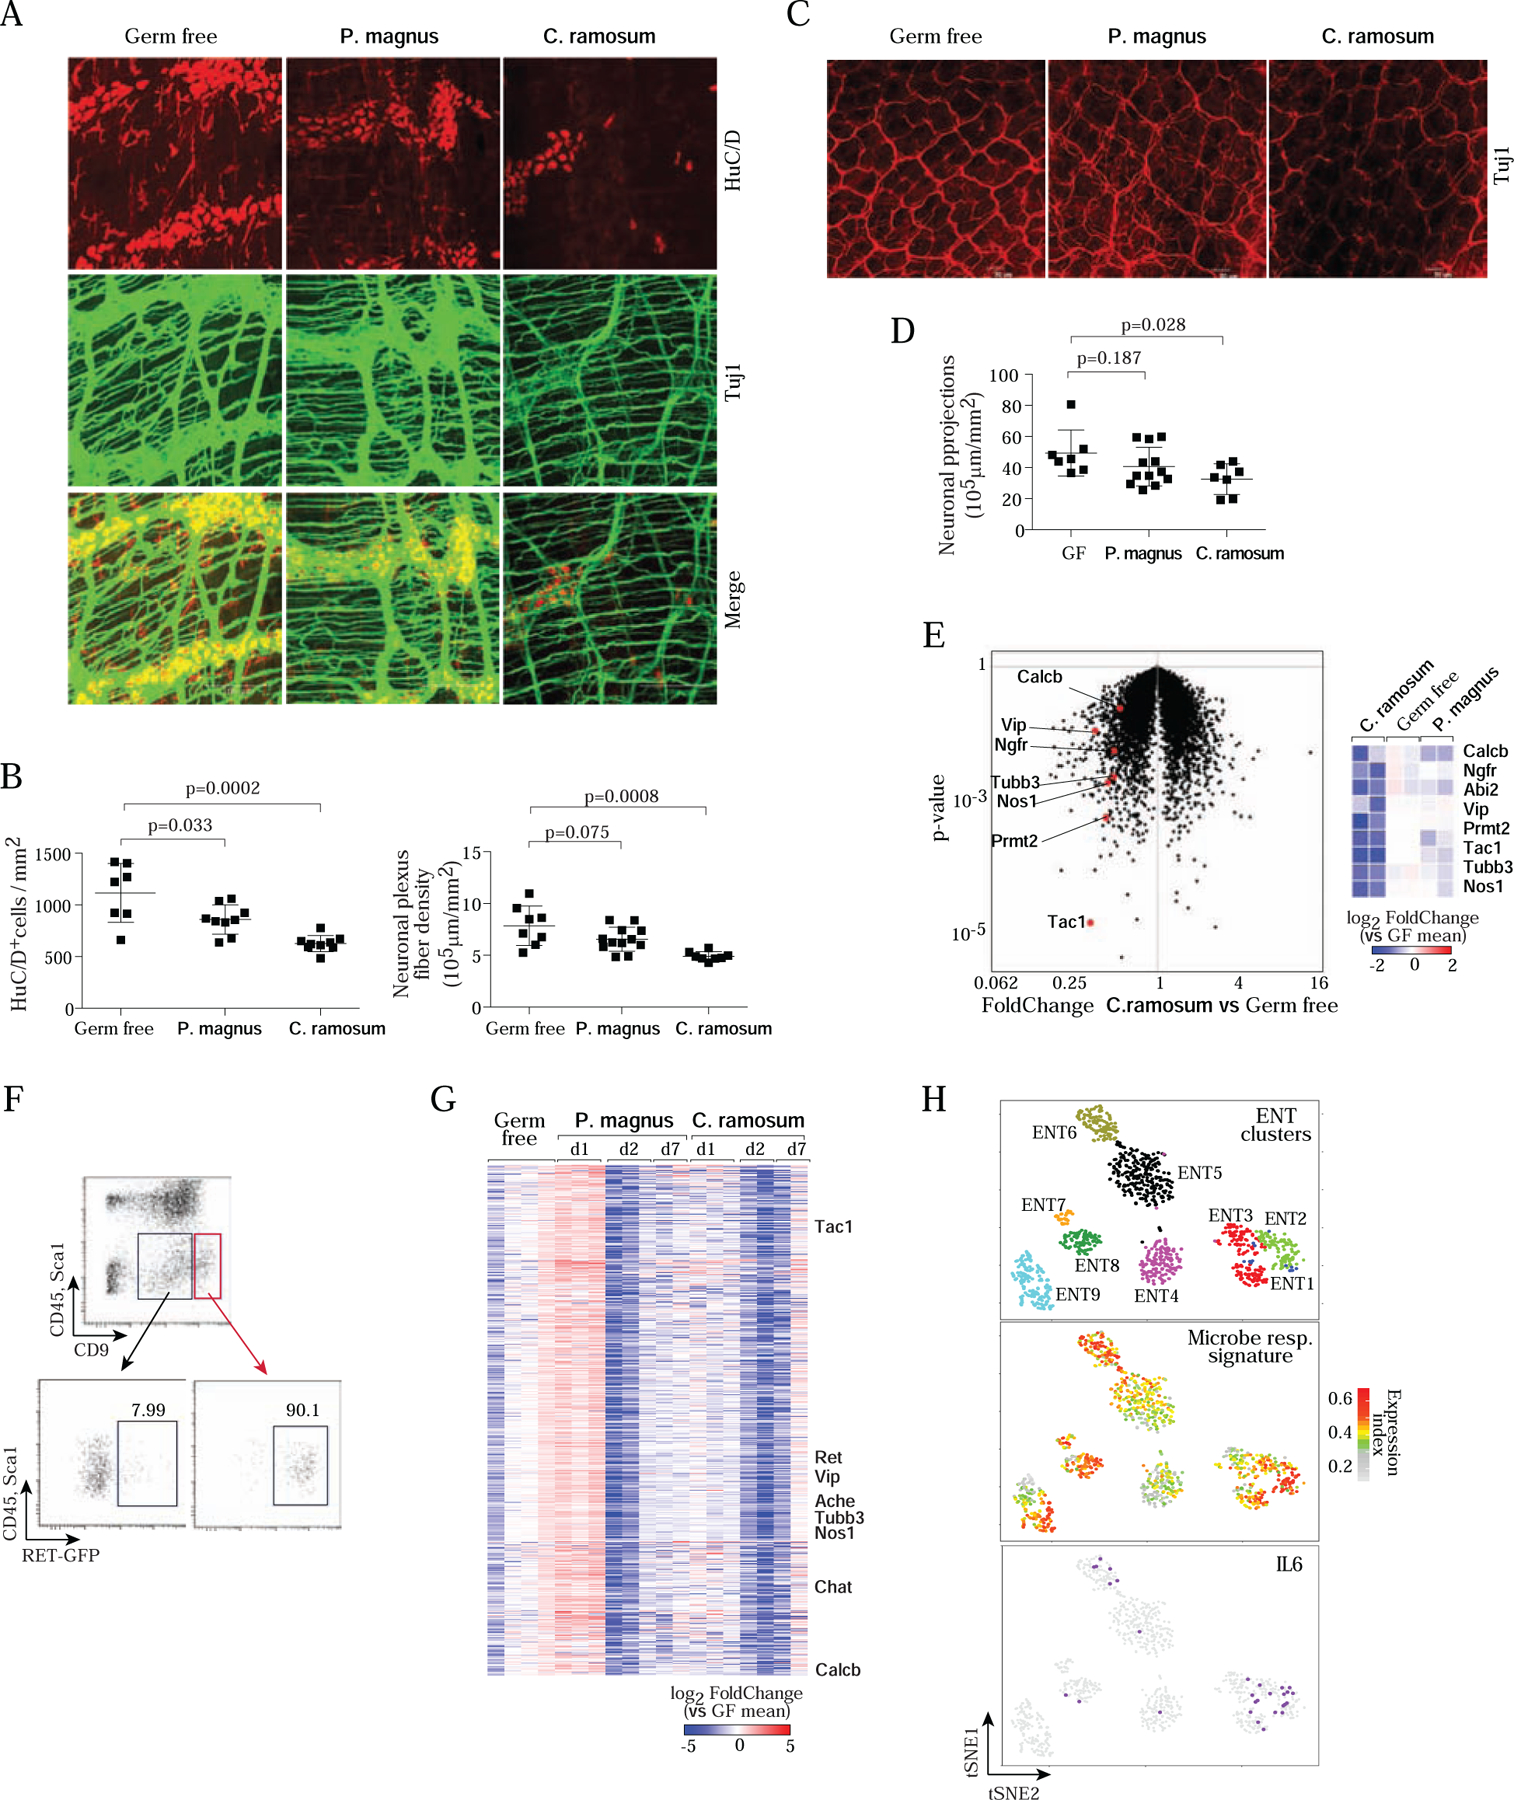
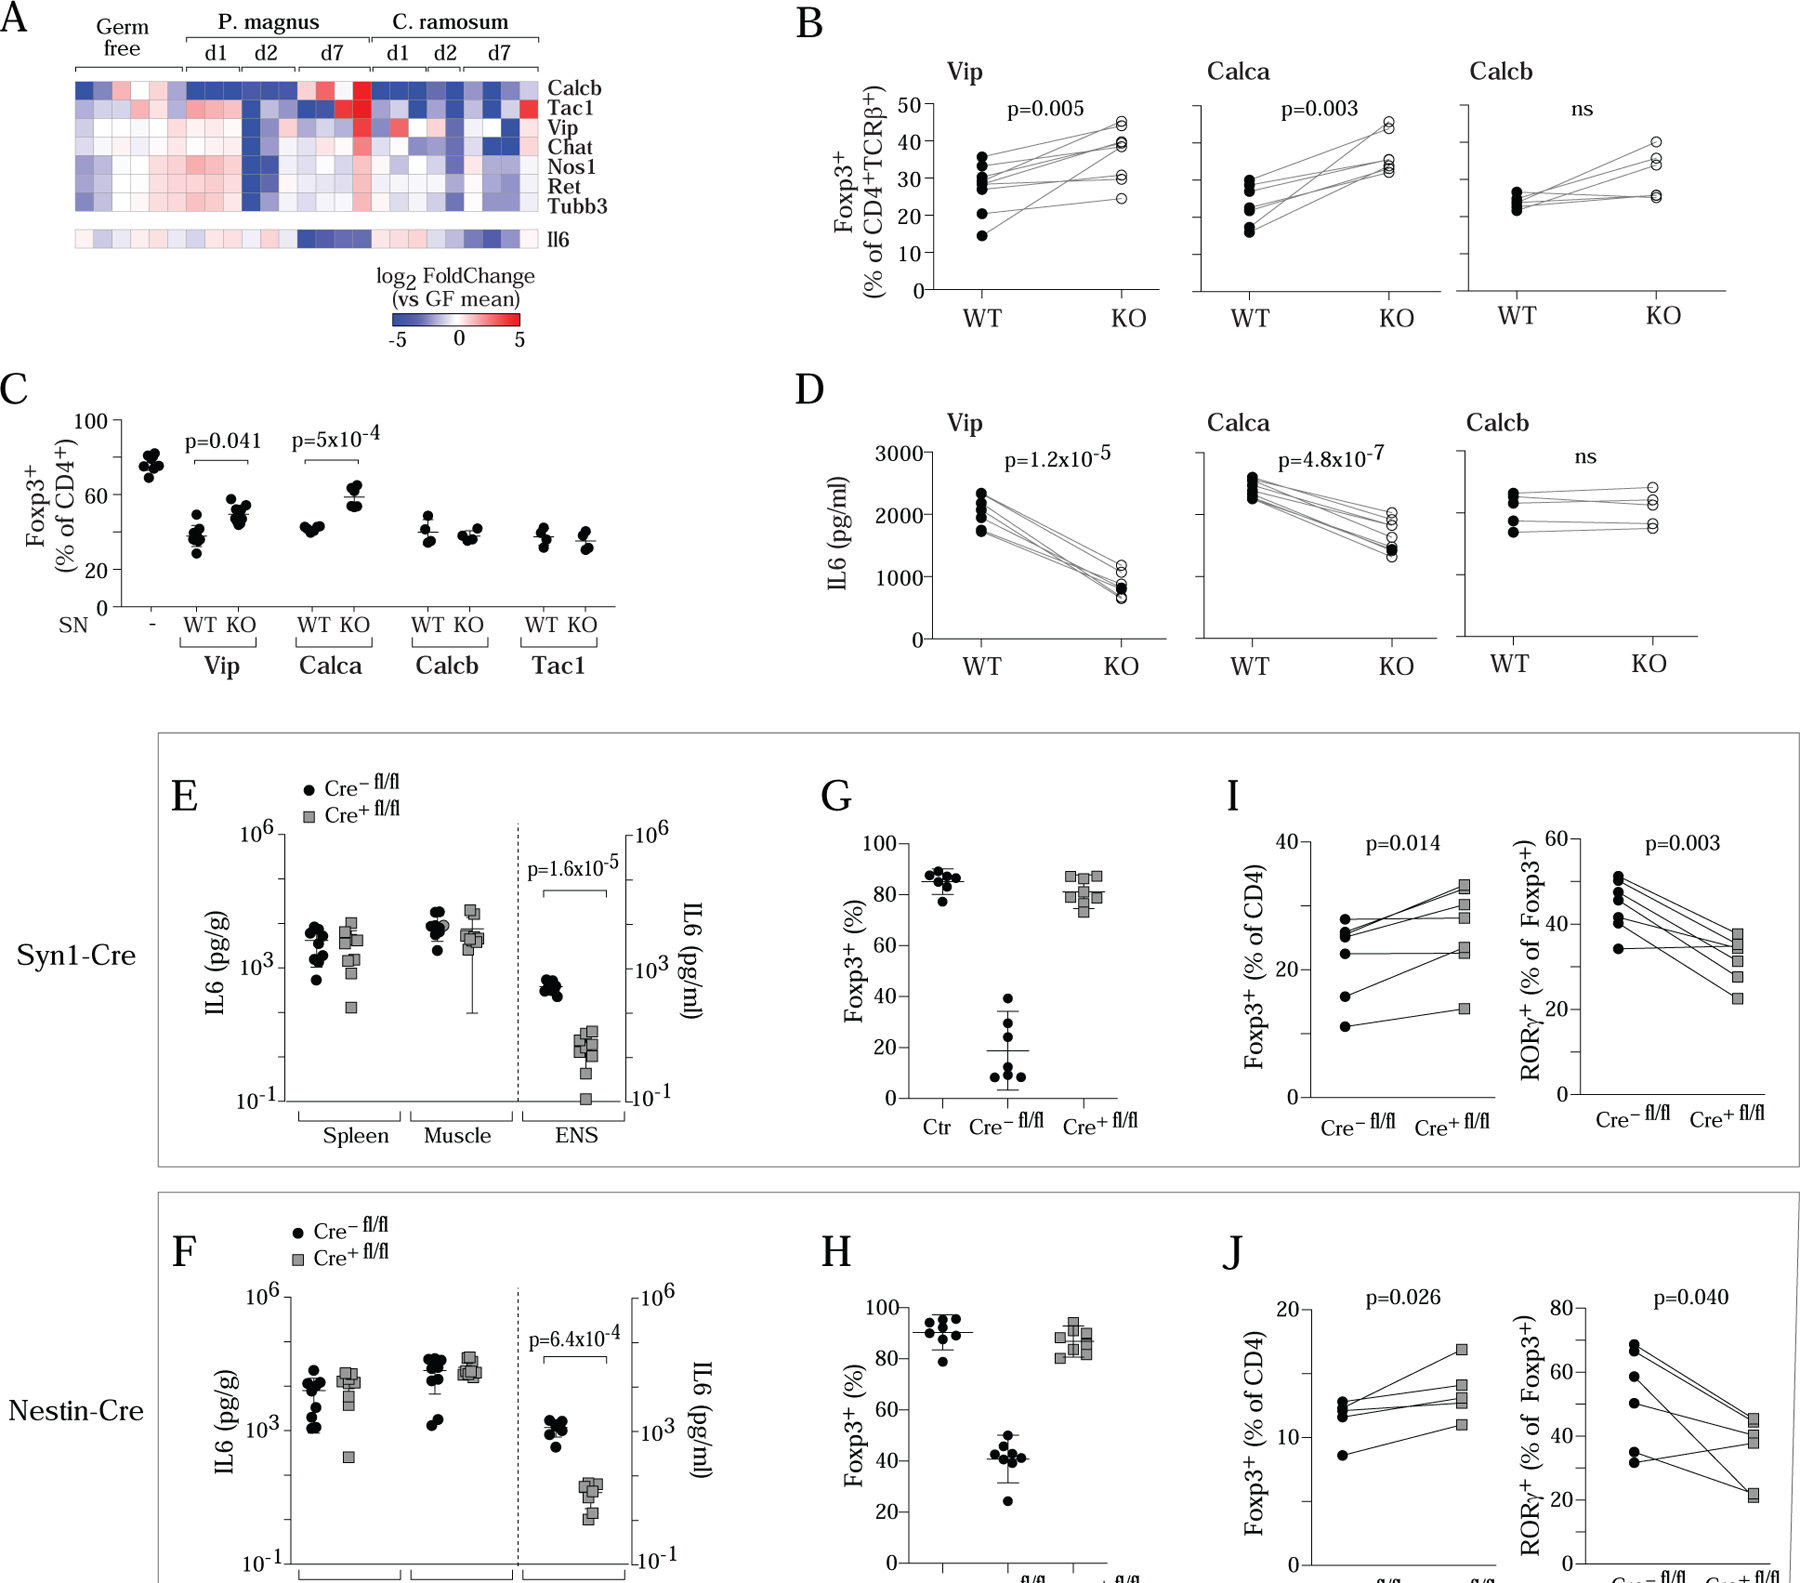
The immune and enteric nervous (ENS) systems monitor the frontier with commensal and pathogenic microbes in the colon. We investigated whether FoxP3+ regulatory T (Treg) cells functionally interact with the ENS. Indeed, microbe-responsive RORγ+ and Helios+ subsets localized in close apposition to nitrergic and peptidergic nerve fibers in the colon lamina propria (LP). Enteric neurons inhibited in vitro Treg (iTreg) differentiation in a cell-contact-independent manner. A screen of neuron-secreted factors revealed a role for interleukin-6 (IL-6) in modulating iTreg formation and their RORγ+ proportion. Colonization of germfree mice with commensals, especially RORγ+ Treg inducers, broadly diminished colon neuronal density. Closing the triangle, conditional ablation of IL-6 in neurons increased total Treg cells but decreased the RORγ+ subset, as did depletion of two ENS neurotransmitters. Our findings suggest a regulatory circuit wherein microbial signals condition neuronal density and activation, thus tuning Treg cell generation and immunological tolerance in the gut.

Keywords: Treg-neuron interactions; gut-brain axis; neuro-immune interactions; regulatory T cells.


Conflict of interest statement

Declaration of interests The authors declare no competing interests.

Figures

Figure 1.
Figure 1.. Colonic Treg cells localize closely to neurons
A. Schematic of the ENS in the colon. B. Confocal images of colon cryosections from Foxp3-gfp reporter mice, immunostained for Tuj1 (white), GFP (green) and EpCAM (red). Arrows: GFP+ Treg cells scatted in the lamina propria. C-D. Cleared whole-mount of the ENS in colon segments from Foxp3-gfp mice, stained for Tuj1 (white) and GFP (green). C: Z stacks images (0.5 μm) in the lamina propria, max projection to 5 mm total thickness; D: 35 mm max projections in the myenteric plexus. E-F. Confocal images of colon cryosections from Foxp3-gfp reporter mice, immunostained for Tuj1 (green), CGRP or NOS1 (red), with DAPI nuclear stain. G. smFISH of Foxp3 mRNAs (red dots) and Rorc mRNAs (green dots), counterstained with DAPI (blue, nuclei) and anti-Tuj1 (gray). Examples of Foxp3+Rorc (i, ii) and Foxp3+Rorc+ (iii, iv) cells in close vicinity to nerve fibers. Images are max projections of 6 stacks (each 0.3 μm apart) for i,iii and 9 stacks for ii,iv. H. Quantification, from smFISH such as G, of the distances to the closest Tuj1+ cell for 13 Foxp3+Rorc+ and 21 Foxp3+Rorc cells (p=ns). All data (A-H) representative of 3 independent experiments.
Figure 2.
Figure 2.. Enteric neurons inhibit iTreg induction
A. ENS neurons from colon MMP were adapted to culture, then co-cultured along with CD4+ T cells in 72 hr iTreg induction cultures, and the effect on induction of FoxP3 assessed by flow cytometry. Left: representative histograms; right: quantitation of FoxP3+ iTregs in the cultures. Each dot is an independent culture, composite of 3 experiments. Here and thereafter: *: p<0.05; **: p<0.01; ***: p<0.001; **** p<10−4 from unpaired Student’s t.test unless otherwise specified. Error bars mean ±SD. B. As A, where MMP neurons were cultured for indicated times before addition to iTreg induction cultures. Composite of 3 experiments. C. Confocal imaging of MMP neuron cultures immunostained for Tuj1, EpCAM (epithelial cells), CD45 (hematopoietic cells) and DAPI (nuclei). Representative of 2 or more fields in 3 independent cultures. D. CD45+, CD49b+ and CD45CD49b cell fractions were sorted from dissociated colon MMP (left) and their ability to inhibit iTreg induction tested as in A. Composite of 3 experiments. E. As in A, inhibitory cells tested were CD45+ hematopoietic cells or Ret+ neurons from the MMP of Ret-gfp reporter mice. Composite of 3 experiments. F. As in A, inhibitory cells tested were cultured primary neurons from the MMP, embryonic brain or DRG. Composite of 3 experiments.
Figure 3.
Figure 3.. Enteric neurons inhibit iTregs through cytokine-like large soluble factors
A. Frequency of Foxp3+ cells in 72 hr iTreg induction cultures, supplemented with neurons in direct contact or separated in a Transwell chamber. Each dot is an independent culture, composite of 3 experiments. B. As in A, cultures supplemented with increasing dose of supernatant from 5 day cultures of primary MMP neurons. Composite of 2 experiments. C. As in B, cultures supplemented with varying doses of neuromediators. Composite of 4 experiments. See Fig. S3 for detailed titration curves. D. As in B, cultures supplemented with fractions from molecular weight cutoff filtration. Composite of 3 experiments. E. Representative flow cytometry sorting gates for 72 hr iTreg cultures, alone or supplemented with neurons. F. RNAseq profiling of cells shown in E. Left: changes in gene expression induced by the presence of neurons, shown on a “FoldChange/FoldChange” plot, relating in GFP+ iTregs and in non-converted GFP cells. Right: FoldChange vs p.value “Volcano plot” showing the significance of neuron-induced changes in Foxp3-GFP and Foxp3-GFP+ cells. Transcripts up- or down-regulated in T cells by MMP neurons in both cell states (at FC>2 and p.value<0.01) are highlighted (red and green). G. Heatmap of changes in the geneset selected in F (log2 of FoldChange relative to the mean of controls, calculated independently for Foxp3GFP+ and Foxp3GFP cells; each column is a biological replicate. H. Pathway and GeneOntology analysis of the up-regulated transcripts in the signature from F.
Figure 4.
Figure 4.. Enteric neurons inhibit iTreg induction through IL6 pathway
A. Gene expression results from the neuron/iTreg co-culture from 3E, representing expression values of transcripts encoding large secreted molecules by MMP neurons (left) and surface receptors by T cells (right). Interaction pairs are indicated. Each column is a biological replicate. B. Expressions of candidate ligands identified in A in different types of enteric neurons defined by (Zeisel et al., 2018) (picture generated at www.mousebrain.org). C. The frequency of FoxP3+ cells was assessed in 72 hr iTreg cultures supplemented from the start with enteric neuron SN, alone or with antibodies (5 ug/ml) against the candidate cytokines identified in B. Each dot is an independent culture, composite of 4 experiments. D. IL6 levels (ELISA) in neuronal SN after different times in culture. Each dot is an independent culture, composite of 2 experiments. E. IL6 levels (ELISA) in SN of sorted RET+ and CD45+ populations cultured for 5–7 days. Each dot is an independent culture, composite of 3 experiments. F. Frequency of Foxp3 in iTreg cultures supplemented with neuronal SN from Il6−/− or control littermates. Each dot is an independent culture, composite of 3 experiments. G. Frequency of Foxp3 in iTreg cultures with Il6ra-deficient CD4+ T cells (from Cd4-Cre Il6rafl/fl mice) or control littermates supplemented with neuronal SN. Each dot is an independent culture, composite of 3 experiments. H. As G, with input T cells from Stat3 deficient mice or control littermates. Composite of 3 experiments.
Figure 5.
Figure 5.. Enteric neurons modulate RORγ+ Treg induction through IL6
A. Representative flow cytometry profiles after 72 hrs of iTreg cultures (soluble αCD3 + splenic APCs) stained for FoxP3 and RORγ. Each dot is an independent culture. Plot at right compiled from 3 independent experiments. B. Comparison of MMP neuron SN and recombinant IL6. Top panels: iTreg cultures (soluble αCD3 + splenic APCs) supplemented with titrated neuronal SN in which IL6 concentration had been pre-determined by ELISA. Bottom panels: parallel cultures supplemented with matching concentrations of rIL6 (after ELISA determination). Representative of two independent experiments. C. Data from B, plotting numbers of RORγ+ and RORγ- Treg cells in iTreg cultures (soluble αCD3 + splenic APCs) supplemented with titrated amounts of neuron supernatant or recombinant IL6. Each dot is the average value of 2 or more independent preparations, plot compiled from 2 independent experiments. D. Representative flow cytometry profiles of iTreg cultures (soluble αCD3 + splenic APCs) supplemented with MMP neuronal SN and anti-IL6 (Each dot is an independent culture, compiled data from 3 independent experiments plotted at right). E. As D, where the neuron culture SN was from Il6-deficient mice or control littermates. (Compiled data from 3 independent experiments plotted at right).
Figure 6.
Figure 6.. Commensal microbes affect neurons and their phenotypes
A. Whole-mount staining and quantification of the myenteric plexus in colon segments in GF, C. ramosum- or P. magnus-monocolonized mice, immunostained for Tuj1 (neuronal bodies and fibers, green) and HuC/D (neuron cell bodies, red). Images are max projections of 50–100 stacks (each 0.5 μm apart). Images representative of 4 independent experiments, and 5 or more monocolonized mice. B. Quantitation (Imaris software) of neuronal body (left) and fiber (right) densities in myenteric plexus from images as in A. Each dot represents a mouse, composite from 4 imaging experiments. C. Whole-mount immunostaining as in A, but focused on projections in the lamina propria. D. Quantitation of fiber density in images as in C. E. GF mice were mono-colonized with C. ramosum or P. magnus for 1 day, and RNA was prepared from whole MMP (neuronal and muscle layers) for RNAseq profiling. Left: changes in gene expression induced by C. ramosum vs GF controls, with characteristic neuronal transcripts highlighted. Right: heatmap representation of changes (log2) vs mean of GF controls, in all replicates. F. Gating strategy to sort MMP neurons (CD45Sca1CD9hi) from C.ramosum or P.magnus mono-colonized GF mice for RNAseq. Bottom panels displayed RET-GFP expression in MMP from Ret GFP/+ mice used to establish the strategy then applied to wild-type GF mice. G. Changes in gene expression in sorted neurons (gated as in F) for transcripts of the major co- regulated cluster, at different times after mono-colonization with P.magnus and C. Ramosum. (log2 of FoldChange relative to the mean of GF; clustered by gene-gene correlation within the cluster; each column represents a different mouse). Hallmark neuronal genes indicated. H. Differential expression across enteric neurons of the cluster of genes affected by bacterial colonization. Upper panel: single-cell RNAseq of small intestinal ENS from (Zeisel et al., 2018), neurons clustered and positioned using tSNE coordinates from that study. Middle panel: normalized expression index for the microbe-responsive cluster (genes from G, expression of each gene normalized to its mean expression across all cells, then all genes summed for each cell) on those cells. Lower panel: superimposition of Il6- positive cells on the same tSNE.
Figure 7.
Figure 7.. Genetic or microbial changes in neuronal IL6 affect Treg differentiation in vivo
A. Expression of Il6 in sorted neurons during the monocolonization time-course experiment of Fig. 6G. Neurotransmitter transcripts repeated for reference. B. Frequency of colonic Treg cells within CD4+ T cells in Vip−/−, Calca−/−, Calcb−/− mice or control littermates. C. iTreg induction cultures were supplemented with neuronal SN (25%) produced by cultured MMP from Vip−/−, Calca−/−, Calcb−/− or Tac1−/− mice or their wild-type littermates. Each dot is an independent culture, composite of 3 experiments. D. IL6 levels (ELISA) in neuronal SN from Vip−/−, Calca−/−, or Calcb−/−or their wild type littermates. E,F. IL6 levels in MMP neuronal SN from Syn1-CreIl6fl/fl (E) and Nestin-CreIl6fl/fl (F) or their control littermates (mostly cre-negative). LPS-stimulated (100ng/ml, overnight) whole spleen or muscle cultures used as a control. G,H. MMP neurons from Syn1-CreIl6fl/fl (G) and Nestin-CreIl6fl/fl (H) or their wild type littermates were adapted to culture, then co-cultured along with CD4+ T cells in 72 hr iTreg induction cultures, and the effect on induction of FoxP3 assessed by flow cytometry. Each dot is an independent culture, composite of 3 or more experiments. I,J. Frequency of colonic Treg cells and RORγ+Treg cells within CD4+ T cells in Syn1-CreIl6fl/fl (I) and Nestin-CreIl6fl/fl (J) or wild-type control littermates. Throughout, each dot represents an individual mouse unless mentioned, p-value from paired Student’s t test.

Comment in

References

    1. Al Nabhani Z, Dulauroy S, Marques R, Cousu C, Al BS, Dejardin F, Sparwasser T, Berard M, Cerf-Bensussan N, and Eberl G (2019). A weaning reaction to microbiota is required for resistance to immunopathologies in the adult. Immunity 50, 1276–1288. - PubMed
    1. Arpaia N, Campbell C, Fan X, Dikiy S, van d. V, Deroos P, Liu H, Cross JR, Pfeffer K, Coffer PJ et al. (2013). Metabolites produced by commensal bacteria promote peripheral regulatory T-cell generation. Nature 504, 451–455. - PMC - PubMed
    1. Atarashi K, Tanoue T, Shima T, Imaoka A, Kuwahara T, Momose Y, Cheng G, Yamasaki S, Saito T, Ohba Y et al. (2011). Induction of colonic regulatory T cells by indigenous Clostridium species. Science 331, 337–341. - PMC - PubMed
    1. Bettelli E, Carrier Y, Gao W, Korn T, Strom TB, Oukka M, Weiner HL, and Kuchroo VK (2006). Reciprocal developmental pathways for the generation of pathogenic effector TH17 and regulatory T cells. Nature 441, 235–238. - PubMed
    1. Cardoso V, Chesne J, Ribeiro H, Garcia-Cassani B, Carvalho T, Bouchery T, Shah K, Barbosa-Morais NL, Harris N, and Veiga-Fernandes H (2017). Neuronal regulation of type 2 innate lymphoid cells via neuromedin U. Nature 549, 277–281. - PMC - PubMed

Publication types

MeSH terms

Substances