. 2021 Apr 15;184(8):2229-2238.e13.
doi: 10.1016/j.cell.2021.02.044. Epub 2021 Feb 23.

A trans-complementation system for SARS-CoV-2 recapitulates authentic viral replication without virulence

Affiliations

A trans-complementation system for SARS-CoV-2 recapitulates authentic viral replication without virulence

Xianwen Zhang et al. Cell. .

Abstract

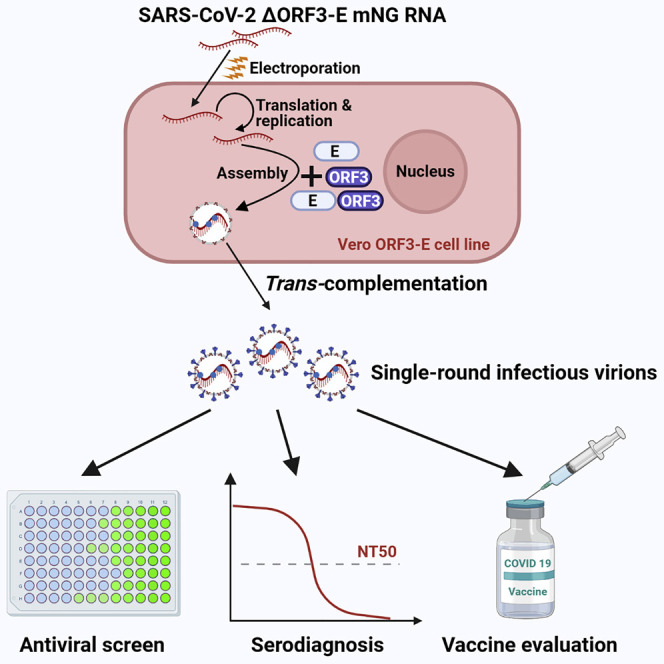
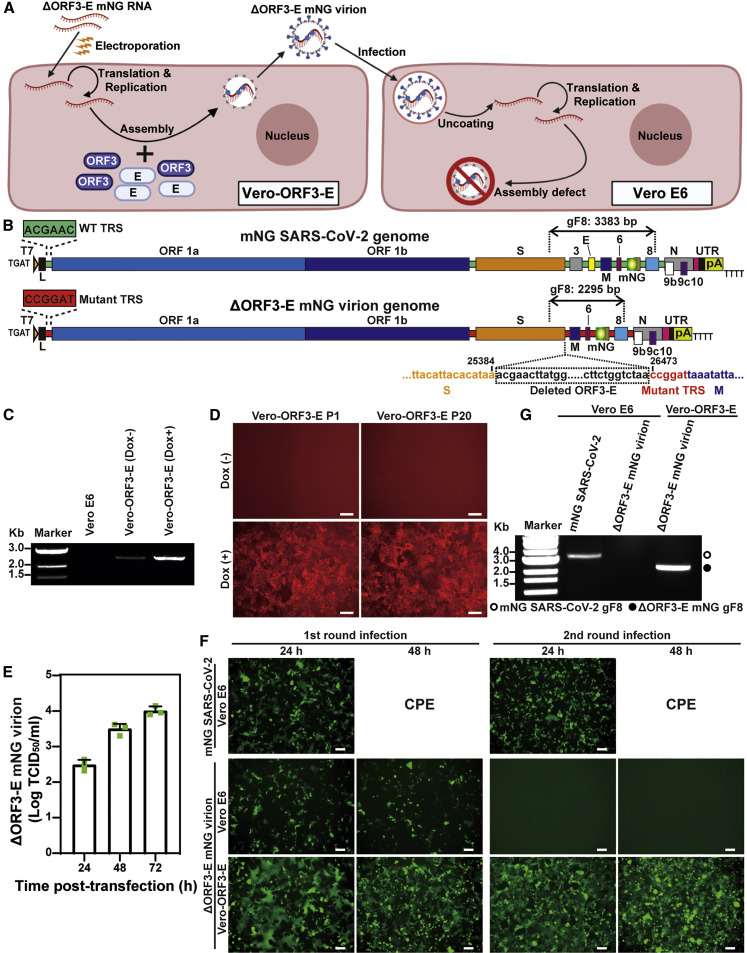
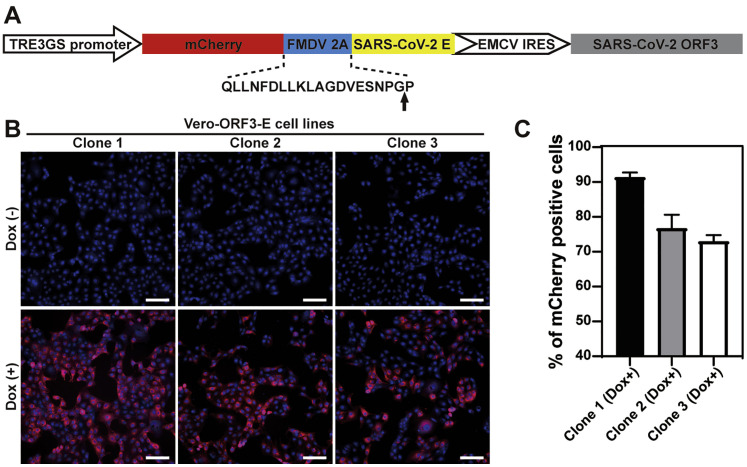
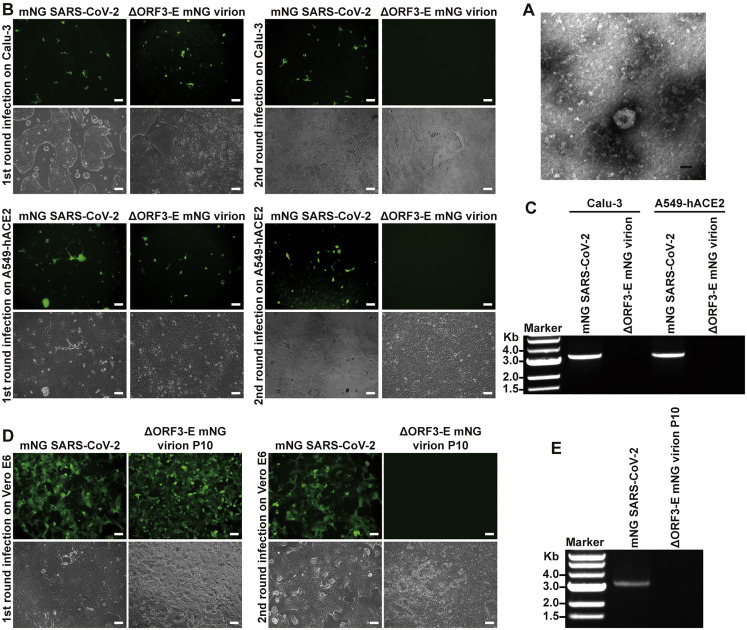
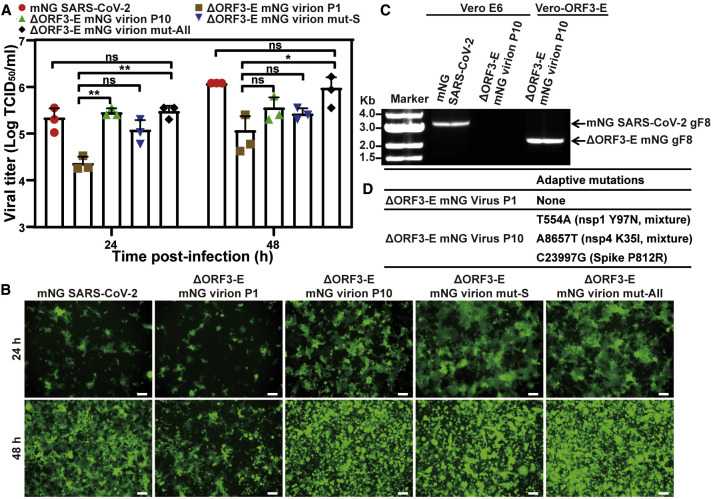
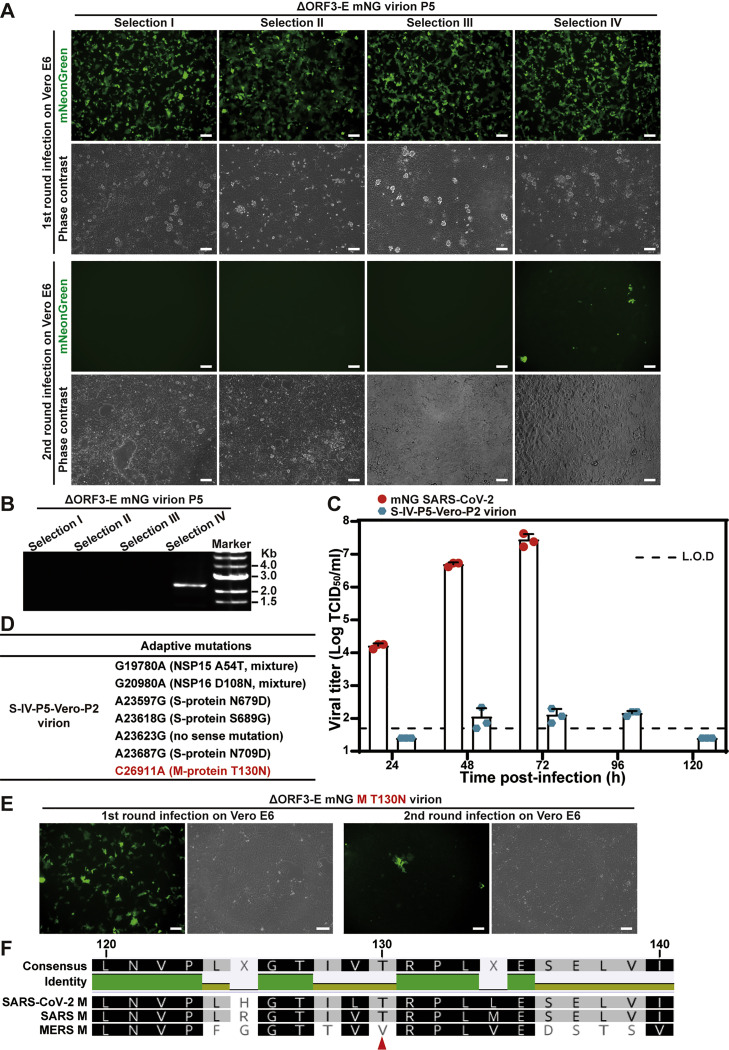
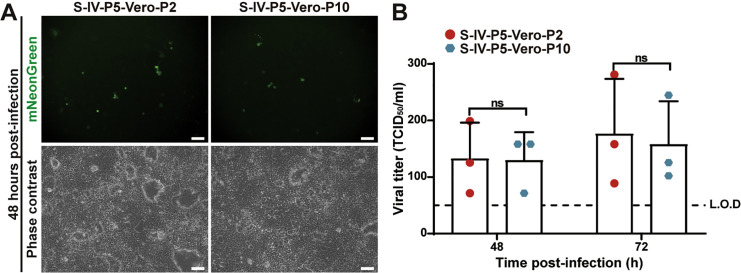
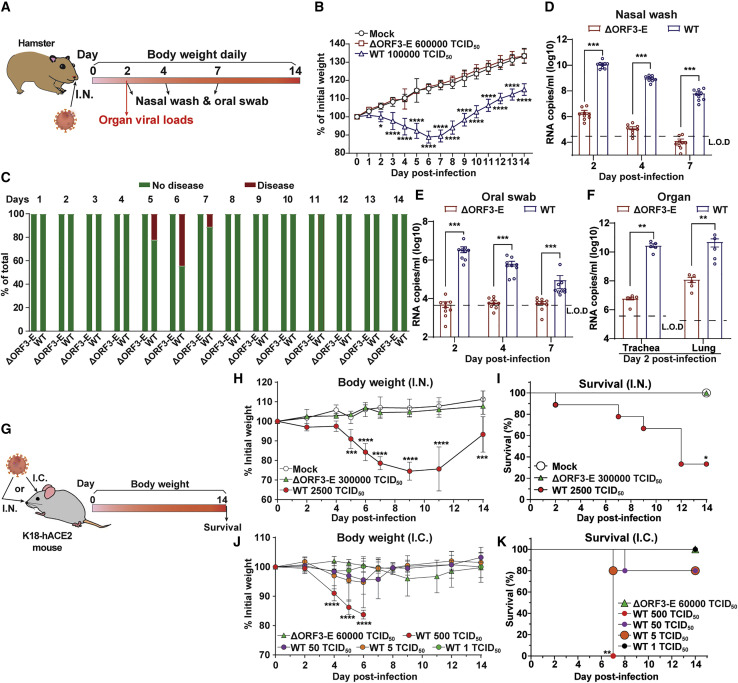
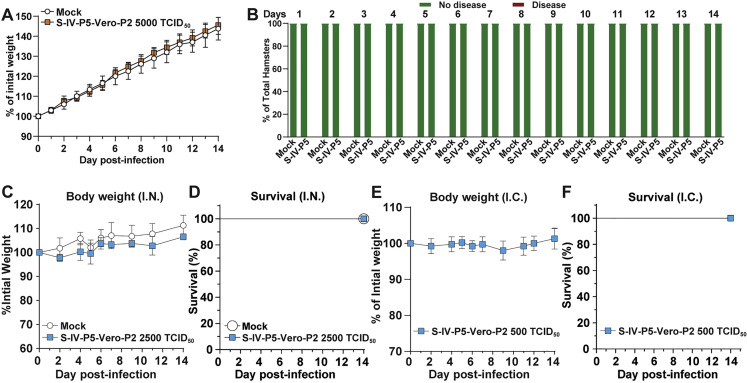
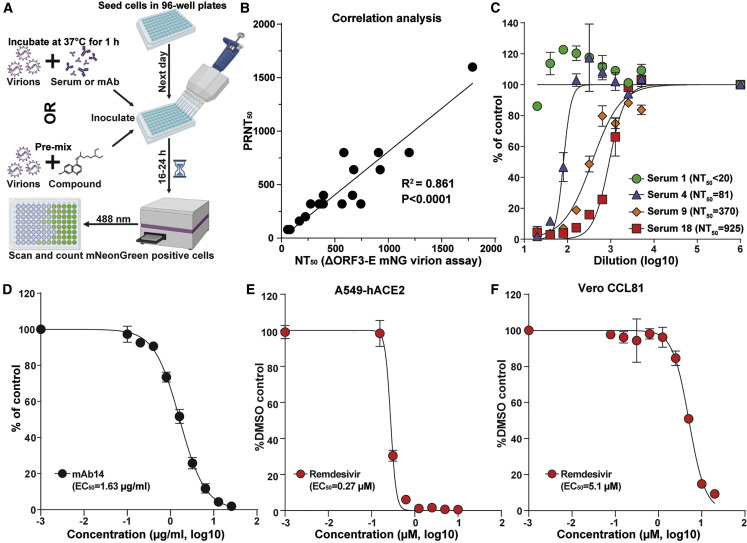
The biosafety level 3 (BSL-3) requirement to culture severe acute respiratory syndrome coronavirus 2 (SARS-CoV-2) is a bottleneck for research. Here, we report a trans-complementation system that produces single-round infectious SARS-CoV-2 that recapitulates authentic viral replication. We demonstrate that the single-round infectious SARS-CoV-2 can be used at BSL-2 laboratories for high-throughput neutralization and antiviral testing. The trans-complementation system consists of two components: a genomic viral RNA containing ORF3 and envelope gene deletions, as well as mutated transcriptional regulator sequences, and a producer cell line expressing the two deleted genes. Trans-complementation of the two components generates virions that can infect naive cells for only one round but does not produce wild-type SARS-CoV-2. Hamsters and K18-hACE2 transgenic mice inoculated with the complementation-derived virions exhibited no detectable disease, even after intracranial inoculation with the highest possible dose. Thus, the trans-complementation platform can be safely used at BSL-2 laboratories for research and countermeasure development.

Keywords: COVID-19; SARS-CoV-2; antiviral; coronavirus; diagnosis; vaccine.


Conflict of interest statement

Declaration of interests X.Z., X.X., and P.-Y.S. have filed a patent on the trans-complementation system of SARS-CoV-2. M.S.D. is a consultant for Inbios, Vir Biotechnology, NGM Biopharmaceuticals, and Carnival Corporation and on the Scientific Advisory Boards of Moderna and Immunome. The Diamond laboratory has received unrelated funding support in sponsored research agreements from Moderna, Vir Biotechnology, and Emergent BioSolutions.

Figures

None
Graphical abstract
Figure 1
Figure 1
Generation of single-round infectious ΔORF3-E mNG virion (A) A trans-complementation system for SARS-CoV-2. Vero-ORF3-E cells are electroporated with ΔORF3-E mNG RNA. Trans-complementation produces ΔORF3-E mNG virion (left panel), which can infect naive Vero E6 cells for only single round (right panel). (B) ΔORF3-E mNG virion genome. Both the full-length mNG SARS-CoV-2 genome (top panel) and the ΔORF3-E mNG virion genome (bottom panel) are shown. The genomic fragment 8 (gF8) of reverse transcription PCR (RT-PCR) analysis is indicated above both genomes. The ORF3-E deletion junction is indicated. The WT (green box) and mutant (red box) transcription regulatory sequences (TRSs) are also depicted. The mutated TRS (red) is also engineered at the 5′ end of each of the downstream ORFs. (C) ORF3-E RNA expression in Vero-ORF3-E cells. Doxycycline (Dox) was used to induce the expression of ORF3-E RNA. RT-PCR analyses were performed on Vero-ORF3-E cells with or without Dox induction as well as on naive Vero E6 cells. (D) Induction of mCherry expression in Vero-ORF3-E cells. Passage 1 (P1) and 20 (P20) of Vero-ORF3-E cells were induced by Dox to express mCherry fluorescence. Scale bar, 100 μm. (E) Production of ΔORF3-E mNG virion after electroporation. After electroporating ΔORF3-E mNG RNA into Vero-ORF3-E cells (with Dox), infectious titers of ΔORF3-E mNG virion were measured by infecting Vero-ORF3-E cells. Three sets of repeated experiments are presented with bars representing standard deviations. (F) Analysis of ΔORF3-E mNG virion infection. Vero E6 or Vero-ORF3-E cells were incubated with WT mNG SARS-CoV-2 or ΔORF3-E mNG virion for 2 h. The cells were washed three times with PBS to remove residual input virus. At 48 h post-infection, the supernatants of the infected cells were transferred to fresh Vero E6 or Vero-ORF3-E cells for a second round of infection. The mNG signals from both rounds of infected cells are presented. Scale bar, 100 μm. (G) RT-PCR analysis. Extracellular RNA from the second-round infection from (F) was harvested at 48 h post-infection. Fragment 8 of the viral genome, depicted in (B), was amplified by RT-PCR to confirm the ORF3-E deletion and mNG retention.
Figure S1
Figure S1
Construction of Vero-ORF3-E cell lines, related to Figure 1 (A) Construction of a lentiviral transfer plasmid encoding mCherry, ORF3, and E protein. The sequence of FMDV 2A and its translational break position is indicated by an arrow. (B) Merged mCherry (red) and nuclei (blue) images of 3 selected clones of Vero-ORF3-E cell lines. Nuclei were stained with Hoechst 33342. Doxycycline induction is indicated. Scale bar, 100 μm. (C) mCherry expression in doxycycline-induced cells. mCherry-positive cells were quantified using a plate reader. The percentages of mCherry positive cells are presented. The results are presented as means ± standard deviations from six replicates, and more than 105 cells were counted for each clone. Clone 1 was used in the rest of this study.
Figure S2
Figure S2
Single-round infection of ΔORF3-E mNG virion, related to Figure 1 (A) Negative-staining electron microscopic image of ΔORF3-E mNG virion. Scale bar, 50 nm. (B) Calu-3 and A549-hACE2 cells (MOI of 1 and 10 for mNG SARS-CoV-2 and ΔORF3-E mNG virion, respectively; viral titers determined on Vero-ORF3-E cells) were infected with mNG SARS-CoV-2 or ΔORF3-E mNG virion for 2 h, after which the cells were washed and cultured in fresh medium. At day 2 post-infection, supernatants of the infected cells were transferred to infect naive Calu-3 and A549-hACE2 for the second round. Fluorescence and phase contrast images for the infected cells are presented. Scale bar, 100 μm. (C) RT-PCR analysis of viral RNA. Extracellular RNAs from the second round of infection from (B) were harvested at day 2 post-infection and subjected to RT-PCR analysis of viral RNA. (D) WT mNG SARS-CoV-2 and P10 ΔORF3-E mNG virion (derived from 10 rounds of passaging of ΔORF3-E mNG virion on Vero-ORF3-E cells) were used to infect Vero E6 cells for two rounds as described in Figure 1F. Fluorescence and phase contrast images of infected cells are presented for both the first and second rounds of infections. Scale bar, 100 μm. (E) RT-PCR analysis of viral RNA extracted from the culture fluids from the second-round infected cells in (D).
Figure 2
Figure 2
Adaptive mutations to improve the yield of ΔORF3-E mNG virion production (A) Viral replication kinetics on Vero-ORF3-E cells. Adaptive mutations (D) were selected by continuously passaging the ΔORF3-E virion on Vero-ORF3-E cells for 10 rounds. For comparing the replication kinetics of the passaged viruses, Vero-ORF3-E cells were infected with the P1 or P10 ΔORF3-E virion, ΔORF3-E virion containing an S mutation in (D) (ΔORF3-E virion mut-S), or ΔORF3-E virion containing all adaptive mutations in nsp1, nsp4, and S in (D) (ΔORF3-E virion mut-All) at an MOI of 0.15. WT mNG SARS-CoV-2 was included as a control. Viral titers in culture supernatants are presented. ANOVA with multiple comparison correction test were performed with p < 0.05; ∗∗p < 0.01. Data are represented as mean ± standard deviation. (B) mNG-positive cells at 24 and 48 h post-infection from (A). Scale bar, 100 μm. (C) RT-PCR analysis for single-round infection. For confirming the P10 ΔORF3-E virion remains infectious for only a single round on Vero cells, Vero E6 or Vero-ORF3-E cells were infected with WT mNG SARS-CoV-2 or P10 ΔORF3-E mNG virion for two rounds as described in Figure 1G. Viral RNAs were extracted from the second-round culture fluids and analyzed by RT-PCR. The RT-PCR product, gF8, is indicated in Figure 1B. (D) Adaptive mutations. Three mutations were identified from whole-genome sequencing of P10 ΔORF3-E mNG virion. No mutation was found in the P1 ΔORF3-E mNG virion.
Figure S3
Figure S3
Selection of ΔORF3-E mNG virion capable of inefficiently infecting Vero E6 cells for more than one round, related to Figure 2 Four independently selected P5 ΔORF3-E mNG virions (generated from five rounds of passaging ΔORF3-E mNG virion on Vero-ORF3-E cells) were used to infect naive Vero E6 cells for two rounds as described in Figure 1F. (A) The P5 ΔORF3-E mNG virion-infected Vero E6 cells were analyzed for mNG signals. Scale bar, 100 μm. (B) The extracellular RNA from the second-round infected cells were examined for viral RNA by RT-PCR. (C) Selection IV P5 ΔORF3-E (S-IV-P5) mNG virion could infect Vero cells for multiple rounds. To remove the single-round virion from the multi-round virion in the S-IV-P5 stock, the S-IV-P5 stock was passaged on Vero E6 cells for two rounds, resulting in S-IV-P5-Vero-P2 virion capable of multi-round infection. The replication kinetics of WT mNG SARS-CoV-2 and S-IV-P5-Vero-P2 mNG virion were compared on Vero E6 cells. The cells were inoculated at an MOI of 0.001. Limit of detection, L.O.D. Data are represented as mean ± SD. (D) Adaptive mutations were identified from the S-IV-P5-Vero-P2 mNG virion. (E) The T130N mutation from the M protein was engineered into ΔORF3-E mNG virion. The resulting ΔORF3-E mNG M T130N virion was used to infect Vero E6 cells for two rounds. Fluorescence and phase contrast images of the infected cells are shown. Scale bar, 100 μm. (F) Sequence alignment shows that the M proteins from SARS-CoV and SARS-CoV-2 share the same T130 residue. Red arrow indicates the T130 residue of SARS-CoV-2.
Figure S4
Figure S4
No improvement of viral replication of selection IV ΔORF3-E (S-IV-P5) mNG virion after 10 rounds of culturing on Vero E6 cells, related to Figure 2 S-IV-P5 mNG virion was continuously passaged on Vero E6 cells for 10 rounds. The resulting P2 and P10 S-IV-P5 mNG virions (i.e., S-IV-P5-Vero-P2 and S-IV-P5-Vero-P10, respectively) were used to infect Vero E6 cells at an MOI of 0.001. The mNG-positive cells (A) and the growth kinetics of the S-IV-P5-Vero-P2 and S-IV-P5-Vero-P10 virions (B) were compared. Scale bar, 100 μm. We did not use the S-IV-P5-Vero-P1 virion in this experiment because the P1 stock retained some carryover virions derived from the Vero-ORF3-E trans-complementation culture. Viral titers were analyzed by unpaired t test. ns, p > 0.05. Data are represented as mean ± SD.
Figure 3
Figure 3
Safety characterization of ΔORF3-E mNG virion in animal models (A) Hamster experimental schedule. Four- to five-week-old male Syrian golden hamsters were intranasally (I.N.) inoculated with 105 TCID50 of WT SARS-CoV-2, 6 × 10⁵ TCID50 of ΔORF3-E mNG virion, or PBS mock control. Hamsters were monitored for weight loss, disease, and viral RNA level. (B) Hamster weight change (n = 9). (C) Hamster disease (n = 9). (D) Hamster nasal wash viral RNA level (n = 9). (E) Hamster oral swab viral RNA level (n = 9). (F) Viral RNA loads in hamster trachea and lung at day 2 post-infection (n = 5). Limit of detection (L.O.D.) was defined as the RNA copies detected from mock-infected hamster samples. The weight loss data are shown as mean ± standard deviation and statistically analyzed using two-way ANOVA Turkey’s multiple comparison. The genomic RNA levels are presented as mean ± standard error of the mean and analyzed by Mann-Whitney test. p < 0.05; ∗∗p < 0.01; ∗∗∗p < 0.001; ∗∗∗∗p < 0.0001. (G–K) Mouse experimental schedule. Seven- to nine-week-old K18-hACE2 mice were inoculated with WT SARS-CoV-2 or ΔORF3-E mNG virion via the I.N. or intracranial (I.C.) route. Mouse weight loss after I.N. (H) or I.C. (J) infection. Body weights were normalized to the initial weight. The means for each group (I.N.: WT SARS-CoV-2 [n = 9], ΔORF3-E mNG virion [n = 4], and mock [n = 4]; I.C.: WT SARS-CoV-2 500 TCID50 [n = 4], 50 TCID50 [n = 5], 5 TCID50 [n = 5], and 1 TCID50 [n = 5] and 6 × 10⁴ TCID50 ΔORF3-E mNG virus [n = 4]) are indicated, with error bars indicating the standard deviation. A mixed-model ANOVA using Dunnett’s test for multiple comparisons was used to evaluate the statistical significance among groups: p < 0.05; ∗∗p < 0.01; ∗∗∗p < 0.001; ∗∗∗∗p < 0.0001. Mouse survival after I.N. (I) and I.C. (K) inoculation was analyzed using the Gehan-Breslow-Wilcoxon test. Using groups with 100% survival as a comparator, a Bonferroni correction was applied manually to adjust the threshold for significance (indicated by ).
Figure S5
Figure S5
Safety characterization of S-IV-P5-Vero-P2 virion in hamsters and K18-hACE transgenic mice, related to Figure 3 (A and B) The weight change (A) and disease (B) of hamsters (n = 5) that were intranasally infected with 5,000 TCID50 of S-IV-P5-Vero-P2 virion. A high-titer stock of S-IV-P5-Vero-P2 virion used for this experiment was prepared by amplifying the virion on Vero-ORF3-E cells. (C) Mouse weight loss after I.N. infection. Mice were infected with 2,500 TCID50 of S-IV-P5-Vero-P2 virion (n = 4) or PBS mock (n = 4) via the I.N. route. The mean ± standard deviations are indicated. (D) Mouse survival after I.N. infection. (E) Mouse weight loss after I.C. infection. Mouse were inoculated with 500 TCID50 of S-IV-P5-Vero-P2 virion (n = 4) via the I.C. route. The mean ± standard deviations are indicated. (F) Mouse survival after I.C. infection. A high titer stock of S-IV-P5-Vero-P2 virion used for this experiment was prepared by amplifying the virion on Vero-ORF3-E cells.
Figure 4
Figure 4
ΔORF3-E mNG virion-based high-throughput neutralization and antiviral testing (A) Assay scheme in a 96-well format. (B) Correlation analysis of NT50 values between the ΔORF3-E mNG virion assay and plaque-reduction neutralization test (PRNT). The Pearson correlation coefficiency R2 and p values (two-tailed) are indicated. (C) Neutralization curves. Representative curves are presented for one negative and three positive sera. The means and standard deviations from two independent experiments are shown. (D) EC50 of human mAb14 against ΔORF3-E mNG virion infecting Vero CCL81 cells. The mean ± standard deviations from four independent experiments are indicated. (E) EC50 of Remdesivir against ΔORF3-E mNG virion infecting A549-hACE2 cells. (F) EC50 of Remdesivir against ΔORF3-E mNG virion on Vero CCL81 cells. For (E) and (F), the mean ± standard deviations from three independent experiments are indicated. The four-parameter dose-response curve was fitted using the nonlinear regression method.

Update of

References

    1. Almazán F., DeDiego M.L., Sola I., Zuñiga S., Nieto-Torres J.L., Marquez-Jurado S., Andrés G., Enjuanes L. Engineering a replication-competent, propagation-defective Middle East respiratory syndrome coronavirus as a vaccine candidate. MBio. 2013;4:e00650-e13. - PMC - PubMed
    1. Case J.B., Rothlauf P.W., Chen R.E., Liu Z., Zhao H., Kim A.S., Bloyet L.M., Zeng Q., Tahan S., Droit L., et al. Neutralizing Antibody and Soluble ACE2 Inhibition of a Replication-Competent VSV-SARS-CoV-2 and a Clinical Isolate of SARS-CoV-2. Cell Host Microbe. 2020;28:475–485.e5. - PMC - PubMed
    1. Castaño-Rodriguez C., Honrubia J.M., Gutiérrez-Álvarez J., DeDiego M.L., Nieto-Torres J.L., Jimenez-Guardeño J.M., Regla-Nava J.A., Fernandez-Delgado R., Verdia-Báguena C., Queralt-Martín M., et al. Role of Severe Acute Respiratory Syndrome Coronavirus Viroporins E, 3a, and 8a in Replication and Pathogenesis. MBio. 2018;9:e02325-17. - PMC - PubMed
    1. Chan J.F., Zhang A.J., Yuan S., Poon V.K., Chan C.C., Lee A.C., Chan W.M., Fan Z., Tsoi H.W., Wen L., et al. Simulation of the clinical and pathological manifestations of Coronavirus Disease 2019 (COVID-19) in golden Syrian hamster model: implications for disease pathogenesis and transmissibility. Clin. Infect. Dis. 2020;71:2428–2446. - PMC - PubMed
    1. Ge F., Luo Y., Liew P.X., Hung E. Derivation of a novel SARS-coronavirus replicon cell line and its application for anti-SARS drug screening. Virology. 2007;360:150–158. - PMC - PubMed

Publication types