. 2021 Apr 1;184(7):1804-1820.e16.
doi: 10.1016/j.cell.2021.02.026. Epub 2021 Feb 12.

Human neutralizing antibodies against SARS-CoV-2 require intact Fc effector functions for optimal therapeutic protection

Affiliations

Human neutralizing antibodies against SARS-CoV-2 require intact Fc effector functions for optimal therapeutic protection

Emma S Winkler et al. Cell. .

Abstract

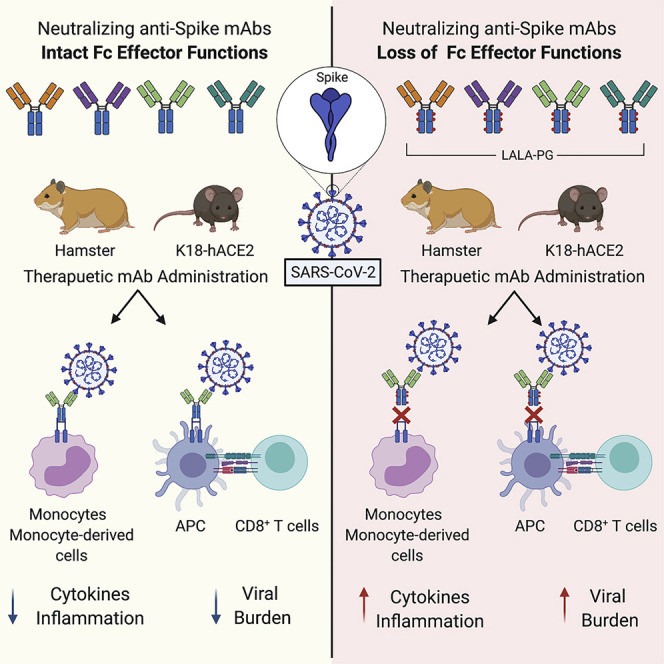
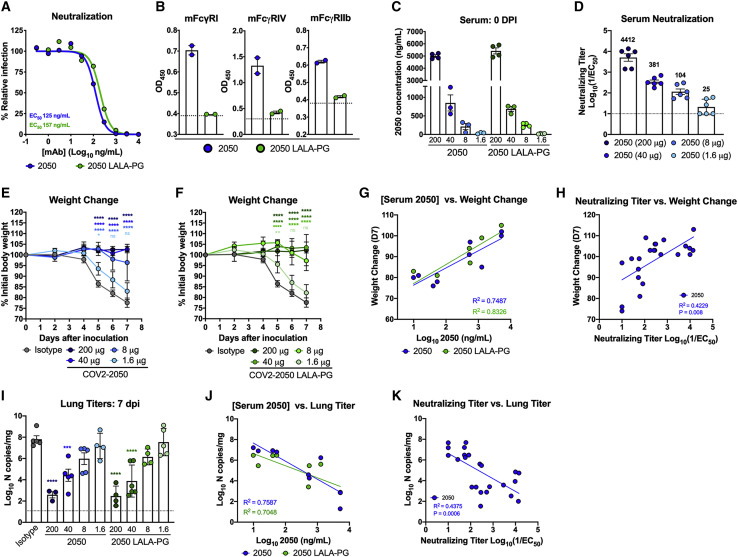
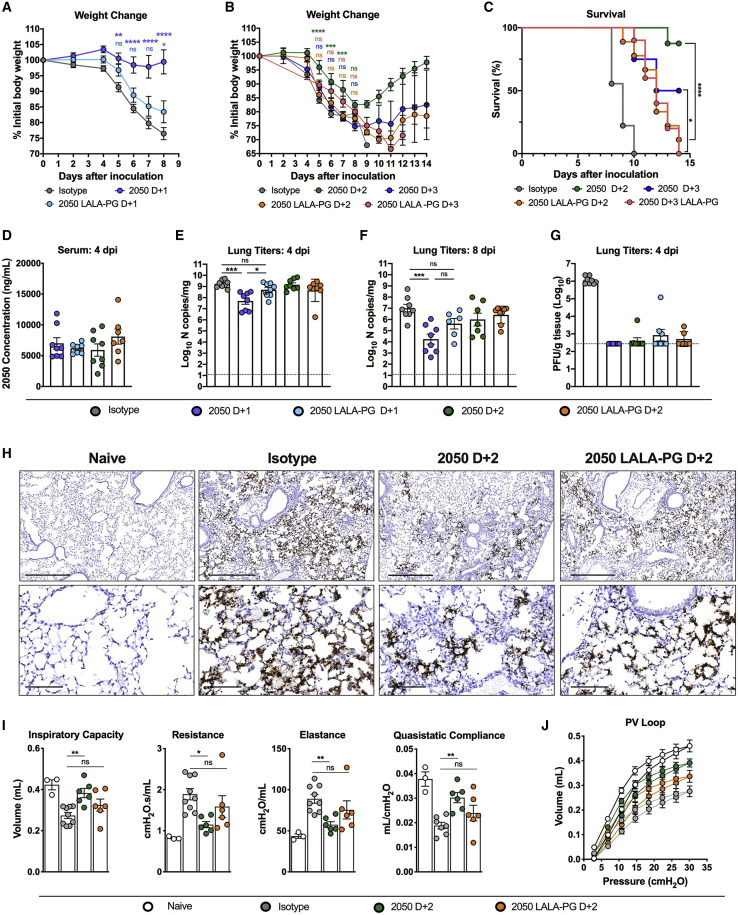
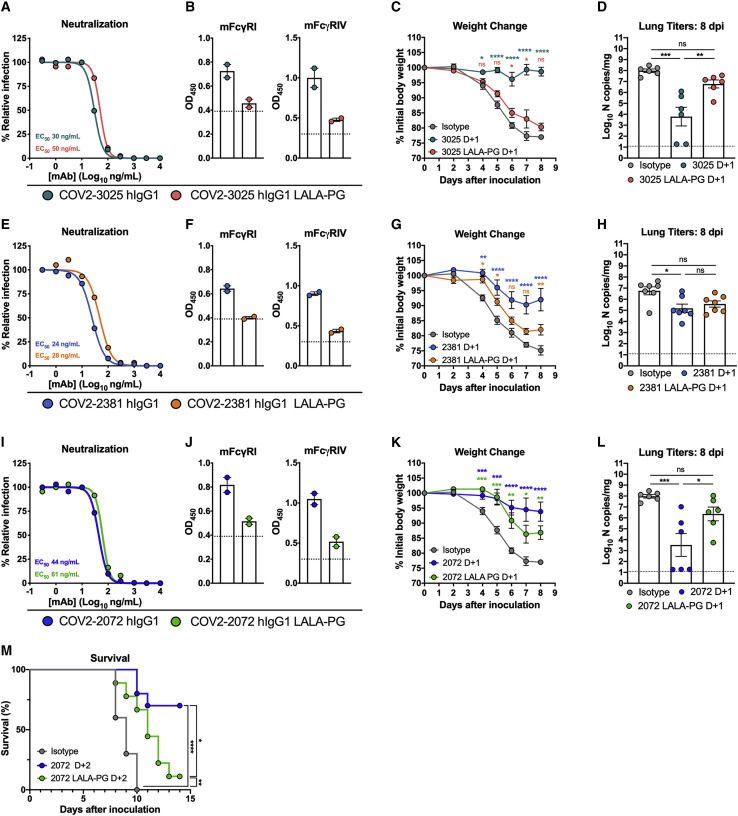
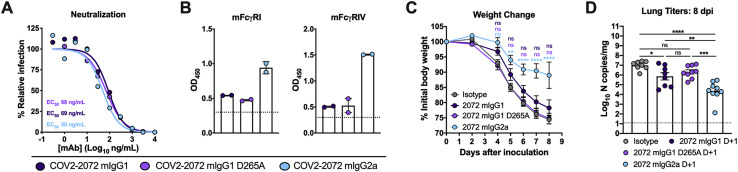
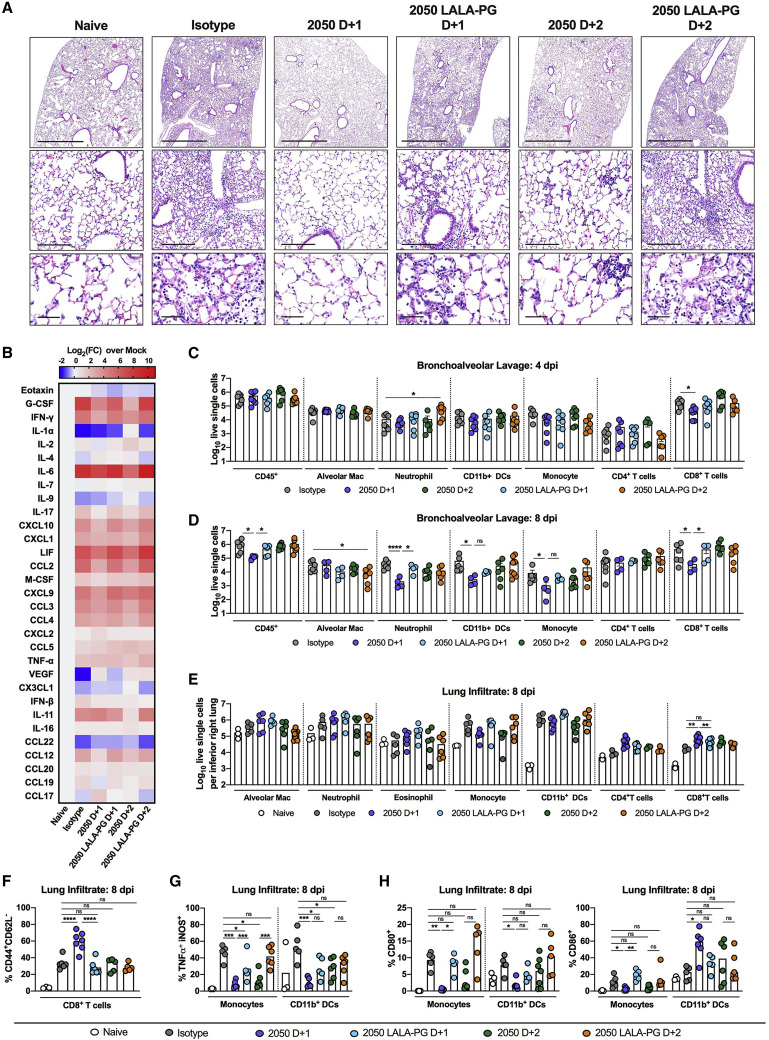
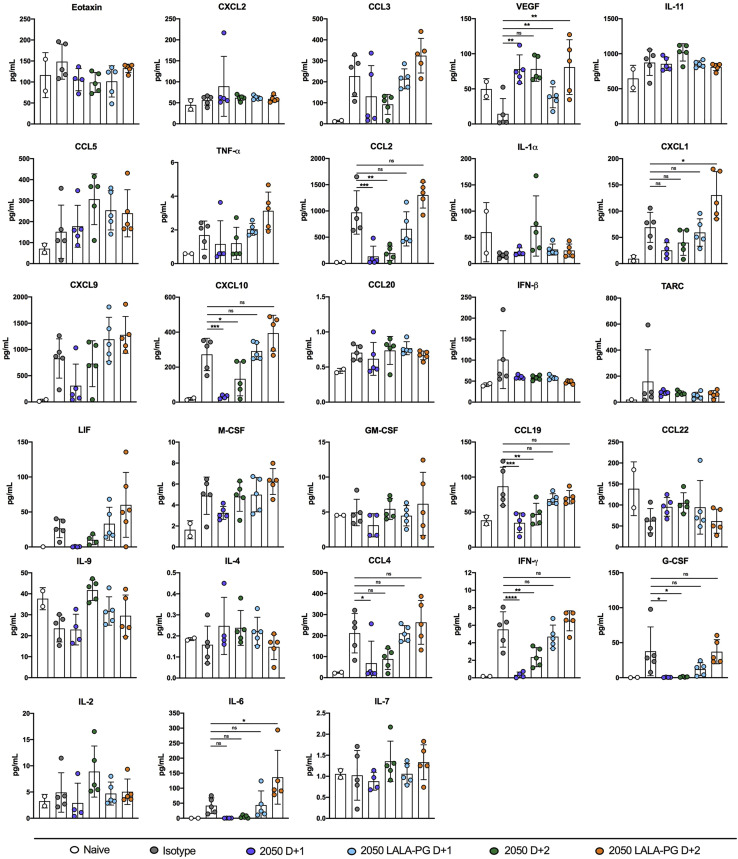
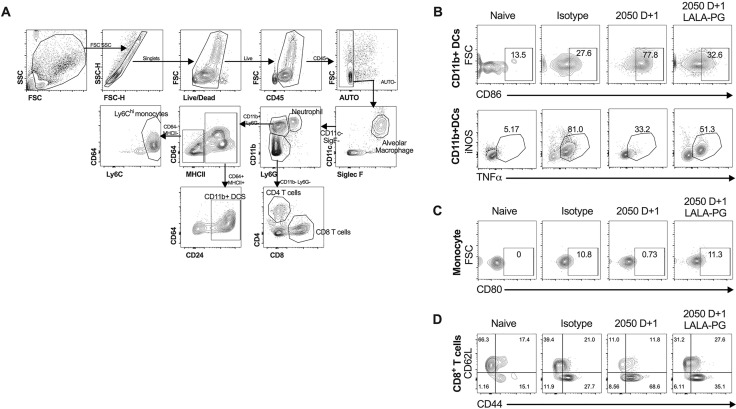
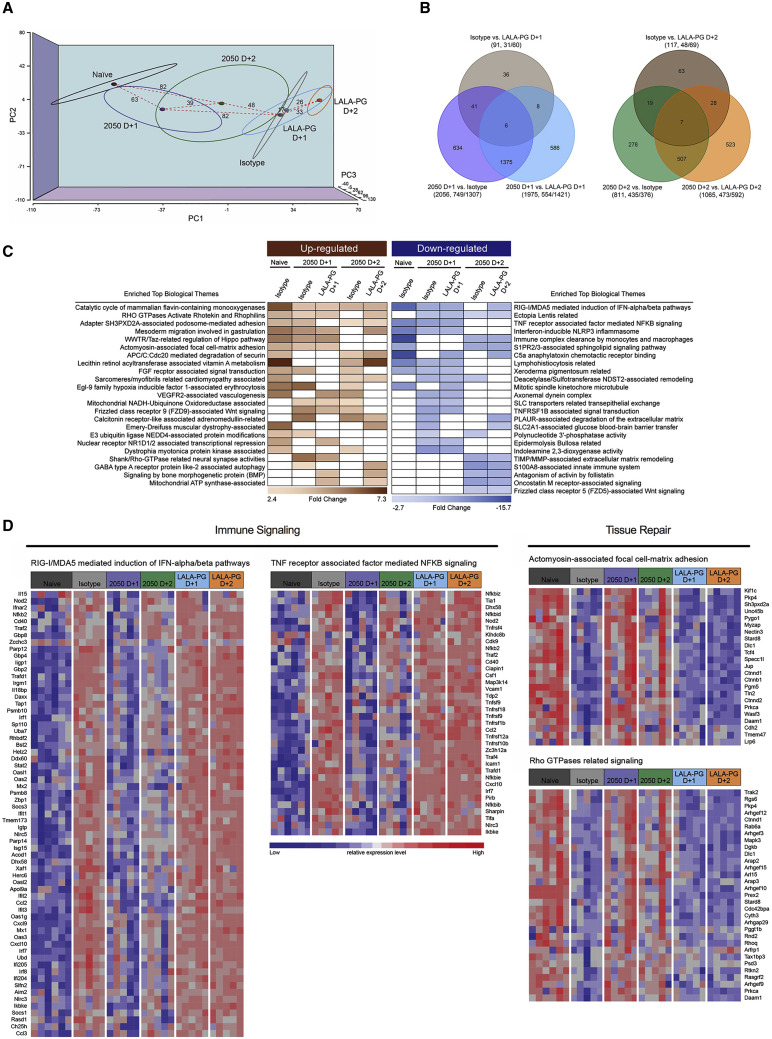
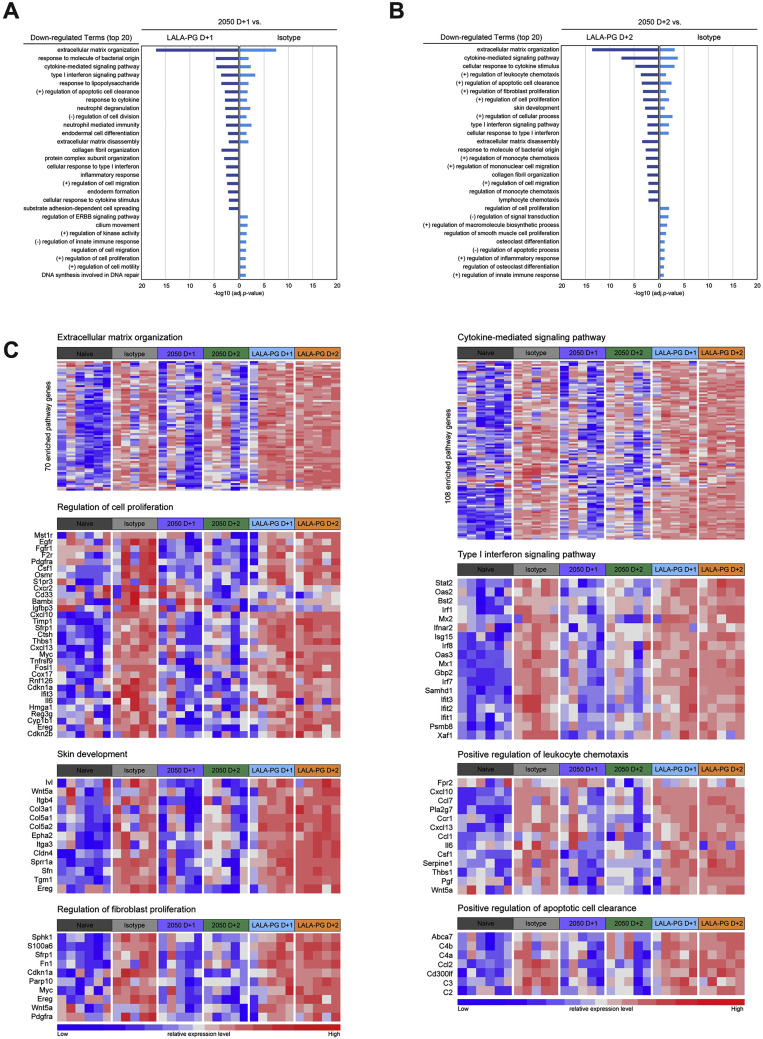
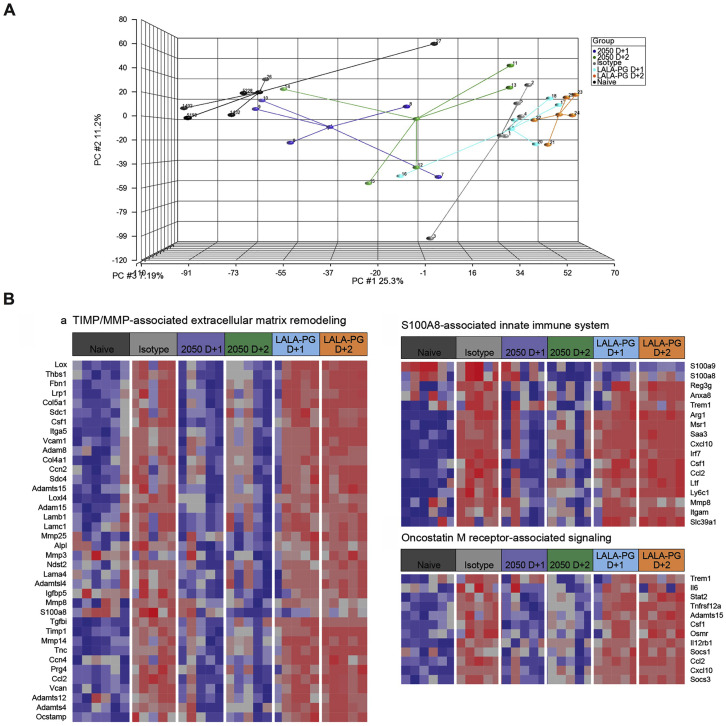
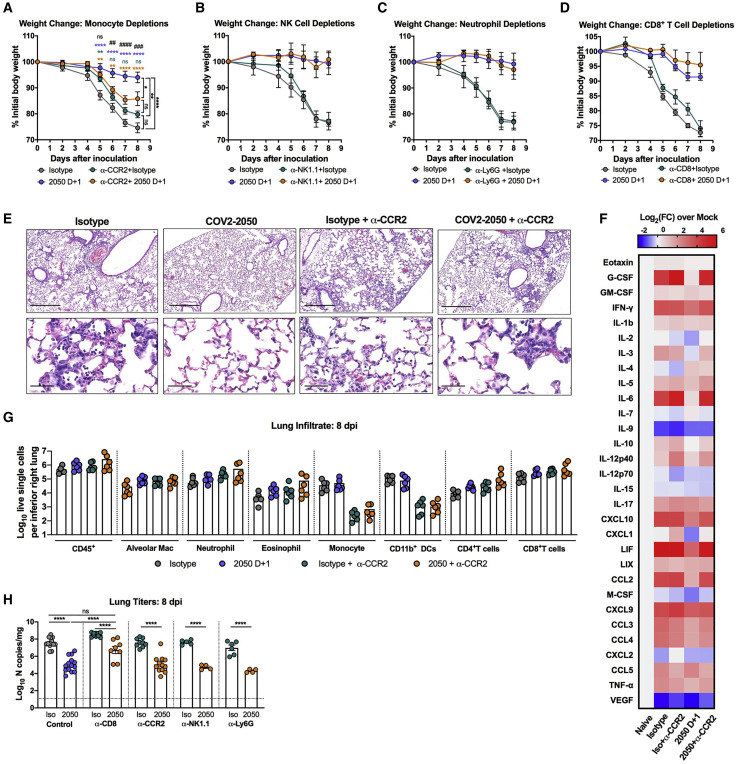
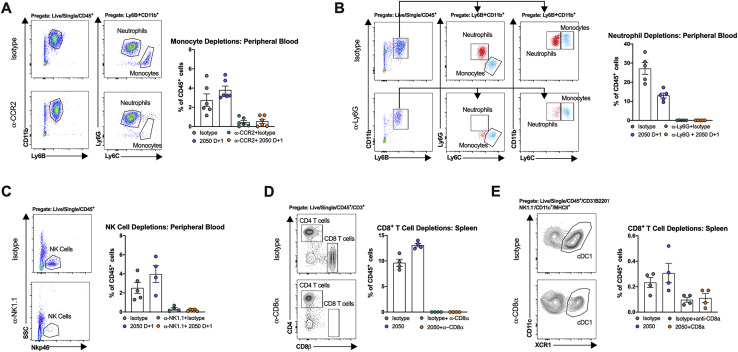
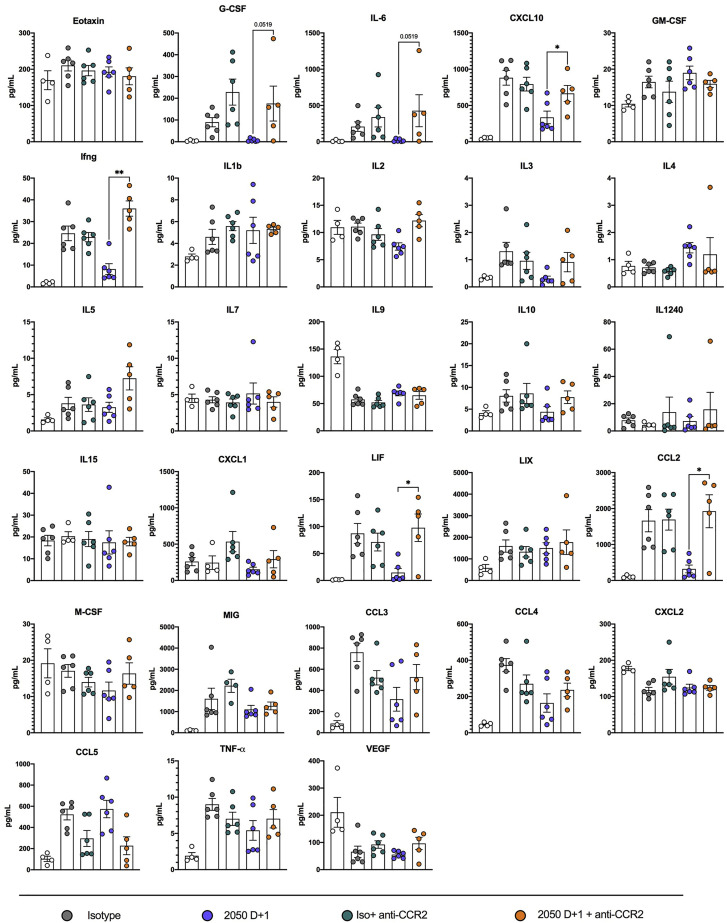
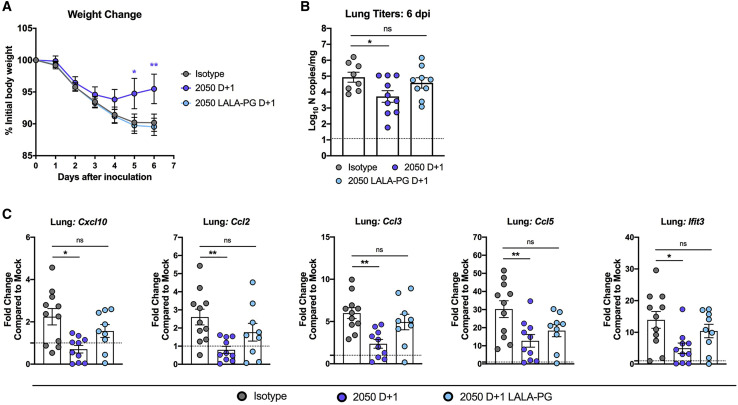
SARS-CoV-2 has caused the global COVID-19 pandemic. Although passively delivered neutralizing antibodies against SARS-CoV-2 show promise in clinical trials, their mechanism of action in vivo is incompletely understood. Here, we define correlates of protection of neutralizing human monoclonal antibodies (mAbs) in SARS-CoV-2-infected animals. Whereas Fc effector functions are dispensable when representative neutralizing mAbs are administered as prophylaxis, they are required for optimal protection as therapy. When given after infection, intact mAbs reduce SARS-CoV-2 burden and lung disease in mice and hamsters better than loss-of-function Fc variant mAbs. Fc engagement of neutralizing antibodies mitigates inflammation and improves respiratory mechanics, and transcriptional profiling suggests these phenotypes are associated with diminished innate immune signaling and preserved tissue repair. Immune cell depletions establish that neutralizing mAbs require monocytes and CD8+ T cells for optimal clinical and virological benefit. Thus, potently neutralizing mAbs utilize Fc effector functions during therapy to mitigate lung infection and disease.

Keywords: CD8+ T cells; RNA sequencing; SARS-CoV-2; antibody; effector function; lung; monocytes; mouse model; pathogenesis; therapy.


Conflict of interest statement

Declaration of interests M.S.D. is a consultant for Inbios, Vir Biotechnology, NGM Biopharmaceuticals, and Carnival Corporation, and on the Scientific Advisory Boards of Moderna and Immunome. The Diamond laboratory has received funding support in sponsored research agreements from Moderna, Vir Biotechnology, and Emergent BioSolutions. J.E.C. has served as a consultant for Eli Lilly and Luna Biologics, is a member of the Scientific Advisory Boards of CompuVax and Meissa Vaccines, and is Founder of IDBiologics. The Crowe laboratory has received sponsored research agreements from AstraZeneca and IDBiologics. Vanderbilt University has applied for patents related to antibodies described in this paper. The Boon laboratory has received funding support in sponsored research agreements from AI Therapeutics, GreenLight Biosciences, AbbVie, and Nano Targeting & Therapy Biopharma. R.H. may receive royalty income based on the CompBio technology developed by R.H. and licensed by Washington University to PercayAI.

Figures

None
Graphical abstract
Figure 1
Figure 1
Neutralizing activity is sufficient for prophylactic efficacy of mAbs against SARS-CoV-2 infection in K18-hACE2 mice (A) MAbs (COV2-2050 and COV2-2050 LALA-PG) were incubated with 102 focus-forming units (FFU) of SARS-CoV-2 for 1 h followed by addition to Vero E6 cells. Wells containing mAb were compared to wells without mAb to determine relative infection. One experiment with the mean of 2 technical replicates is shown. (B) Binding of COV2-2050 or COV2-2050 LALA-PG to murine FcγRI, FcγRIV, or FcγRIIb by ELISA (two experiments). The dotted line indicates the limit of detection (LOD), as determined by background binding to a negative control. (C–K) Eight-week-old female and male K18-hACE2 mice received 200, 40, 8, or 1.6 μg of COV2-2050 or COV2-2050 LALA-PG by intraperitoneal injection 1 day prior to intranasal inoculation with 103 PFU of SARS-CoV-2. (C) Serum concentrations (ng/mL) of COV2-2050 or COV2-2050 LALA-PG at the time of challenge (0 dpi) (mean ± SEM; n = 3–4, 2 experiments). (D) Neutralizing titers in serum of indicated groups at 0 dpi as measured by FRNT (mean ± SEM; n = 6, 2 experiments). (E and F) Weight change following COV2-2050 (E) or COV2-2050 LALA-PG (F) administration (mean ± SEM; n = 4–6, 2 experiments). (G) Correlation analyses comparing COV2-2050 or COV2-2050 LALA-PG serum concentrations (day 0 [D0]) against weight change (D+7) (n = 4–6, 2 experiments). (H) Correlation analyses comparing COV2-2050 neutralizing titers in serum (D0) against weight change (D+7) (n = 6–8, 3 experiments). (I) Viral RNA levels at 7 dpi in the lung (n = 4–6, 2 experiments). (J) Correlation analyses comparing COV2-2050 or COV2-2050 LALA-PG serum concentrations (D0) against lung viral titer (D+7) (n = 4–6, 2 experiments). (K) Correlation analyses comparing serum neutralizing titers (D0) against lung viral titer (D7) (n = 6–8, 2 experiments). (E and F) Two-way ANOVA with Sidak’s post-test: ns not significant, p < 0.05, ∗∗p < 0.01, ∗∗∗∗p < 0.0001; comparison to the isotype control mAb-treated group. (G, H, J, and K) Pearson’s correlations: (G) COV2-2050, p = 0.0026; COV2-2050 LALA-PG, p = 0.0006; (H) COV2-2050, p = 0.0008; (J) COV2-2050, p = 0.0022; COV2-2050 LALA-PG, p = 0.0095; and (K) COV2-2050, p = 0.0006. (I) One-way ANOVA with Turkey’s post-test: ∗∗∗p < 0.001, ∗∗∗∗p < 0.0001, comparison to the isotype control mAb-treated group.
Figure 2
Figure 2
Fc effector functions enhance the therapeutic activity of a neutralizing antibody against SARS-CoV-2 in K18-hACE2 mice (A–J) Eight-week-old K18-hACE2 mice were inoculated by the intranasal route with 103 PFU of SARS-CoV-2. At 1 (D+1), 2 (D+2), or 3 (D+3) dpi, mice were given 200 μg of COV2-2050 or COV2-2050 LALA-PG by intraperitoneal injection. Naive animals were mock-infected with sterile PBS. (A and B) Weight change. For (B), statistical analysis was performed only at time points when all mice were alive to avoid survivor bias (mean ± SEM; n = 8–10, 3 experiments). (C) Survival analysis (n = 8–19, 3 experiments). (D) Serum concentrations (ng/mL) of COV2-2050 or COV2-2050 LALA-PG at 4 dpi (mean ± SEM; n = 8, 2 experiments). (E and F) Viral RNA levels at 4 and 8 dpi in the lung (n = 6–10, 3 experiments). (G) Infectious virus at 4 dpi in the lung (n = 6–8, 2 experiments). (H) SARS-CoV-2 RNA in situ hybridization of lung sections. Images show low- (top; scale bars, 500 μm) and high-power magnification (bottom; scale bars, 100 μm). Images are representative of n = 4 per group. (I) Parameters of respiratory mechanics: inspiratory capacity, resistance, elastance, tissue damping, and quasistatic compliance measured at 8 dpi (n = 3–6, 2 experiments). (J) Pressure volume loops (n = 3–6, 2 experiments). (A and B) Two-way ANOVA with Sidak’s post-test: p < 0.05, ∗∗∗p < 0.001, ∗∗∗∗p < 0.0001; comparison to the isotype control mAb-treated group. (C) Mantel-Cox log-rank test for survival: p < 0.05, ∗∗∗∗p < 0.0001. (E, F, and I) One-way (E and F) or two-way (I and J) ANOVA with Turkey’s post-test: ns not significant, p < 0.05, ∗∗p < 0.01, ∗∗∗p < 0.001, ∗∗∗∗p < 0.0001, comparison to the isotype control mAb-treated group.
Figure 3
Figure 3
Requirement of Fc effector functions for different anti-RBD mAb in vivo (A, E, and I) Anti-SARS-CoV-2 mAbs: COV2-3025 and COV2-3025 LALA-PG (A); COV2-2381, COV2-2381 LALA-PG (E); and COV2-2072, and COV2-2072 LALA-PG (I); MAbs were incubated with 102 focus-forming units (FFU) of SARS-CoV-2 before adding to Vero E6 cells. Wells containing mAb were compared to those without mAb to determine relative infection. One experiment with the mean of 2 technical replicates is shown. (B, F, and J) Binding to recombinant murine FcγRI or FcγRIV of COV2-3025 or COV2-3025 LALA-PG (B); COV2-2381 or COV2-2381 LALA-PG (F); and COV2-2072 or COV2-2072 LALA-PG (J). Data are from 2 experiments. The dotted line indicates the LOD. (C, D, G, H, K, and L) Eight-week-old K18-hACE2 mice were inoculated by the intranasal route with 103 PFU of SARS-CoV-2. At 1 dpi (D+1), mice were given 200 μg of each respective mAb by intraperitoneal injection. (C, G, and K) Weight change (mean ± SEM; n = 6–8, 2 experiments: two-way ANOVA with Sidak’s post-test: p < 0.05, ∗∗p < 0.01, ∗∗∗∗p < 0.0001; comparison to the isotype control mAb-treated group). (D, H, and L) Viral RNA levels at 8 dpi in the lung (n = 6–8, 2 experiments, one-way ANOVA with Dunnett’s test; ∗∗∗∗p < 0.0001). (K) Eight-week-old male K18-hACE2 mice were inoculated by the intranasal route with 103 PFU of SARS-CoV-2. At 2 (D+2) dpi, mice were given 200 μg of COV2-2072 or COV2-2072 LALA-PG by intraperitoneal injection and survival was monitored (n = 8–10, 2 experiments; Mantel-Cox log-rank test for survival: p < 0.05, ∗∗p < 0.01, ∗∗∗∗p < 0.0001). See also Figure S1.
Figure S1
Figure S1
Protective effects of chimeric COV2-2072 with murine Fc regions, related to Figure 3 (A) Chimeric COV2-2072 (mIgG1, mIgG1 D265A, or mIgG2a) were incubated with 102 FFU of SARS-CoV-2 for 1 h at 37°C before adding to Vero E6 cells for a FRNT. Wells containing mAb were compared to wells without mAb to determine relative infection. One experiment of two, with similar results, is shown. The mean of two technical replicates is shown. (B) Binding of COV2-2072 mIgG1, mIgG1 D265A, and mIgG2a to recombinant mouse FcγRI or FcγRIV as measured by ELISA (two independent experiments). The dotted line indicates the limit of detection, as determined by background binding to a negative control. For C-D, eight-week-old female or male K18-hACE2 transgenic mice were inoculated by the intranasal route with 103 PFU of SARS-CoV-2. At D+1, mice were given a single 200 μg dose of COV2-2072 mIgG1, mIgG1 D265A, and mIgG2a by intraperitoneal injection. (C) Weight change (mean ± SEM; n = 7-8, two experiments: two-way ANOVA with Sidak’s post-test: ns not significant, ∗∗p < 0.01, ∗∗∗∗p < 0.0001; comparison to the isotype control mAb-treated group). (D) Viral RNA levels at 8 dpi in the lung as determined by qRT-PCR (n = 8, two experiments, one-way ANOVA with Dunnett’s test; ns not significant, p < 0.05, ∗∗p < 0.01, ∗∗∗p < 0.001, ∗∗∗∗p < 0.0001).
Figure 4
Figure 4
Fc effector functions of a neutralizing antibody modulate the immune responses to SARS-CoV-2 infection Eight-week-old K18-hACE2 mice were inoculated by the intranasal route with 103 PFU of SARS-CoV-2. At 1 (D+1) or 2 (D+2) dpi, mice were given 200 μg of COV2-2050 or COV2-2050 LALA-PG by intraperitoneal injection. Naive animals were mock-infected with sterile PBS. (A) Hematoxylin and eosin staining of lung sections at 8 dpi or from a mock-infected animal. Images show low- (top; scale bars, 1 mm), medium-power (middle; scale bars, 200 μm), and high-power (bottom; scale bars, 50 μm). Representative images from n = 5 per group. (B) Heat-maps of cytokine levels in lung tissue of SARS-CoV-2-infected mice at 8 dpi. Fold-change was calculated compared to mock-infected animals, and log2(fold-change) was plotted in the corresponding heat-map (3 experiments, n = 5 per group except naive (n = 2), statistics reported in Figure S2). (C and D) Flow cytometric analysis of cells harvested from BAL fluid at (C) 4 and (D) 8 dpi (2 experiments, n = 4–8 per group; Bars, mean number of cells). Gating scheme in Figure S3. (E–H) Flow cytometric analysis of lung tissues at 8 dpi. Gating scheme in Figure S3. (E) Number of immune cells harvested from the right inferior lobe. Bars, mean number of cells. (F) Proportion of CD44+CD62L CD8+ T cells. (G and H) Proportion of CD80+, CD86+, or TNFα+iNOS+ monocytes or CD11b+ DCs. Bars, mean percentage of positive cells. (E–H) Two experiments, n = 3–8 per group. (C–H) One-way ANOVA with Dunnett’s test; p < 0.05, ∗∗p < 0.01, ∗∗∗∗p < 0.0001.). See also Figures S2 and S3.
Figure S2
Figure S2
Cytokine induction following SARS-CoV-2 infection, related to Figure 4 Cytokine levels as measured by multiplex platform in the lungs of SARS-CoV-2 infected mice at 8 dpi following isotype, COV2-2050, or COV2-2050 LALA-PG treatment at 1 dpi (D+1) or 2 dpi (D+2) (three experiments, n = 5 per group except naive in which n = 2. One-way ANOVA with Dunnett’s test; p < 0.05; ∗∗p < 0.01; ∗∗∗p < 0.001.) Asterisks indicate statistical significance compared to the isotype-control mAb-treated group.
Figure S3
Figure S3
Flow cytometric gating strategy for BAL fluid analysis, related to Figure 4 (A) For BAL fluid and lung tissue flow cytometric analysis, cells were gated on live, single, autofluorescent-negative CD45+ cells to identify hematopoietic cells. Alveolar macrophages were identified as SiglecFhi CD11chi cells. Neutrophils were identified as Ly6Ghi CD11bhi cells. CD11b- cells were gated further into CD4+ and CD8+ T cells. CD11bhiLy6G- cells were gated subsequently using CD64, CD24, and MHC-II. MHCIIhi CD24hi were defined as CD11b+ DCs. MHCIIlo Ly6hi cells were defined as monocytes. (B) Representative flow cytometry plots of CD86 expression and TNFα/iNOS expression on CD11b+ DCs isolated from the lung tissues of indicated treatment groups. (C) Representative flow cytometry plots of CD80 expression on monocytes isolated from the lung tissues of indicated treatment groups. (D) Representative flow cytometry plots of CD44 and CD62L expression on CD8+ T cells isolated from the lung tissues of indicated treatment groups.
Figure 5
Figure 5
Distinct transcriptional signatures in the lung are associated with COV2-2050 with intact Fc effector functions RNA sequencing analysis from the lung homogenates of naive K18-hACE2 mice or mice infected with SARS-CoV-2 infection at 8 dpi. At 1 (D+1) or 2 (D+2) dpi, mice were given 200 μg of COV2-2050 or COV2-2050 LALA-PG by intraperitoneal injection (n = 5 per group except naive where n = 6). (A) Three-dimensional map from principal component analysis (PCA) of the RNA sequencing data in the study. The PCA has been performed using 12,157 unique genes with count per million reads ≥1 in at least 5 of the study samples (n = 31). Each group is represented by an ellipse and the color-matched solid circle, which is the centroid of each group. The size of the ellipse is the centroid with 1 SD. The dashed red lines with numbers indicate the spatial distance between centroids of the 6 groups, which is calculated by using the three-dimensional coordinates for the centroids. (B) Venn diagrams of overlapping genes identified in differential expression analysis when comparing isotype control, COV2-2050 D+1, and COV2-2050 LALA-PG D+1 or isotype control, COV2-2050 D+2, and COV2-2050 LALA-PG D+2. Numbers in the parenthesis under each comparison indicate the number of differentially expressed genes (fold-change ≥2 at p < 0.05) followed by the proportion that are up- or downregulated. (C) The significantly enriched biological themes defined by a “CompBio” pathway analysis tool comparing treatments with isotype control mAb, COV2-2050 (D+1 and D+2), and COV2-2050 LALA-PG (D+1 and D+2). Only those themes enriched in at least two comparisons are displayed. These themes either are upregulated (brown) or downregulated (blue) in the COV2-2050-treated group (at D+1 or D+2) when compared to the isotype control or COV2-2050 LALA-PG-treated groups. A comparison between the naive and isotype mAb-treated animals for each identified theme also was made. The scaled color blocks represent the mean fold-change of enriched genes with an enrichment score of 10 or greater in the comparison. (D) Heatmaps of selected relevant biological themes (RIG-I/MDA-5 mediated signaling, TNF receptor-associated signaling, actinomyosin cell adhesion, Rho GTPases related signaling) enriched in COV2-2050 D+1 versus isotype control or COV2-2050 LALA-PG D+1. Genes shown are common in the pair of comparisons having an enrichment score of 100 or greater. See also Figures S4 and S5 and Tables S1 and S2.
Figure S4
Figure S4
Gene ontology analysis of RNA-seq data, related to Figure 5 (A-C) RNA sequencing analysis from the lung homogenates of naive K18-hACE2 mice or mice inoculated with SARS-CoV-2 at 8 dpi. At 1 (D+1) or 2 (D+2) dpi, mice were given a single 200 μg dose of COV2-2050 or COV2-2050 LALA-PG by intraperitoneal injection. (A-B) Gene Ontology (GO) Enrichment Analysis of biological process terms enriched in downregulated genes from comparisons of isotype control, COV2-2050, and COV2-2050 LALA-PG when given at D+1 (A) or isotype control, COV2-2050, and COV2-2050 LALA-PG when given at D+2 (B). Terms were ranked by the false discovery rate (q-value), and the top 20 are listed after eliminating redundant terms. (C) Heatmaps of significantly downregulated gene sets corresponding with intact COV2-2050 treatment identified through GO analysis. Genes shown in each pathway are the union of the differentially expressed genes (DEGs) from the five comparisons (isotype control, COV2-2050 D+1, COV2-2050 D+2, COV2-2050 LALA-PG D+1, or COV2-2050 LALA-PG D+2 versus mock-infected). Columns represent samples and rows represent genes. Gene expression levels in the heatmaps are z score-normalized values determined from log2cpm values.
Figure S5
Figure S5
CompBio analysis comparing COV2-2050 D+2, isotype control, and COV2-2050 LALA-PG D+2, related to Figure 5 (A) Three-dimensional map from principal component analysis (PCA) of the RNA-seq data in the study. The PCA was performed using 12,157 unique genes with counts per million reads ≥ 1 in at least 5 of the study samples (n = 31). Each mouse is represented by an individual point that is color-matched to its corresponding experimental group and connected to the centroid point (with a cross bar and ID number) of the corresponding group. (B) Heatmaps of selected relevant biological themes enriched in COV2-2050 D+2 versus isotype control and COV2- LALA-PG D+2. Genes shown are common in the pair of comparisons with an enrichment score of 100 or greater in either of the paired comparisons.
Figure 6
Figure 6
Monocytes and CD8+ T cells are necessary for protection following mAb therapy (A–H) Eight-week-old K18-hACE2 mice received anti-CCR2 (50 μg/dose) (A), anti-NK1.1 (200 μg/dose) (B), anti-Ly6G (250 μg/dose) (C), or anti-CD8 (500 μg/dose) (D) or corresponding isotype controls at D−1, D+1, D+3, D+5, and D+7 relative to SARS-CoV-2 infection. At D0, animals were inoculated by the intranasal route with 103 PFU of SARS-CoV-2. At 1 (D+1) dpi, mice were administered 200 μg of COV2-2050 by intraperitoneal injection. (A–D) Weight change (mean ± SEM; n = 8–12, 2–3 experiments: two-way ANOVA with Sidak’s post-test: p < 0.001, ∗∗∗p < 0.001, ∗∗∗∗p < 0.0001; comparison to the isotype control mAb-treated group). (E) Hematoxylin and eosin staining of lung sections at 8 dpi. Images show low-power (top; scale bars, 250 μm), or high-power (bottom; scale bars, 50 μm). Representative images from n = 3 per group. (F) Heat-maps of cytokine levels in lung tissues of SARS-CoV-2-infected mice at 8 dpi. For each cytokine, fold-change was calculated compared to mock-infected animals, and log2 (fold-change) was plotted in the corresponding heat-map (3 experiments, n = 5–6 per group except naive (n = 4). (G) Flow cytometric analysis of lung tissues at 8 dpi (2 experiments, n = 8 per group; Bars, mean number of cells). (H) Viral RNA levels at 8 dpi in the lung (n = 4–12, 2–3 experiments: one-way ANOVA with Turkey’s post-test: ns not significant, ∗∗∗∗p < 0.0001, comparison to the isotype control mAb-treated group). See Figures S6 and S7.
Figure S6
Figure S6
Confirmation of cellular depletions, related to Figure 6 (A) Representative flow cytometry plots of monocytes and neutrophils from peripheral blood at 8 dpi following intraperitoneal injection of a depleting anti-CCR2 mAb or isotype control mAb and frequency of Ly6Chi monocytes and neutrophils in blood at 8 dpi following anti-CCR2 or isotype control mAb administration in isotype control or COV2-2050-treated mice (two experiments, n = 6 per group). (B) Representative flow cytometry plots of peripheral blood at 8 dpi following intraperitoneal injection of a depleting anti-Ly6G mAb or isotype control mAb and frequency of Ly6Chi monocytes and mature Ly6G+ neutrophils in blood at 8 dpi following anti-Ly6G or isotype control mAb administration in isotype control or COV2-2050-treated mice (two experiments, n = 5-6 per group). In the groups treated with anti-Ly6G, neutrophils were identified as CD11b+ Ly6B+ Ly6Cint cells. Red dots (neutrophils) and monocytes (blue dots) correspond to the same population identified in both plots (neutrophils: CD11b+ Ly6C+Ly6G+ Ly6Cint and monocytes: CD11b+ Ly6C+Ly6G- Ly6Chigh). (C) Representative flow cytometry plots of peripheral blood at 8 dpi following intraperitoneal injection of a depleting anti-NK1.1 mAb or isotype control mAb. Also shown is the frequency of NK cells in blood at 8 dpi following anti-NK1.1 or isotype control mAb administration in isotype control or COV2-2050-treated mice (two experiments, n = 4-5 per group). (D) Representative flow cytometry plots of splenocytes gated on CD4+ and CD8+ T cells at 8 dpi following intraperitoneal injection of a depleting anti-CD8α mAb or isotype control mAb (left). Frequency of CD8+ T cells in the spleen at 8 dpi following anti-CD8α or isotype control mAb administration in isotype mAb control or COV2-2050-treated mice (right) (two experiments, n = 4-5 per group). (E) Representative flow cytometry plots of splenocytes gated to cDC1s at 8 dpi following intraperitoneal injection of a depleting anti-CD8α mAb or isotype control mAb (left). Frequency of cDC1 cells in the spleen at 8 dpi following anti-CD8α or isotype control mAb administration in isotype control mAb or COV2-2050-treated mice (right) (two experiments, n = 4-5 per group).
Figure S7
Figure S7
Cytokine induction following SARS-CoV-2 infection and monocyte depletion, related to Figure 6 Cytokine levels as measured by multiplex platform in the lungs of mock-infected mice or SARS-CoV-2-infected mice at 8 dpi following treatment with isotype mAb, COV2-2050 D+1, isotype mAb + anti-CCR2, or COV2-2050 D+1 + anti-CCR2 (two experiments, n = 4-6 per group. One-way ANOVA with Dunnett’s test; p < 0.05; ∗∗p < 0.01; ∗∗∗p < 0.001.) One animal was excluded from cytokine analysis in the 2050 D+1 + anti-CCR2 group due to incomplete monocyte depletion in peripheral blood (monocytes still made up ~3% of CD45+ cells).
Figure 7
Figure 7
Fc effector functions enhance the therapeutic activity of neutralizing antibodies against SARS-CoV-2 in Syrian hamsters (A–C) Seven-month-old female Syrian hamsters were inoculated by the intranasal route with 5 × 105 PFU of SARS-CoV-2. At 1 dpi (D+1), hamsters were given 1 mg of COV2-2050 or COV2-2050 LALA-PG by intraperitoneal injection. (A) Weight change (mean ± SEM; n = 8–10, 2 experiments: two-way ANOVA with Sidak’s post-test: p < 0.05, ∗∗p < 0.01; comparison to the isotype control mAb-treated group). (B) Viral RNA levels at 6 dpi in the lung (n = 8–10, 2 experiments: one-way ANOVA with Turkey’s post-test: ns not significant, p < 0.05, comparison to the isotype control mAb-treated group). (C) Fold change in gene expression of indicated cytokines and chemokines in lung homogenates. Data are normalized to Rpl18 and compared to naive controls (2 experiments, n = 8–10 per group, one-way ANOVA with Dunnett’s test; p < 0.05; ∗∗p < 0.01). Dotted lines indicate the mean cytokine or chemokine transcript levels in naive hamsters.

Update of

References

    1. Abraham J. Passive antibody therapy in COVID-19. Nat. Rev. Immunol. 2020;20:401–403. - PMC - PubMed
    1. Adamo L., Yu J., Rocha-Resende C., Javaheri A., Head R.D., Mann D.L. Proteomic Signatures of Heart Failure in Relation to Left Ventricular Ejection Fraction. J. Am. Coll. Cardiol. 2020;76:1982–1994. - PMC - PubMed
    1. Alsoussi W.B., Turner J.S., Case J.B., Zhao H., Schmitz A.J., Zhou J.Q., Chen R.E., Lei T., Rizk A.A., McIntire K.M., et al. A Potently Neutralizing Antibody Protects Mice against SARS-CoV-2 Infection. J. Immunol. 2020;205:915–922. - PMC - PubMed
    1. Amigorena S., Salamero J., Davoust J., Fridman W.H., Bonnerot C. Tyrosine-containing motif that transduces cell activation signals also determines internalization and antigen presentation via type III receptors for IgG. Nature. 1992;358:337–341. doi: 10.1038/358337a0. - DOI - PubMed
    1. Baudino L., Shinohara Y., Nimmerjahn F., Furukawa J., Nakata M., Martínez-Soria E., Petry F., Ravetch J.V., Nishimura S., Izui S. Crucial role of aspartic acid at position 265 in the CH2 domain for murine IgG2a and IgG2b Fc-associated effector functions. J. Immunol. 2008;181:6664–6669. - PubMed

Publication types

MeSH terms