. 2021 Mar 10;13(584):eabe1433.
doi: 10.1126/scitranslmed.abe1433.

Prosaposin mediates inflammation in atherosclerosis

Affiliations

Prosaposin mediates inflammation in atherosclerosis

Mandy M T van Leent et al. Sci Transl Med. .

Abstract

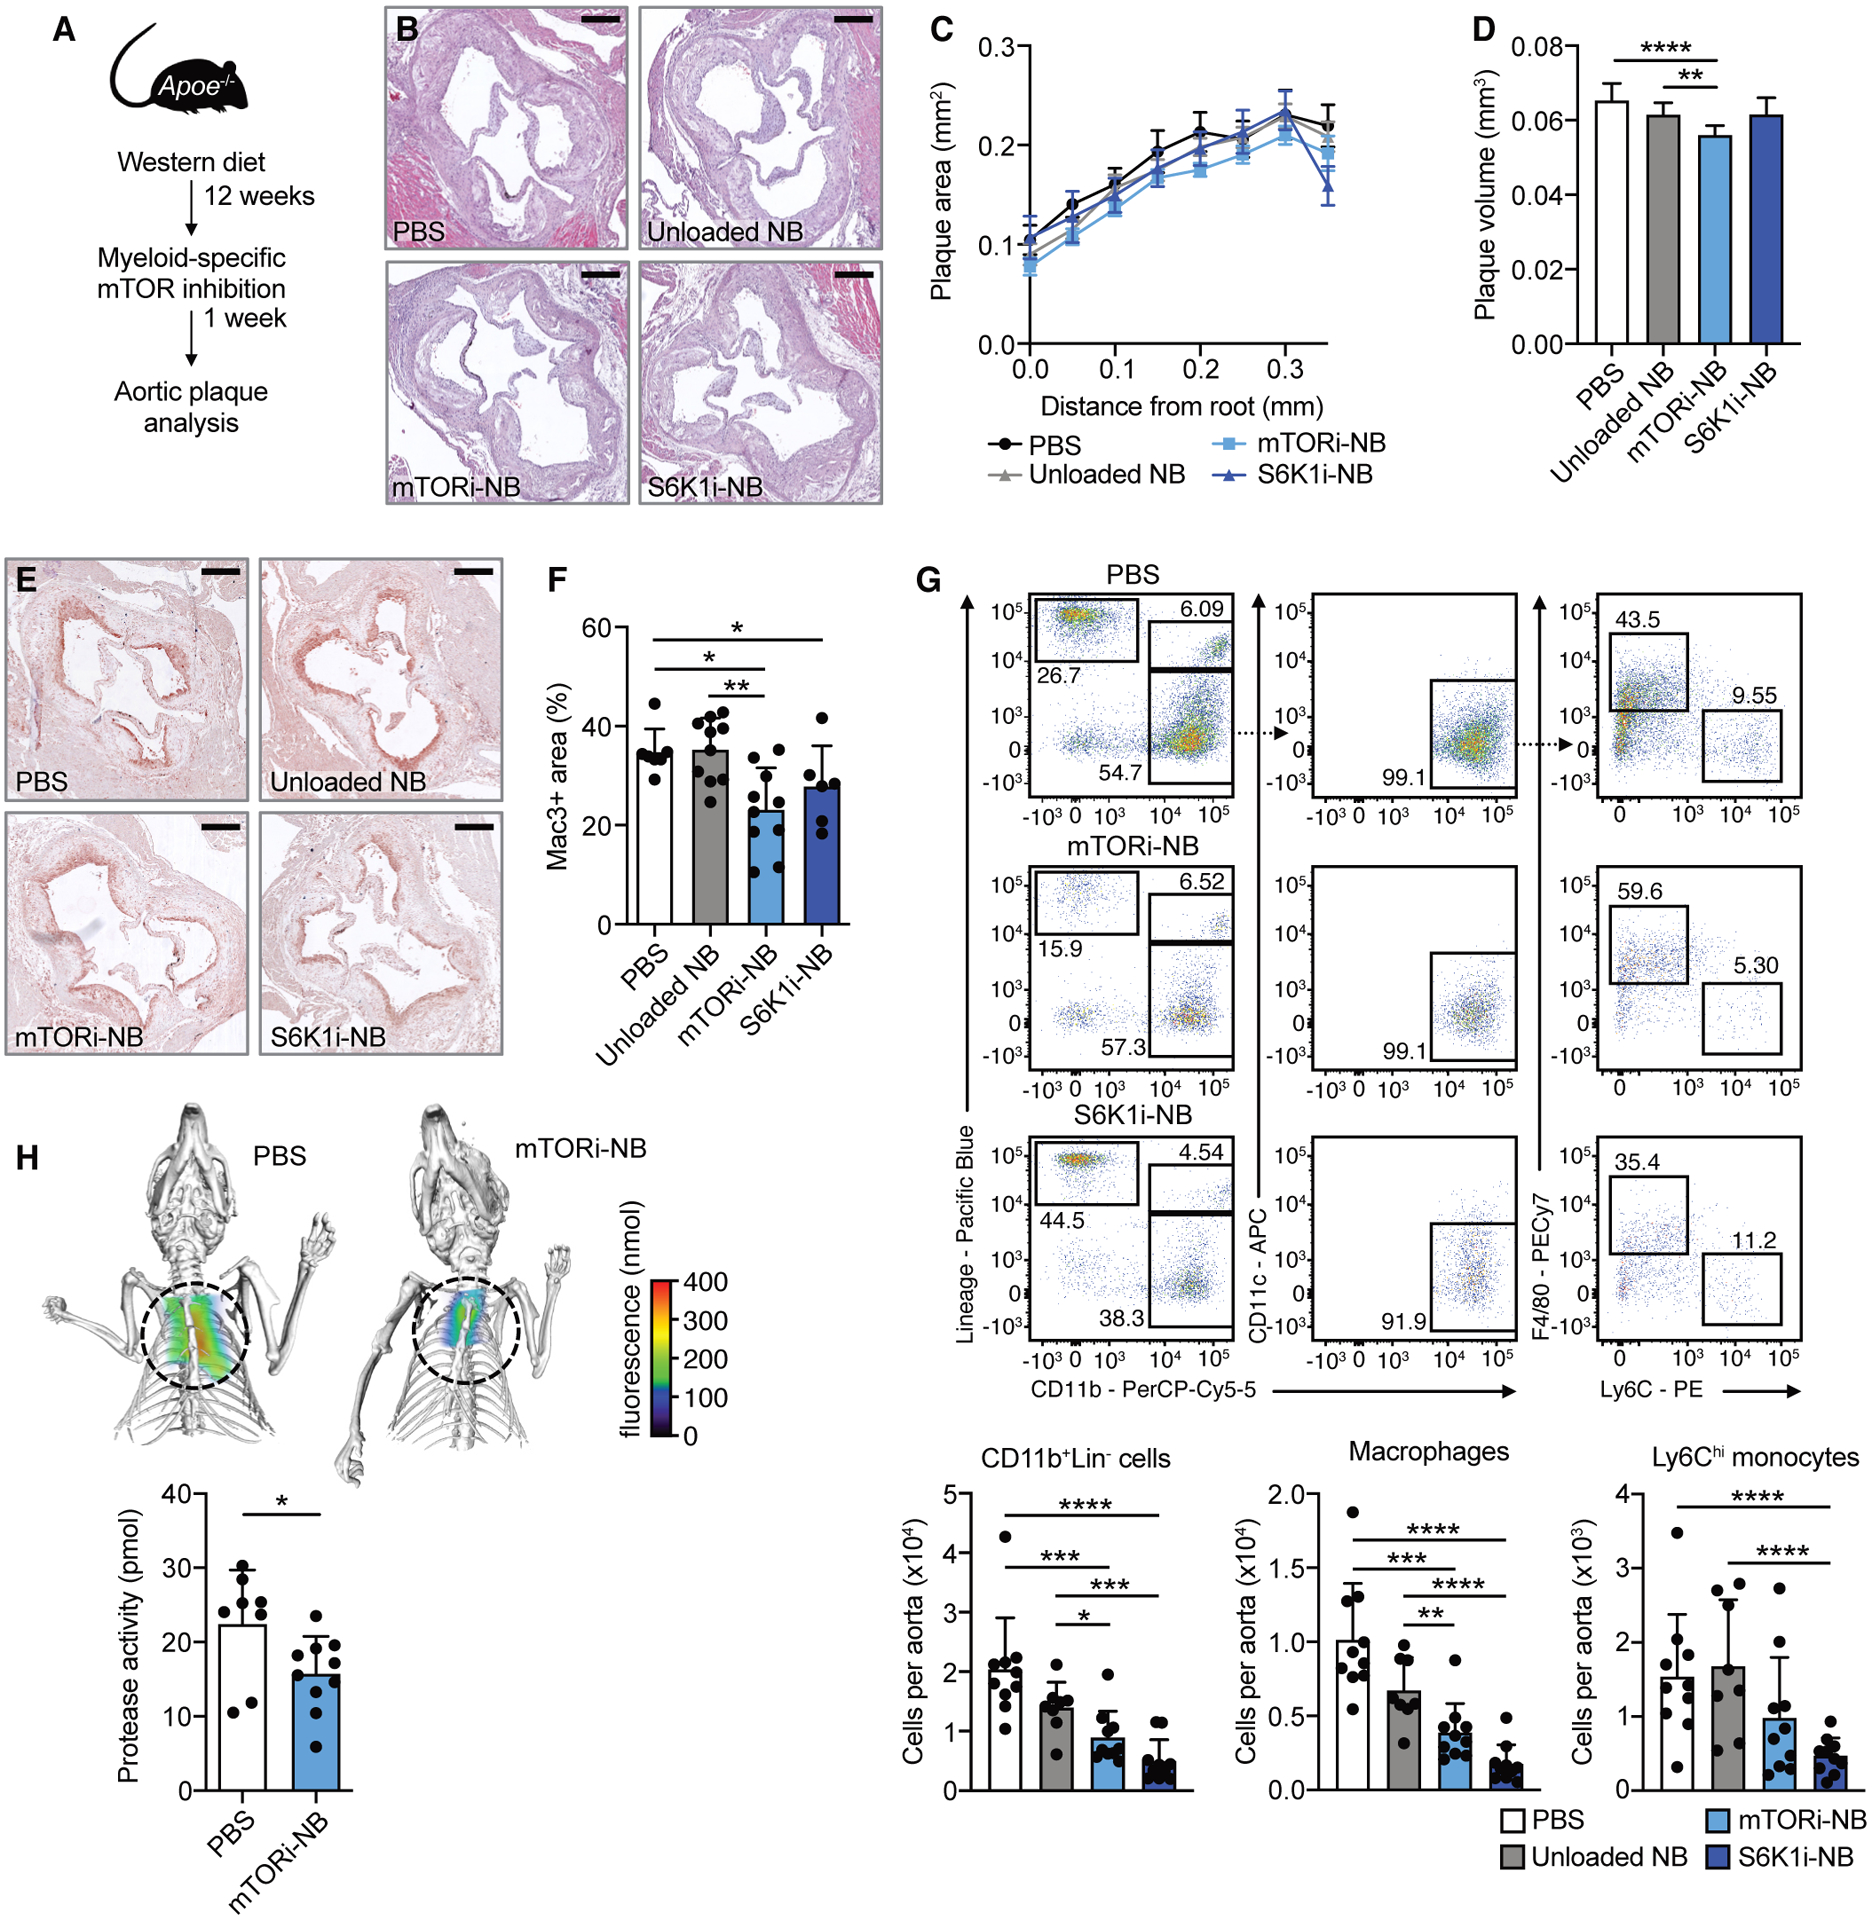
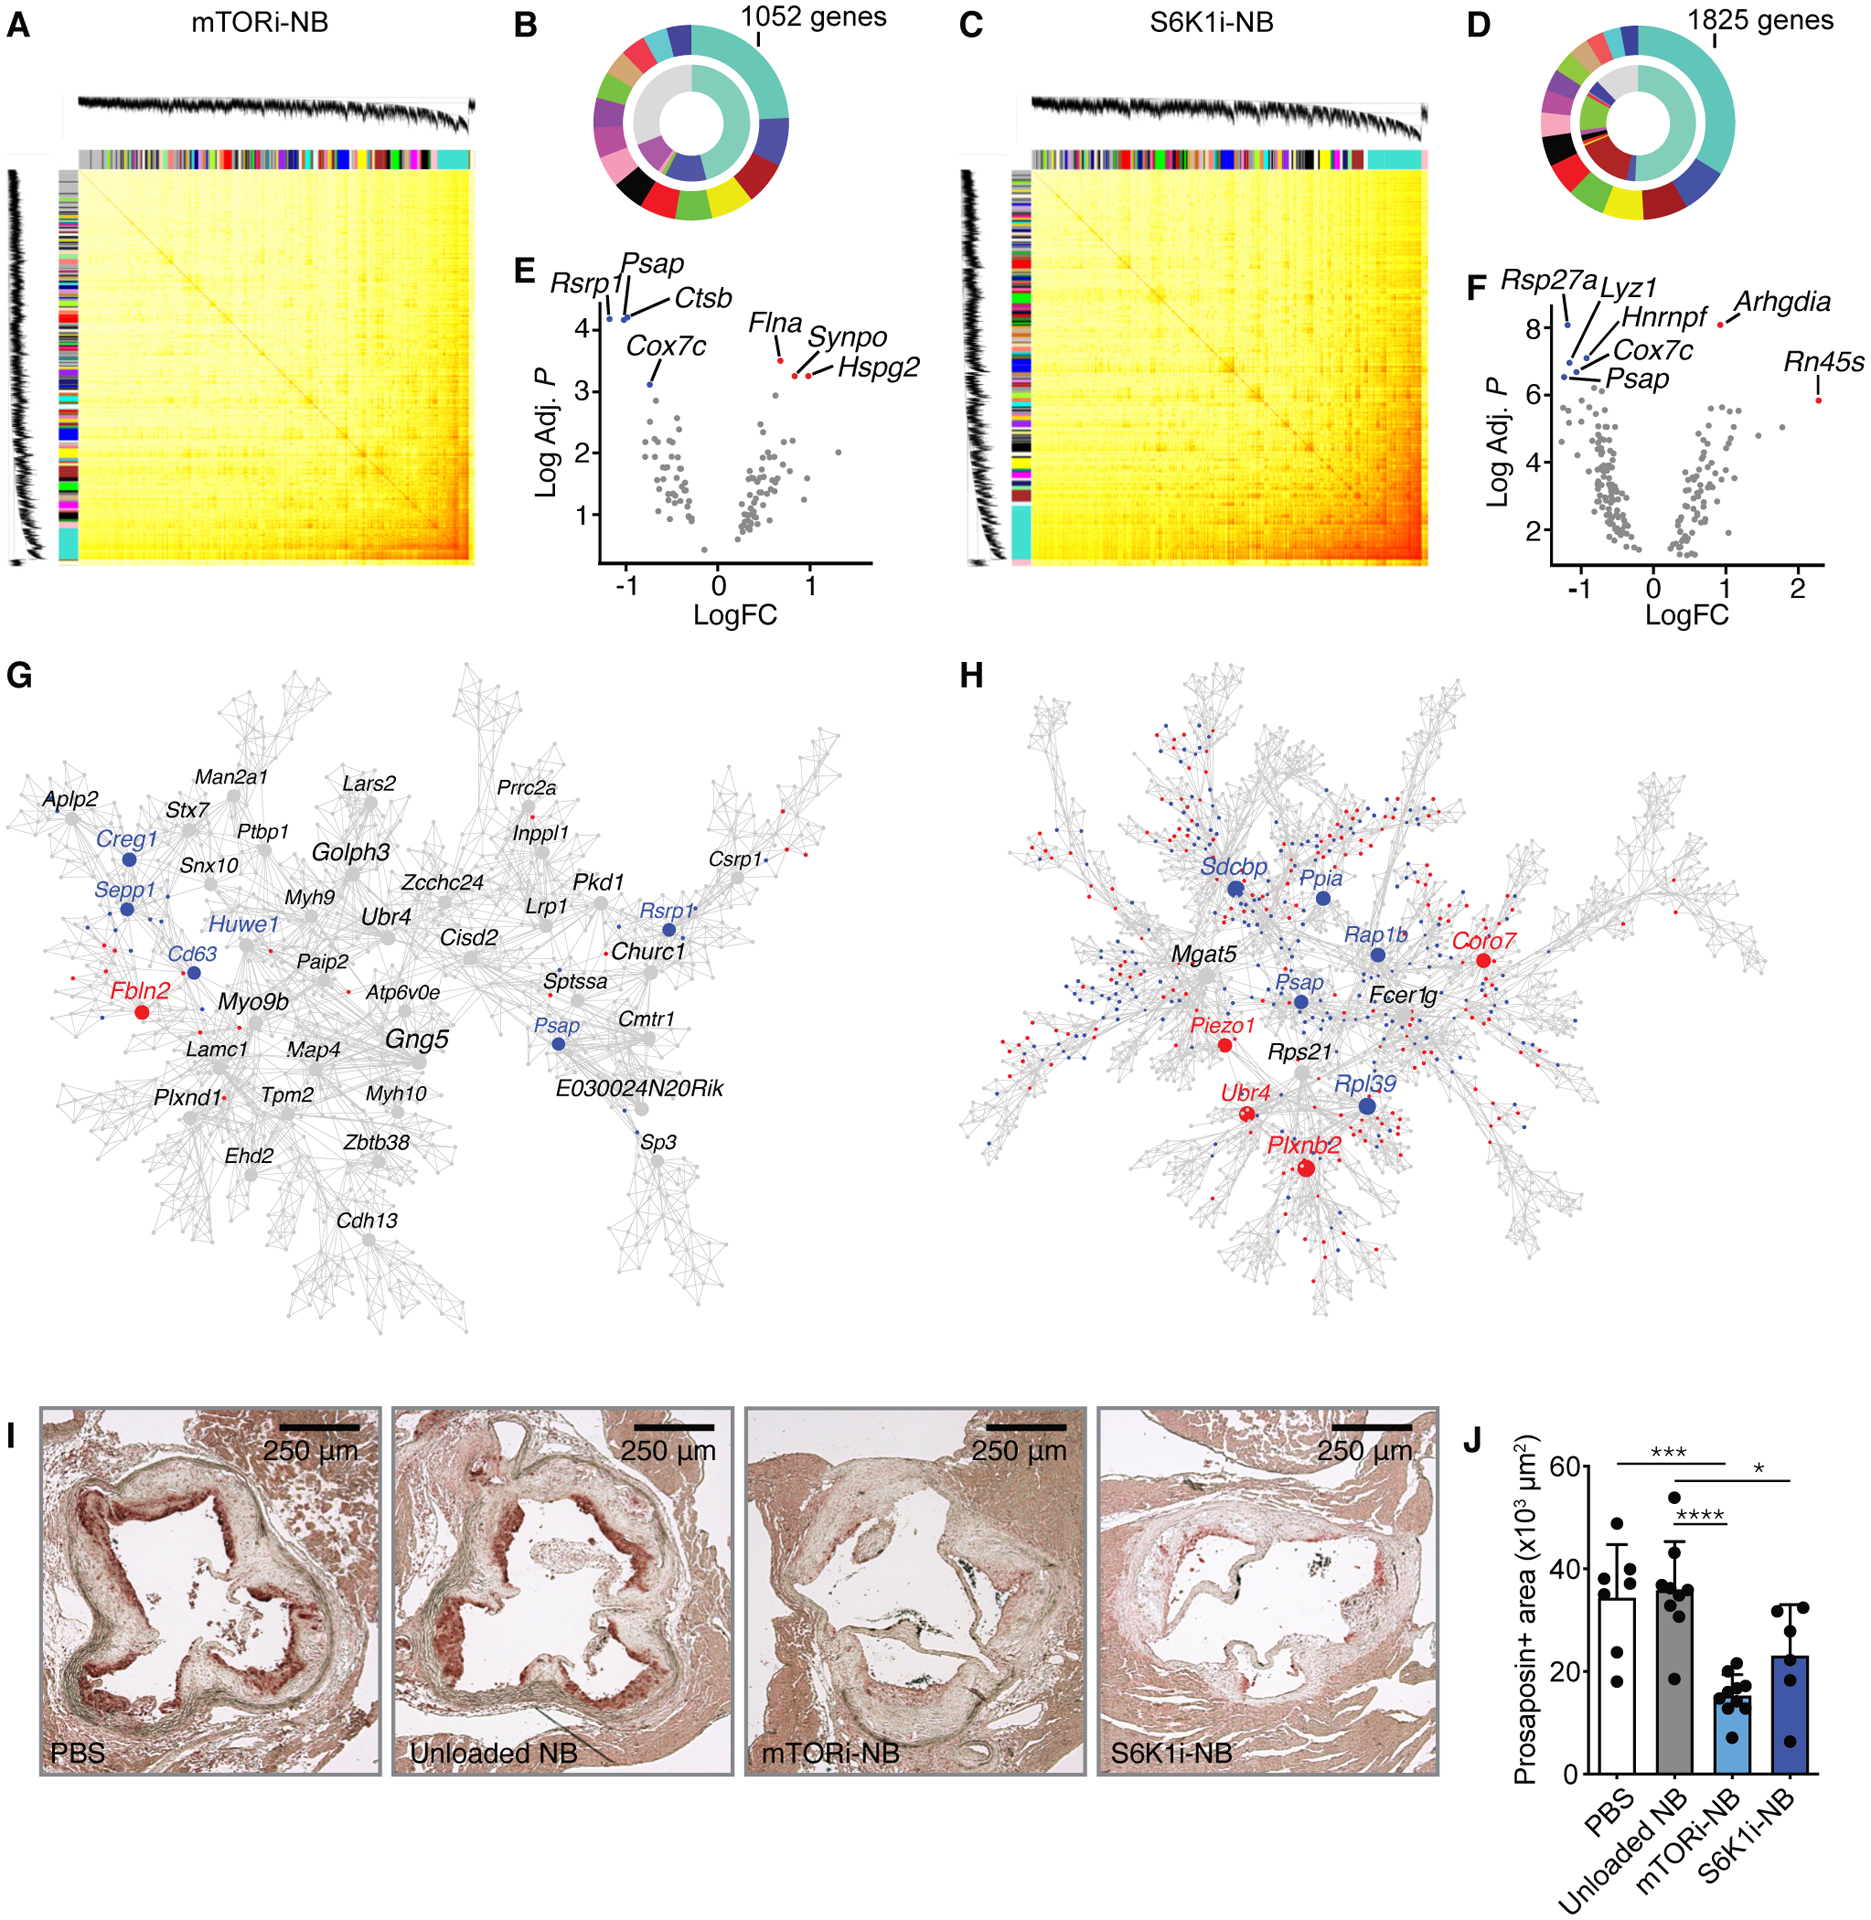
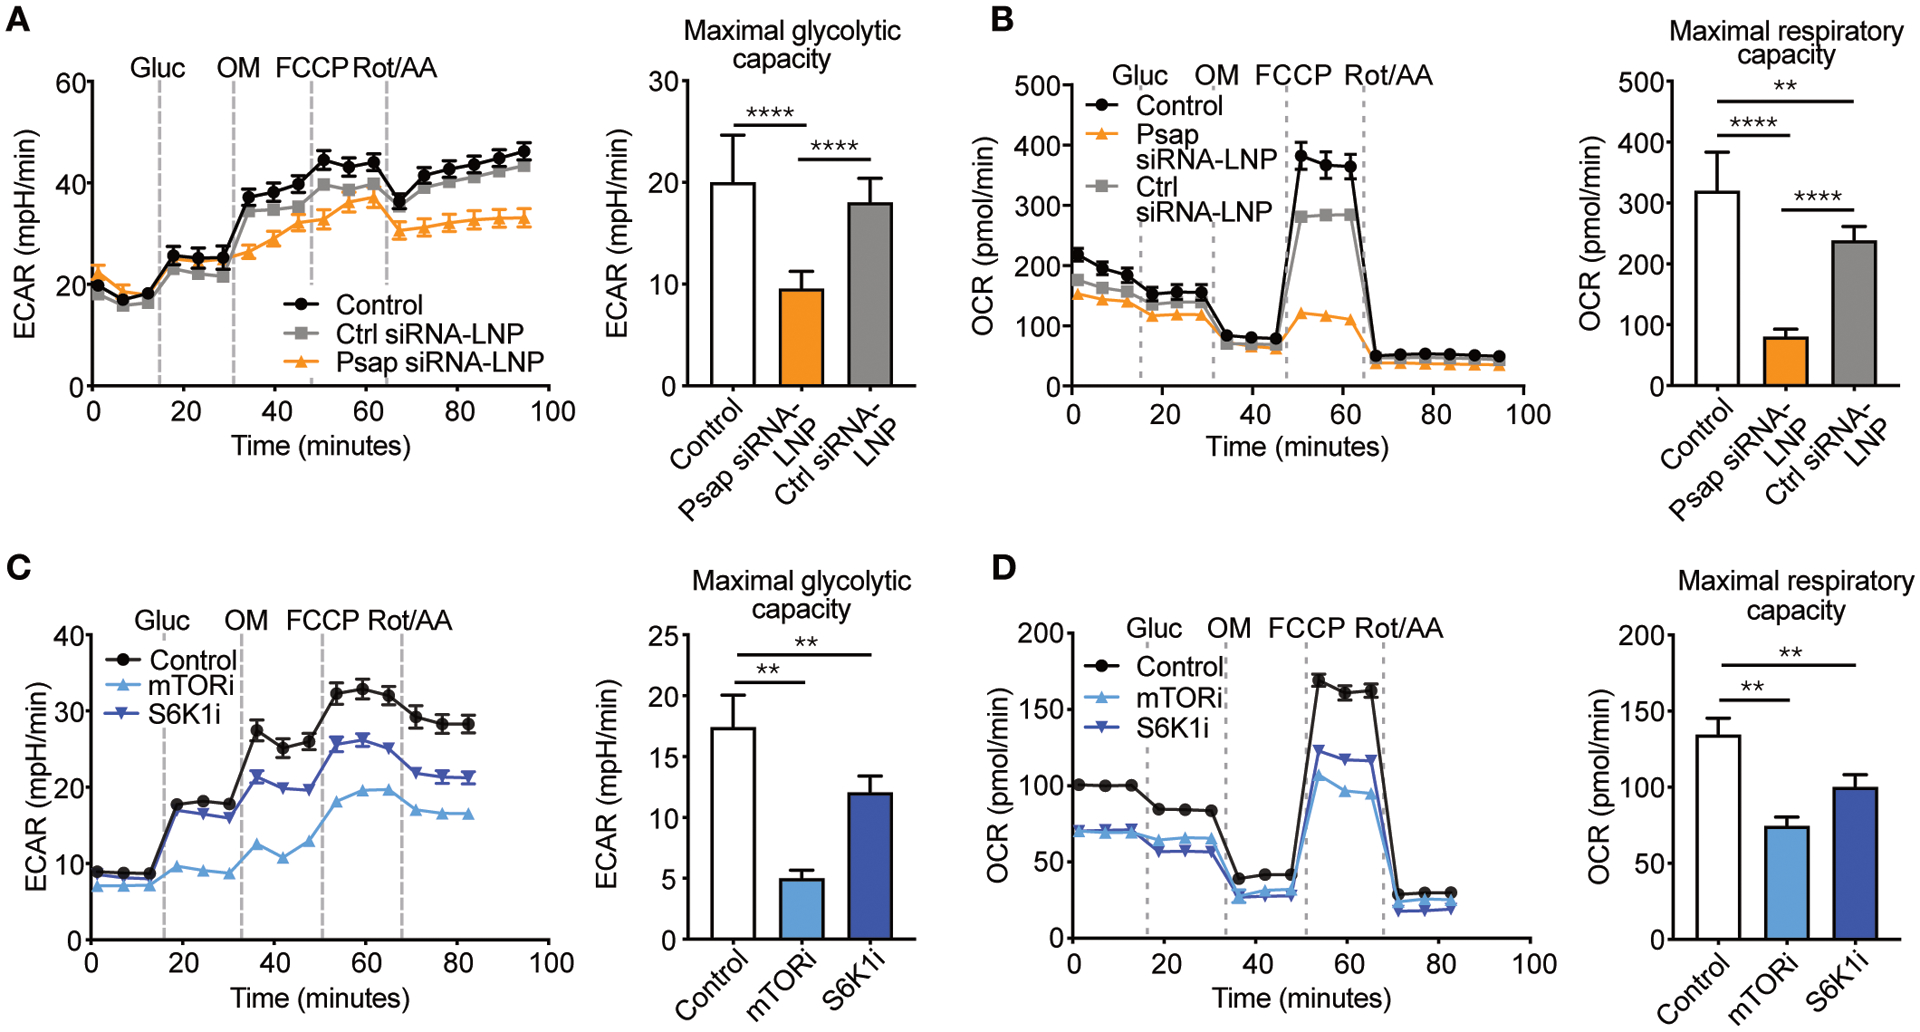
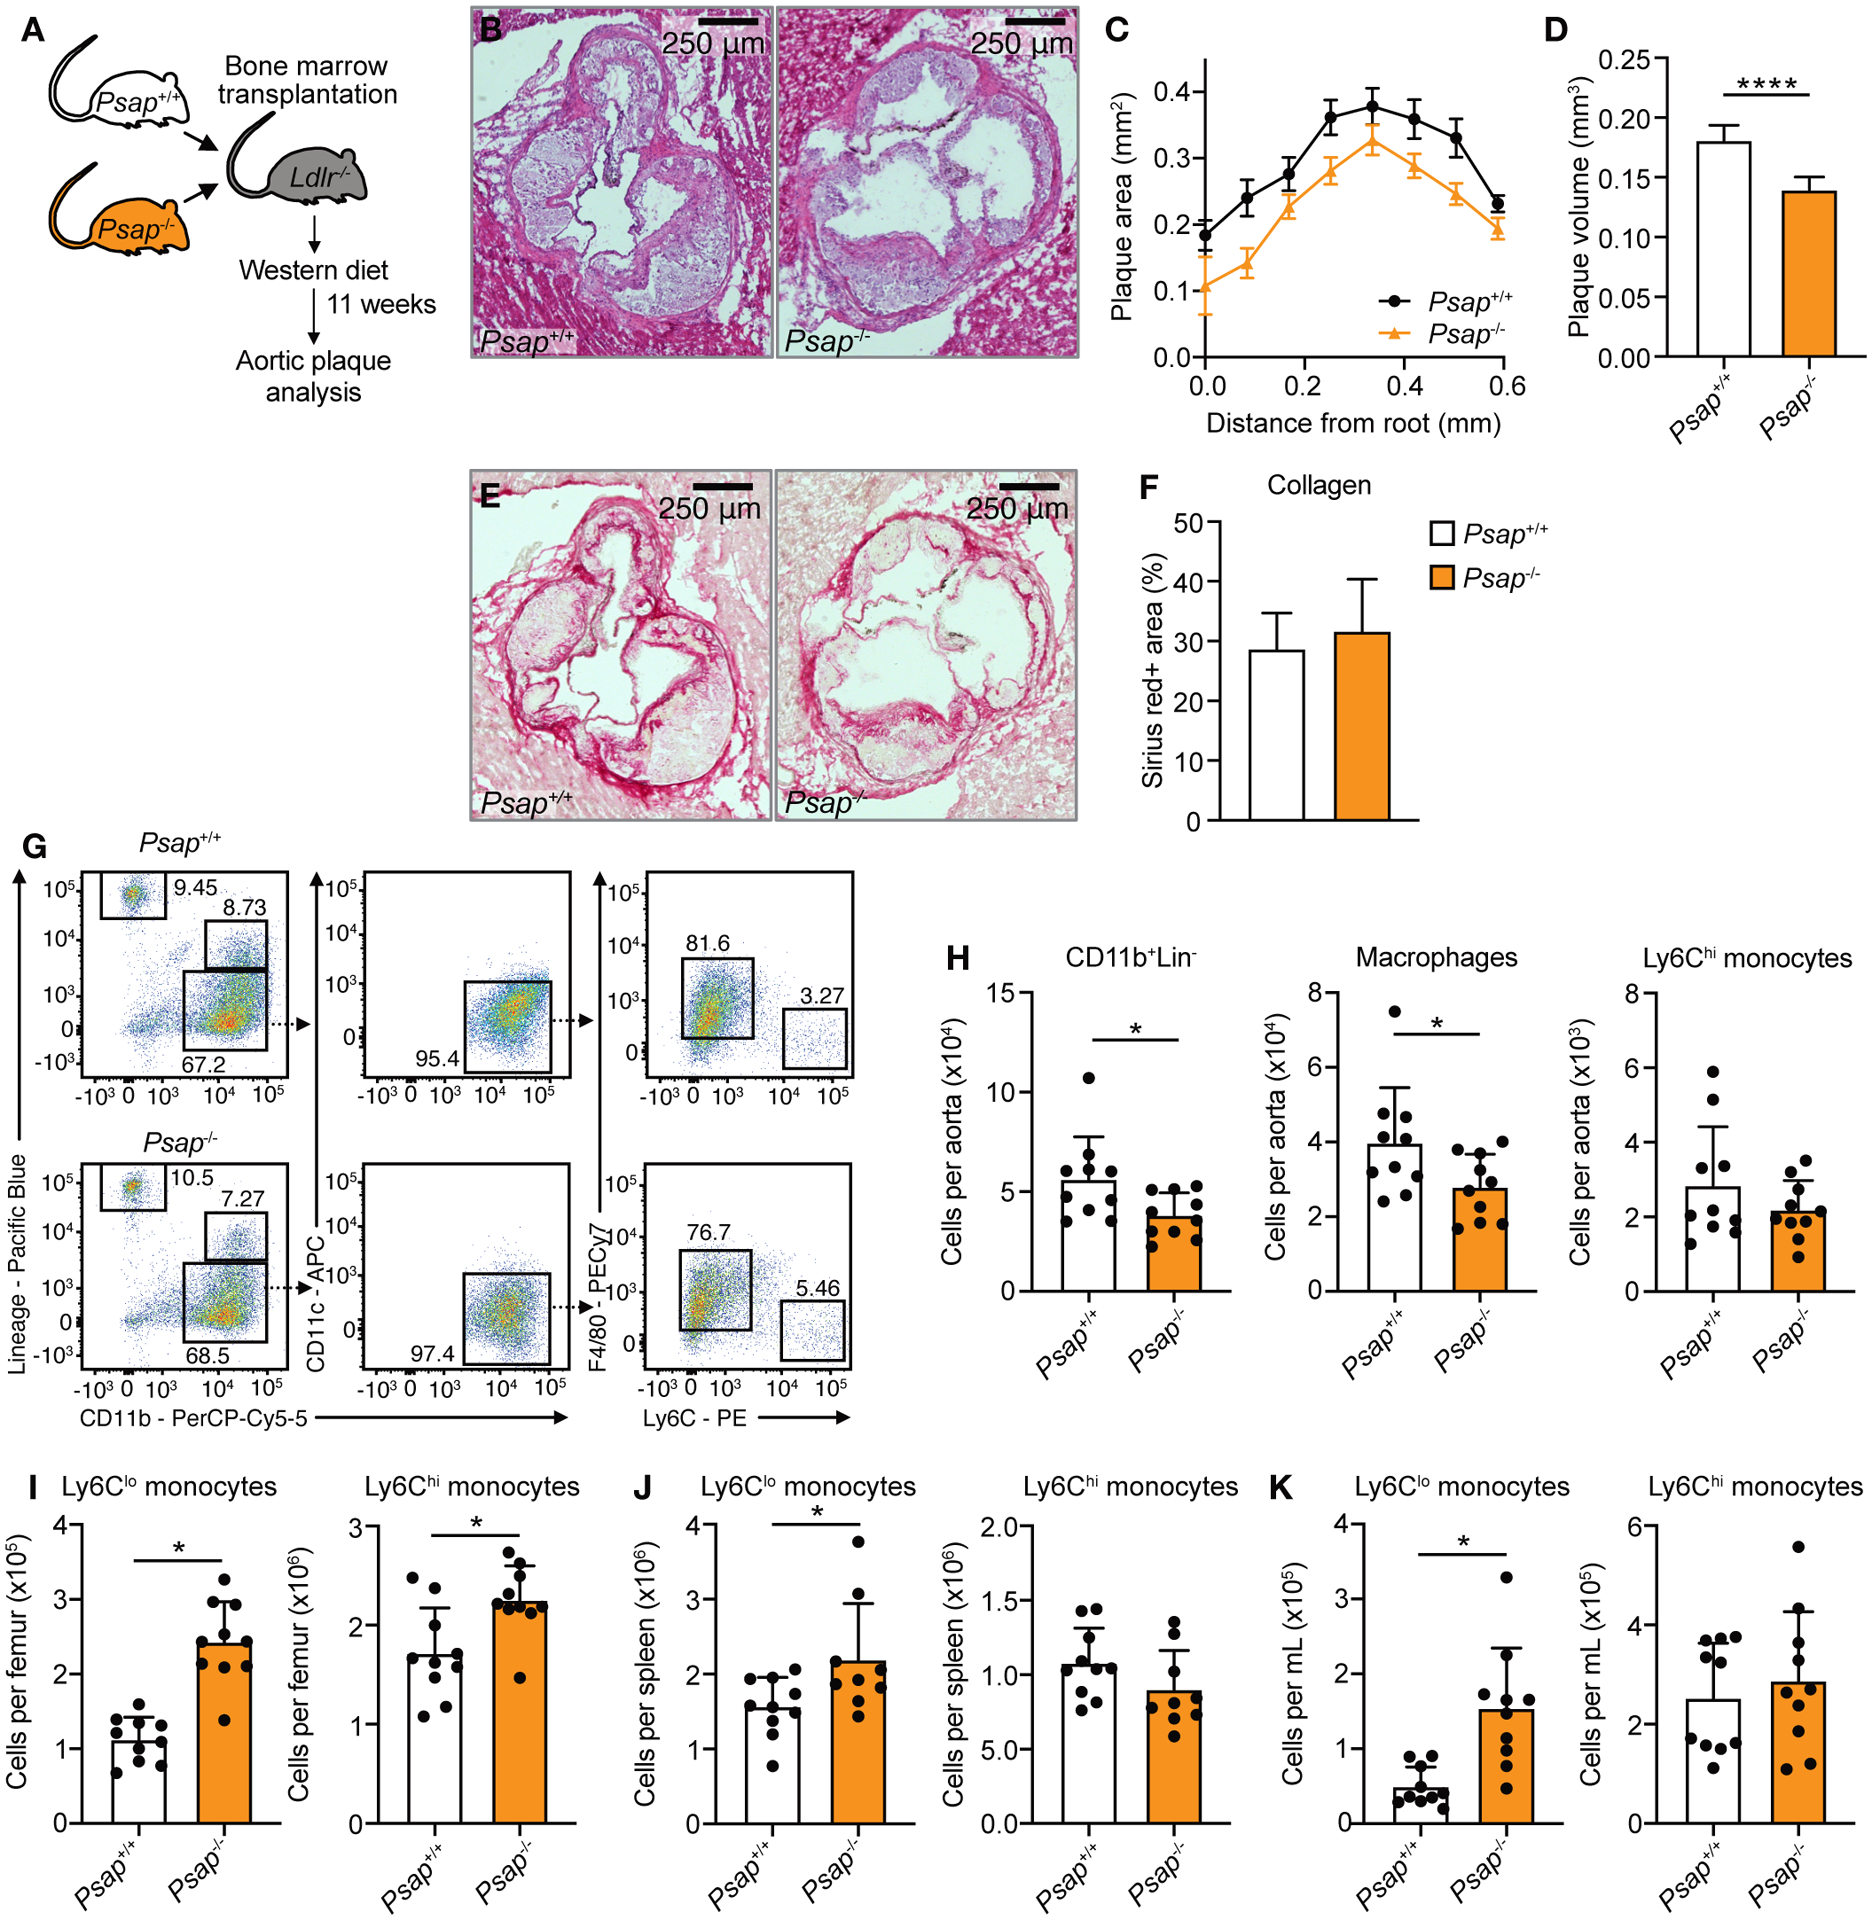
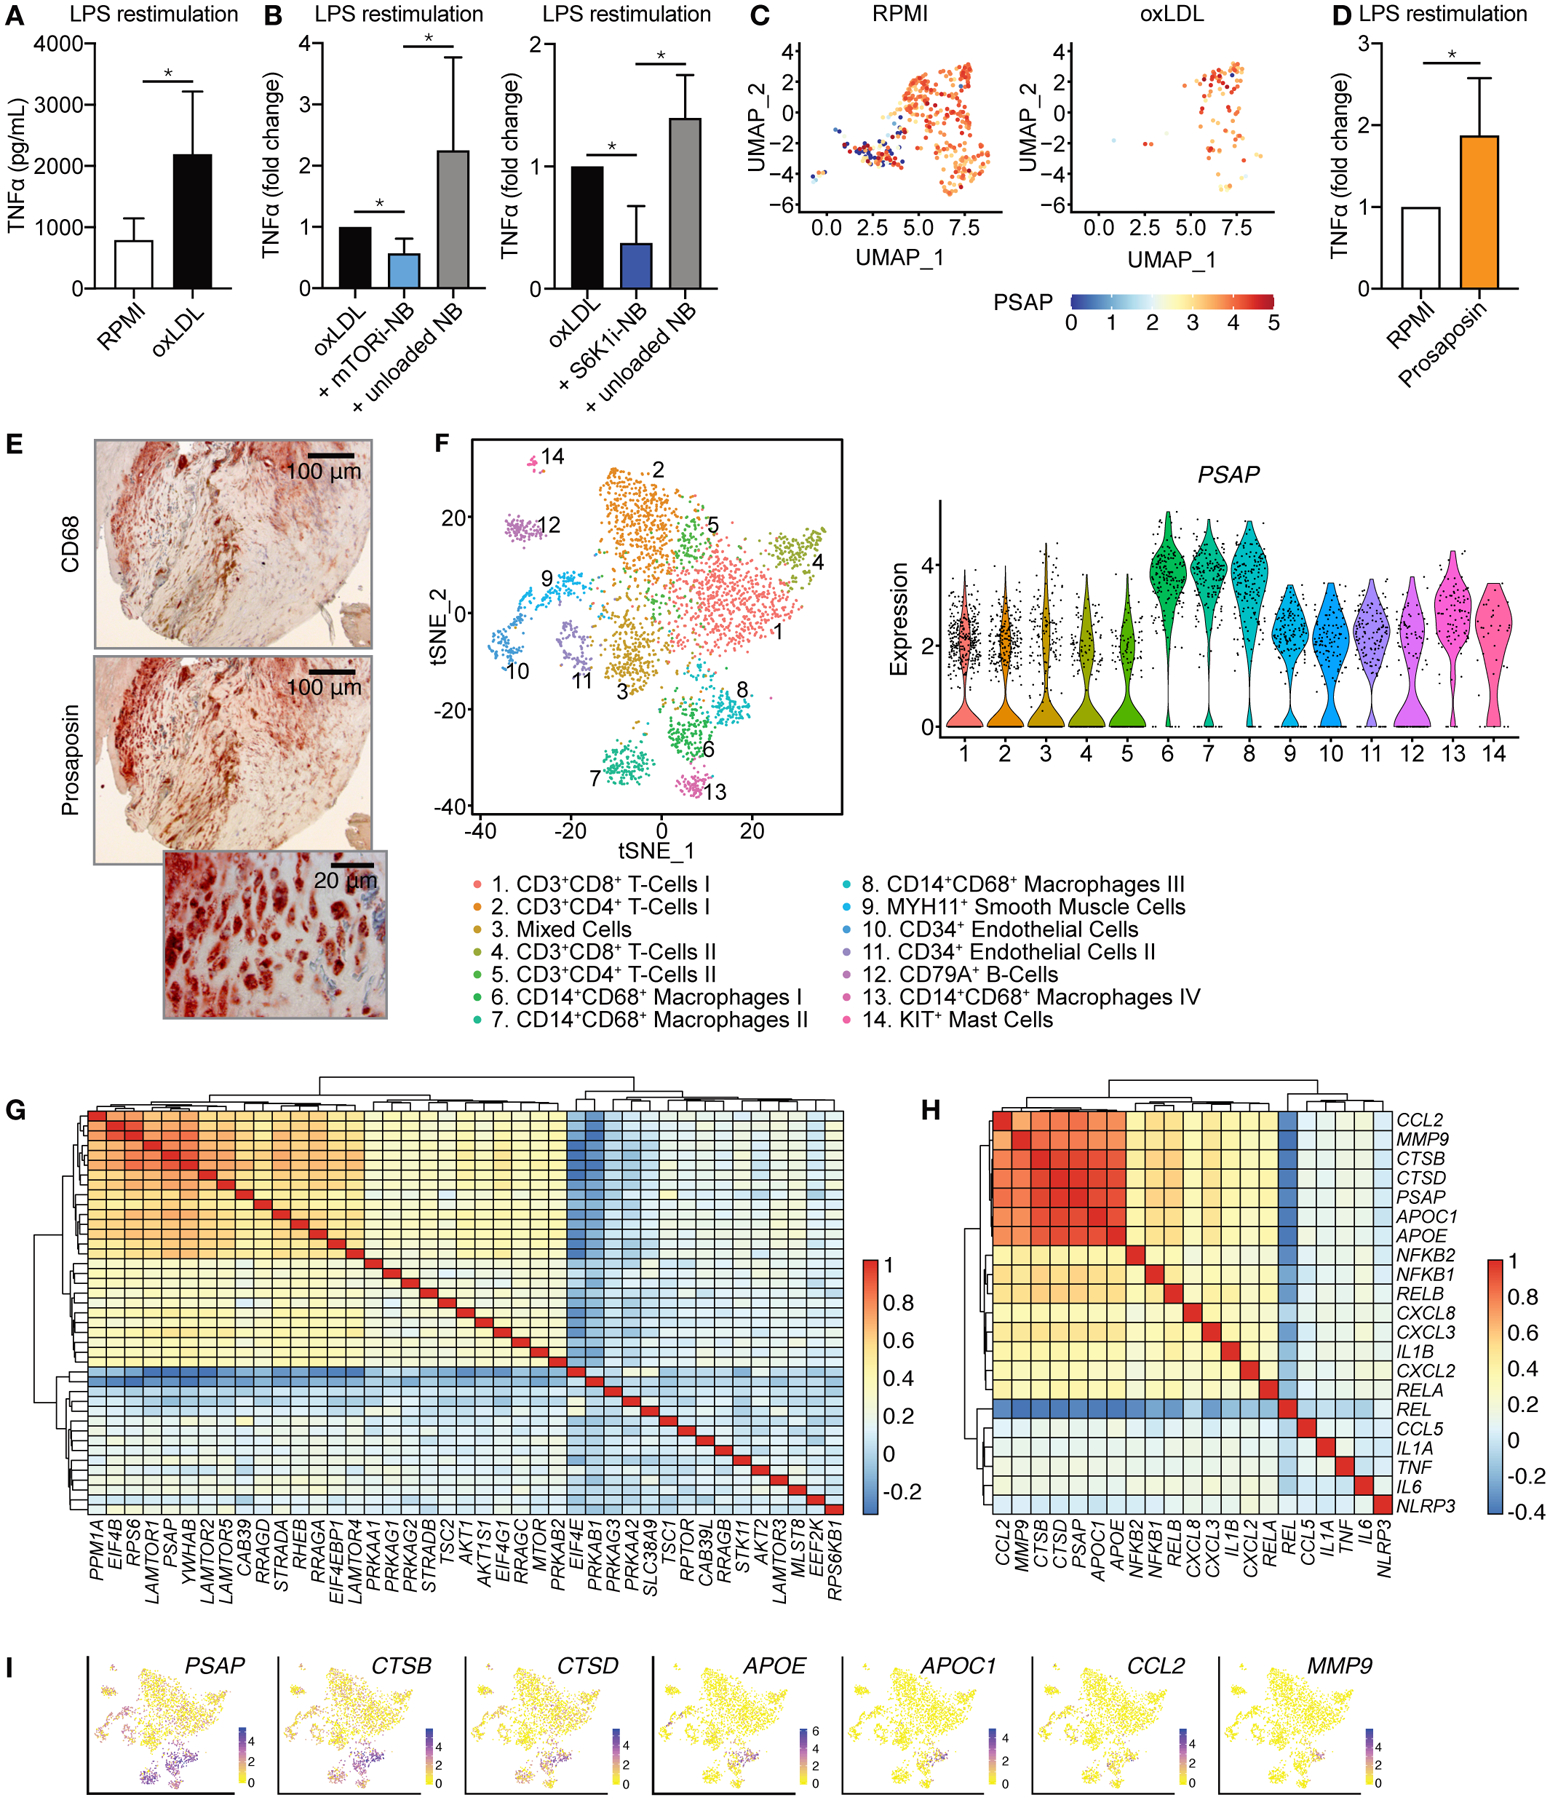
Macrophages play a central role in the pathogenesis of atherosclerosis. The inflammatory properties of these cells are dictated by their metabolism, of which the mechanistic target of rapamycin (mTOR) signaling pathway is a key regulator. Using myeloid cell-specific nanobiologics in apolipoprotein E-deficient (Apoe -/-) mice, we found that targeting the mTOR and ribosomal protein S6 kinase-1 (S6K1) signaling pathways rapidly diminished plaque macrophages' inflammatory activity. By investigating transcriptome modifications, we identified Psap, a gene encoding the lysosomal protein prosaposin, as closely related with mTOR signaling. Subsequent in vitro experiments revealed that Psap inhibition suppressed both glycolysis and oxidative phosphorylation. Transplantation of Psap -/- bone marrow to low-density lipoprotein receptor knockout (Ldlr -/-) mice led to a reduction in atherosclerosis development and plaque inflammation. Last, we confirmed the relationship between PSAP expression and inflammation in human carotid atherosclerotic plaques. Our findings provide mechanistic insights into the development of atherosclerosis and identify prosaposin as a potential therapeutic target.


Figures

Fig. 1.
Fig. 1.. Myeloid-specific mTOR inhibition reduces atherosclerotic plaque inflammation.
Apoe−/− mice were fed a Western diet for 12 weeks, followed by 1 week of treatment, while continuing the diet. Treatment consisted of 4 intravenous injections of PBS, mTORi-NB (rapamycin at 5 mg/kg), S6K1i-NB (PF-4708671 at 5 mg/kg) or unloaded nanobiologics (NB, at a comparable dose). See schematic in (A). (B) Representative images of H&E-stained aortic roots, scale bar = 250 μm. (C) Histologic quantification of plaque area at set distances from the aortic root, presented as mean ± SEM (n = 6–10 mice/group). (D) Lesion volume was calculated as area under the curve in C. (E) Representative Mac3-stained aortic roots (scale bar = 250 μm) and (F) quantification of Mac3+ area of treated mice (n = 6–10 mice/group). (G) Representative flow cytometry plots and quantification of CD11b+Lin cells, macrophages (CD11b+Lin CD11cF4/80+Ly6Clo) and Ly6Chi monocytes (CD11b+LinCD11cF4/80Ly6Chi) in the aorta (n = 8–10 mice/group). (H) FMT/CT imaging of protease activity in the aortic root of PBS or mTORi-NB-treated mice (n = 8–10 mice/group). Experiments were performed once. Data are presented as mean ± SD unless otherwise stated. ANOVA with Dunnett’s correction was used in D, non-parametric Mann-Whitney U tests were applied in F, G and H. *P < 0.05, **P < 0.01, ***P < 0.001, ****P < 0.0001.
Fig. 2.
Fig. 2.. Effect of mTOR inhibition on plaque macrophage transcriptome.
Transcriptome analysis was performed on CD68+ cells isolated from aortic roots of Apoe/− mice after mTORi-NB (A,B,E,G) or S6K1i-NB (C,D,F,H) treatment, as compared to PBS. (n = 8–10 mice/group). (A,C) Topological overlap matrix. Each row and column of the heatmap represent a single gene, with the color intensity indicating the network connection strength. The dendrograms on the upper and left sides show the hierarchical clustering tree of genes. (B,D) The fifteen modules with the highest connectivity are ordered by size (outer ring). The inner ring shows differentially expressed genes within a module, as a percentage of total number of differentially expressed genes. (E,F) Volcano plot of genes within the turquoise module with the highest connectivity. Hub gene are identified based on p-value and fold change. The up- and downregulated hub genes are shown in red and blue, respectively. (G,H) Multiscale embedded gene co-expression network analysis (MEGENA) of the turquoise module. Up- and downregulated genes are shown in red and blue, respectively. (I,J) Apoe−/− mice were fed a Western diet for 12 weeks, followed by 1 week of treatment, while kept on a Western diet. Treatment consisted of 4 intravenous injections of PBS, mTORi-NB (rapamycin at 5 mg/kg), S6K1i-NB (PF-4708671 at 5 mg/kg) or unloaded nanobiologics (NB, at a comparable dose). Aortic roots were harvested for histological analysis. (I) Representative images of prosaposin staining of the aortic root and (J) quantification of prosaposin-positive areas within the plaque (n = 6–10 mice/group). Experiments were performed once. Data are presented as mean ± SD, non-parametric Mann-Whitney U test was used in J. *P < 0.05, ***P < 0.001, ****P < 0.0001.
Fig. 3.
Fig. 3.. Psap affects immunometabolism.
(A–B) Murine bone marrow-derived macrophages were incubated with Psap small interfering RNA lipid nanoparticles (Psap siRNA-LNPs) or control (Ctrl) siRNA-LNPs and subjected to a metabolic assay (n = 10 wells/condition). Maximal glycolytic capacity (A) and maximal respiratory capacity (B) of murine bone marrow-derived macrophages. (C–D) Murine bone marrow-derived macrophages were incubated with mTOR or S6K1 inhibitors (both 20 μM) and subjected to a metabolic assay (n = 6 wells/condition). Maximal glycolytic capacity (C) and maximal respiratory capacity (D). Experiments were performed once. Line graphs are presented as mean ± SEM, bar graphs are presented as mean ± SD, non-parametric Mann-Whitney U tests were used. **P < 0.01, ****P < 0.0001. Gluc, glucose; OM, oligomycin; FCCP, carbonyl cyanide 4-(trifluoromethoxy)phenylhydrazone; Rot/AA, roterone/antimycinA; ECAR, extracellular acidification rate; OCR, oxygen consumption rate.
Fig. 4.
Fig. 4.. Psap mediates atherosclerotic plaque inflammation in Ldlr−/− mice.
Ldlr−/− mice were lethally irradiated and transplanted with Psap+/+ or Psap−/− bone marrow cells. Mice were left to reconstitute for 6 weeks after which they were put on a Western diet for 11 weeks (n = 10 mice/group for all panels). (A) Schematic of experimental setup. (B) Representative images of H&E-stained aortic roots. (C) Histologic quantification of plaque area at set distances from the aortic root, presented as mean ± SEM. (D) Lesion volume was calculated as area under the curve in C. (E) Representative images of Sirius red-stained aortic roots. (F) Histologic quantification of plaque collagen content. (G) Representative flow cytometry plots and (H) quantification of CD11b+Lin cells, macrophages (CD11b+LinCD11cF4/80+Ly6Clo) and Ly6Chi monocytes (CD11b+Lin CD11cF4/80Ly6Chi) in the aorta. Quantification of Ly6Clo and Ly6Chi monocytes in the bone marrow (I), spleen (J) and blood (K). Experiments were performed once. Data are presented as mean ± SD unless otherwise stated, non-parametric Mann-Whitney U tests were used. *P < 0.05, ****P < 0.0001.
Fig. 5.
Fig. 5.. PSAP mediates atherosclerotic plaque inflammation in humans.
(A-D) Human primary monocytes were incubated with oxidized LDL (oxLDL) or prosaposin for 24 hours. Media only (RPMI) was used as control. After a 5-day rest, cells were restimulated with LPS. (A) TNFα production upon LPS stimulation, as measured by ELISA (n = 6). (B) TNFα production of human monocytes primed with oxLDL in combination with mTORi-NB or S6K1i-NB as compared to unloaded NB or oxLDL only (n = 6). (C) Single cell transcriptome analysis of adherent human monocytes after oxLDL priming and LPS restimulation. Uniform Manifold Approximation and Projection (UMAP) plot shows the different monocyte clusters and PSAP expression is shown for each cell (n = 3). (D) Human monocytes were primed with prosaposin or RPMI (negative control) for 24 hours. After a 5-day rest, cells were restimulated with LPS and TNFα production was measured by ELISA, (n = 5). (E) Representative images of CD68 (top) and prosaposin (middle and bottom) staining on a human carotid endarterectomy sample (n = 4, see also fig. S7). (F) Single-cell RNA sequencing of human atherosclerotic plaques identifies 14 leukocyte subsets. (n = 18). (G,H) Transcriptomic analyses were performed on human atherosclerotic plaques (n = 620). Heatmap depicting co-expression of PSAP and genes involved in (G) the mTOR signaling pathway or (H) atherosclerotic plaque macrophages, clustered based on co-expression values. (I) Expression of 6 inflammatory genes, as compared to PSAP expression, based on single-cell RNA sequencing, also presented in (F). Experiments were performed once. Bar graphs are presented as mean ± SD, Wilcoxon signed-rank test were used in A, B and D. *P < 0.05.

References

    1. Tabas I, Lichtman AH, Monocyte-Macrophages and T Cells in Atherosclerosis, Immunity 47, 621–634 (2017). - PMC - PubMed
    1. O’Neill LAJ, Kishton RJ, Rathmell J, A guide to immunometabolism for immunologists, Nat. Rev. Immunol 16, 553–565 (2016). - PMC - PubMed
    1. Ketelhuth DFJ, Lutgens E, Bäck M, Binder CJ, Van Den Bossche J, Daniel C, Dumitriu IE, Hoefer I, Libby P, O’Neill L, Weber C, Evans PC, Immunometabolism and atherosclerosis: Perspectives and clinical significance: A position paper from the Working Group on Atherosclerosis and Vascular Biology of the European Society of Cardiology, Cardiovasc. Res 115, 1385–1392 (2019). - PMC - PubMed
    1. Koelwyn GJ, Corr EM, Erbay E, Moore KJ, Regulation of macrophage immunometabolism in atherosclerosis, Nat. Immunol 19, 526–537 (2018). - PMC - PubMed
    1. Tomas L, Edsfeldt A, Mollet IG, Matic LP, Prehn C, Adamski J, Paulsson-Berne G, Hedin U, Nilsson J, Bengtsson E, Gonçalves I, Björkbacka H, Altered metabolism distinguishes high-risk from stable carotid atherosclerotic plaques, Eur. Heart J 39, 2301–2310 (2018). - PMC - PubMed

Publication types