. 2021 Mar 10;12(1):1565.
doi: 10.1038/s41467-021-21865-2.

Single cell transcriptomic analysis of murine lung development on hyperoxia-induced damage

Affiliations

Single cell transcriptomic analysis of murine lung development on hyperoxia-induced damage

Maria Hurskainen et al. Nat Commun. .

Abstract

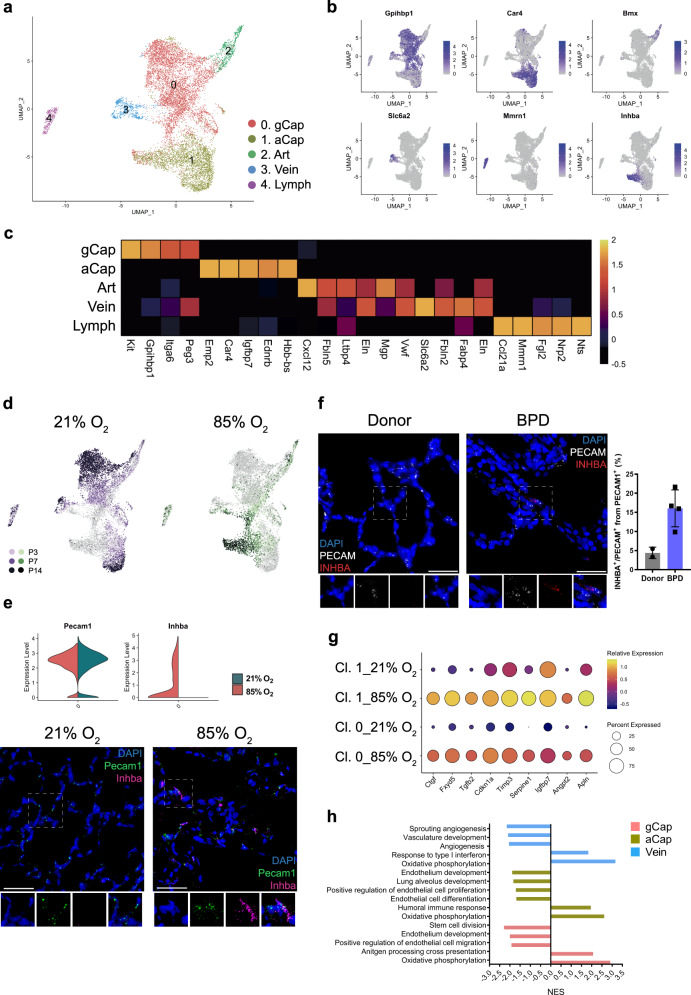
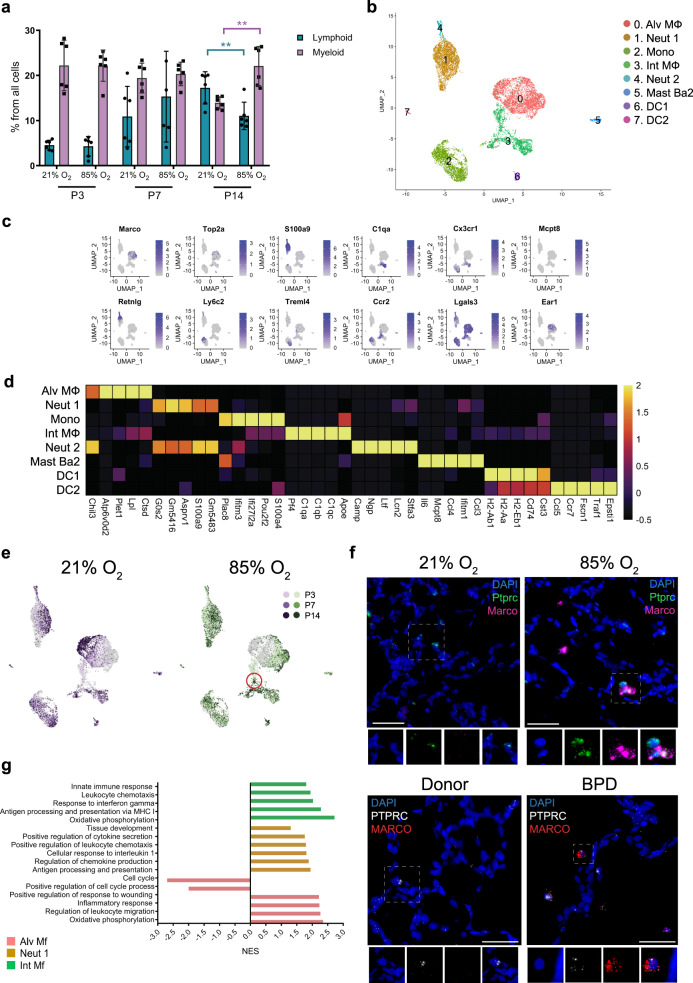
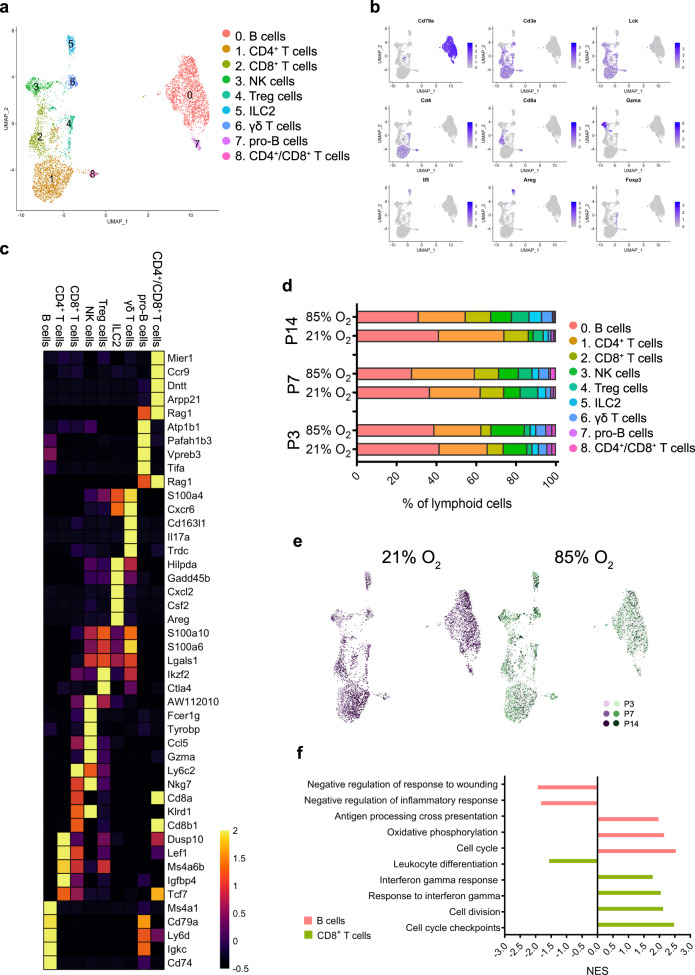
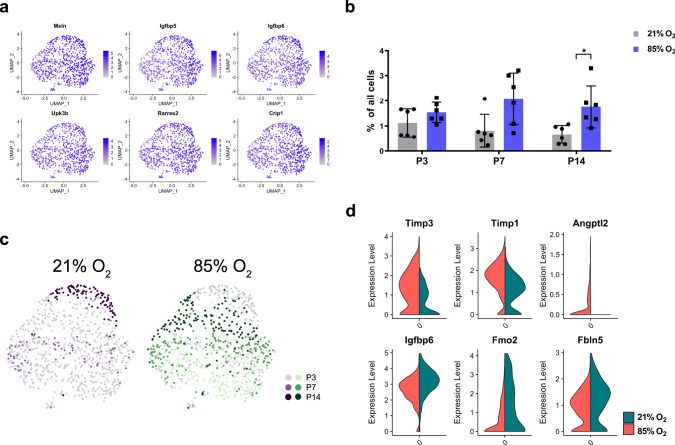
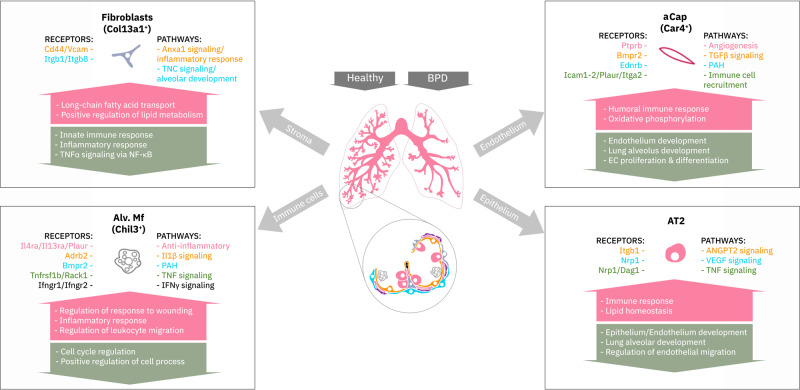
During late lung development, alveolar and microvascular development is finalized to enable sufficient gas exchange. Impaired late lung development manifests as bronchopulmonary dysplasia (BPD) in preterm infants. Single-cell RNA sequencing (scRNA-seq) allows for assessment of complex cellular dynamics during biological processes, such as development. Here, we use MULTI-seq to generate scRNA-seq profiles of over 66,000 cells from 36 mice during normal or impaired lung development secondary to hyperoxia with validation of some of the findings in lungs from BPD patients. We observe dynamic populations of cells, including several rare cell types and putative progenitors. Hyperoxia exposure, which mimics the BPD phenotype, alters the composition of all cellular compartments, particularly alveolar epithelium, stromal fibroblasts, capillary endothelium and macrophage populations. Pathway analysis and predicted dynamic cellular crosstalk suggest inflammatory signaling as the main driver of hyperoxia-induced changes. Our data provides a single-cell view of cellular changes associated with late lung development in health and disease.


Conflict of interest statement

The authors declare no competing interests.

Figures

Fig. 1
Fig. 1. Exposure to hyperoxia induced an arrest in alveolarization in the developing mouse lung.
a Mouse pups were exposed from day of birth to room air (21% O2, gray) or hyperoxia (85%O2, blue). A total of 36 lungs were harvested on postnatal days (P)3, 7, and 14. n = 6/group. b Representative histological sections from lungs developing in 21% O2 (black circles) or 85% O2 (purple squares) at P3, P7, and P14. Seven animals/group were evaluated. Scale bar = 200 µm. c Body weight was assessed at P3, P7, and P14. Lung volume was assessed by Archimedes principle at P7 and P14. Precise measurements at P3 were not possible due to the small size of the organ. Lung morphometry was quantified by the mean linear intercept (MLI) measurement. Data are presented as means ± SD. Statistical analyses were performed with GraphPad Prism 8.0. The presence of potential statistical outliers was determined by Grubbs’ test. Significance was evaluated by multiple unpaired Student’s t-test with Holm–Sidak correction. P values **** = <0.0001. n = 7 animals/group.
Fig. 2
Fig. 2. Map of cellular composition in normal and hyperoxia-impaired late murine lung development.
a UMAP plot of all scRNA-seq data, showing a total of 34 distinct cell types that were identified. b UMAP plots showing expression levels for canonical markers of epithelial, mesenchymal, endothelial, immune, and mesothelial populations. The intensity of expression is indicated by purple coloring. c UMAP plots of normally (21% O2-exposed; left) and aberrantly (85% O2-exposed; right) developing lungs. Each cell is colored by mouse age as indicated by the legend. d Cluster distribution in lungs of normally and aberrantly developing mice at P3, P7, and P14. n = 6 animals/group. e Circos plot showing inferred cell communications. Cell types in the top right correspond to those with the largest changes in response to hyperoxia. These cell types are connected to the cell types expressing ligands predicted to promote this response. Ligands expressed by the same cell population are colored the same. Expression levels in UMAP plots are presented as log(TP10k + 1) values. Log(TP10k + 1) corresponds to log-transformed UMIs per 10k. Cell populations in a and d are colored as indicated by the legend in d.
Fig. 3
Fig. 3. Cellular composition of epithelial cells during normal and hyperoxia-impaired late murine lung development.
a A total of five clusters of epithelial cells were identified in developing lungs. Cell populations are colored as indicated by the legend. b UMAP plots showing expression of principal identifiers of different epithelial cell types. The intensity of expression is indicated by purple coloring. c Heatmap of top five most differentially expressed genes across epithelial clusters. The intensity of expression is indicated as specified by the color legend. d Violin plots depicting changes in gene expression of some normoxia (21% O2, green) and hyperoxia-specific (85% O2, red) genes in the two AT2 clusters at P14. e Representative images from fluorescent RNA in situ hybridization for AT2-Lyz1+ marker Lyz1 (white) and pan-AT2 marker Sftpc (red) in developing mouse lungs. Magnification: 40×. Scale bar = 40 µm. Three 14-days old animals/group were analyzed. f UMAP plots depicting cell identity in regard to developmental time points in normally (purple) and aberrantly (green) developing lung epithelium. The intensity of expression is indicated as specified by the color legend. g Selected hyperoxia-impacted signaling pathways in AT2 (purple) and AT2-Lyz1+ (pink) clusters, as identified by gene set enrichment analysis (GSEA). All terms are significantly enriched (adjusted p value < 0.05) and normalized enrichment scores (NES) are shown. NES values were computed by gene set enrichment analysis on fold change-ranked genes. Expression values in Heatmap and violin plots represent Z-score-transformed log(TP10k + 1) values. Expression levels in UMAP plots are presented as log(TP10k + 1) values. Log(TP10k + 1) corresponds to log-transformed UMIs per 10k.
Fig. 4
Fig. 4. Cellular composition of stromal cells during normal and hyperoxia-impaired late lung development.
a A total of six clusters of stromal cells were identified in developing lungs. Cell populations are colored as indicated by the legend. b UMAP plots showing expression of principal identifiers of different stromal cell types. The intensity of expression is indicated by purple coloring. c Heatmap of top five most differentially expressed genes across stromal clusters. The intensity of expression is indicated as specified by the color legend. d UMAP plots depicting cell identity in regard to developmental time points in normally (purple) and aberrantly (green) developing lung endothelium. The intensity of expression is indicated as specified by the color legend. e Dotplot depicting expression of oxygen-specific markers in Col13a1+ fibroblasts at P14. The intensity of expression is indicated by the color legend. Size of the cell population expressing the gene of interest is indicated by the size of the circle as specified by the legend. f Fluorescent RNA in situ hybridization showing co-expression of Inmt (pink) and Saa3 (pink) with Col13a1 (green) in normal and aberrant mouse lungs. Magnification: 40×. Scale bar = 40 µm. Two 14-days old animals/group were analyzed. g Dotplot depicting expression of oxygen-specific markers in Myofib. cluster at P14. The intensity of expression is indicated by the color legend. Size of the cell population expressing the gene of interest is indicated by the size of the circle as specified by the legend. h Selected hyperoxia-impacted signaling pathways in Col13a1+ fib (pink), Myofib. (yellow), and Pericytes 2 (blue) clusters as identified by gene set enrichment analysis (GSEA). All terms are significantly enriched (adjusted p value < 0.05) and normalized enrichment scores (NES) are shown. NES values were computed by gene set enrichment analysis on fold change-ranked genes. Expression values in Heatmap and violin plots represent Z-score-transformed log(TP10k + 1) values. Expression levels in UMAP plots and Dotplots are presented as log(TP10k + 1) values. Log(TP10k + 1) corresponds to log-transformed UMIs per 10k.
Fig. 5
Fig. 5. Cellular composition of lung endothelium during normal and hyperoxia-impaired late lung development.
a A total of five clusters of endothelial cells were identified in developing lungs. Cell populations are colored as indicated by the legend. b UMAP plots of principal identifiers of different types of endothelial cells. The intensity of expression is indicated by purple coloring. c Heatmap of top 5 most differentially expressed genes across endothelial clusters. The intensity of expression is indicated as specified by the color legend. d UMAP plots depicting cell identity in regards to developmental time points in normally (purple) and aberrantly (green) developing lung endothelium. The intensity of expression is indicated as specified by the color legend. Violin plots depicting changes in gene expression of Pecam and Inhba in normoxia (21% O2, green) and hyperoxia-specific (85% O2, red) at P14. e Representative images from fluorescent RNA in situ hybridization for hyperoxia-specific marker Inhba (pink) and pan-endothelial marker Pecam (green) in developing mouse lungs. Magnification: 40×. Scale bar = 40 µm. Two 14-days old animals/group were analyzed. f Representative images and quantitative analysis of fluorescent RNA in situ hybridization for hyperoxia-specific marker INHBA (red) and pan-endothelial marker PECAM (white) in BPD patients’ and donors’ lungs. Samples from five BPD patients and two donor lungs were analyzed. For quantitative analysis, cells in 15 randomly chosen fields of view/sample were analyzed. Magnification: 40×. Scale bar = 40 µm. g Dot plot depicting hyperoxia-induced changes in the expression of inflammatory, anti-angiogenic and protective genes in capillary cells at P14. The intensity of expression is indicated by the color legend. Size of the cell population expressing the gene of interest is indicated by the size of the circle as specified by the legend. h Hyperoxia-impacted signaling pathways in gCap (pink), aCap (yellow), and Vein (blue) clusters, as identified by gene set enrichment analysis (GSEA). All terms are significantly enriched (adjusted p value < 0.05) and normalized enrichment scores (NES) are shown. NES values were computed by gene set enrichment analysis on fold change-ranked genes. Expression values in Heatmap represent Z-score-transformed log(TP10k + 1) values. Expression levels in UMAP plots and Dotplots are presented as log(TP10k + 1) values. Log(TP10k + 1) corresponds to log-transformed UMIs per 10k.
Fig. 6
Fig. 6. Cellular composition of lung myeloid populations during normal and hyperoxia-impaired late lung development.
a The relative proportion of myeloid (purple) and lymphoid (teal) cells in developing lungs was significantly impacted by hyperoxia exposure. n = 6 animals/group. Data are presented as means ± SD. Statistical analyses were performed with GraphPad Prism 8.0. Significance for each population at each time point was evaluated by unpaired, two-tailed Student’s t-test. P value = 0.0013 for Myeloid population, and 0.0086 for Lymphoid population. b A total of eight clusters of myeloid cells were identified in developing lungs. Cell populations are colored as indicated by the legend. c UMAP plots of principal identifiers of different types of myeloid cells. The intensity of expression is indicated by purple coloring. d Heatmap of top five most differentially expressed genes across myeloid clusters. The intensity of expression is indicated as specified by the color legend. e UMAP plots depicting cell identity of myeloid cells in regard to developmental time points in normally (21% O2-exposed, purple) and aberrantly (85% O2-exposed, green) developing lung. Each cell is colored by mouse age as indicated by the legend. f Fluorescent RNA in situ hybridization showing co-expression of Marco/MARCO (pink/red) with Ptprc/PTPRC (green/white) positive leukocytes morphologically resembling alveolar macrophages in normal and mouse hyperoxic/human BPD lungs, respectively. Magnification: 40×. Scale bar = 40 µm. Two 14-days old animals/group were analyzed and samples from five BPD patients and two donor lungs were analyzed. g Hyperoxia-impacted signaling pathways in Alv Mf (pink), Neut 1 (yellow) and Int Mf (green) clusters as identified by gene set enrichment analysis (GSEA). All terms are significantly enriched (adjusted p value < 0.05) and normalized enrichment scores (NES) are shown. NES values were computed by gene set enrichment analysis on fold change-ranked genes. Expression values in Heatmap and violin plots represent Z-score-transformed log(TP10k + 1) values. Expression levels in UMAP plots are presented as log(TP10k + 1) values. Log(TP10k + 1) corresponds to log-transformed UMIs per 10k.
Fig. 7
Fig. 7. Cellular composition of lung lymphoid populations during normal and hyperoxia-impaired late lung development.
a A total of nine clusters of lymphoid cells were identified in developing lungs. Cell populations are colored as indicated by the legend. b UMAP plots of principal identifiers of identified types of lymphoid cells The intensity of expression is indicated by purple coloring. c Heatmap of top five most differentially expressed genes across the lymphoid clusters. The intensity of expression is indicated as specified by the color legend. d Relative contribution of individual lymphoid clusters changed significantly during development and exposure to hyperoxia. n = 6 animals/group. Cell populations are colored as indicated by the legend. e UMAP plots depicting cell identity in regard to developmental time points in (21% O2-exposed, purple) normally and aberrantly (85% O2-exposed, green) developing lymphoid populations. Each cell is colored by mouse age as indicated by the legend. f Hyperoxia-impacted signaling pathways in B cells (pink) and CD8 + T cells (bright green) clusters as identified by gene set enrichment analysis (GSEA). All terms are significantly enriched (adjusted p value < 0.05) and normalized enrichment scores (NES) are shown. NES values were computed by gene set enrichment analysis on fold change-ranked genes. Expression values in Heatmap represent Z-score-transformed log(TP10k + 1) values. Expression levels in UMAP plots are presented as log(TP10k + 1) values. Log(TP10k + 1) corresponds to log-transformed UMIs per 10k.
Fig. 8
Fig. 8. Cellular composition of lung mesothelium during normal and hyperoxia-impaired late lung development.
a UMAP plots of principal identifiers of mesothelial cells in developing lung. Intensity of expression is indicated by purple coloring. b Percentual proportion of mesothelial cells in normally (21% O2-exposed, gray) and aberrantly (85% O2-exposed, purple) developing lungs at P3, P7 and P14. n = 6 animals/group. Significance was evaluated by multiple unpaired multiple Student’s t-test with Holm–Sidak correction. Data are presented as means ± SD. P value = 0.0426. c UMAP plots depicting cell identity in regard to developmental time points in (21% O2-exposed, purple) normally and aberrantly (85% O2-exposed, green) developing lung mesothelium. Each cell is colored by mouse age as indicated by the legend. d Exposure to 85% O2 altered gene expression in developing lung mesothelium. 21% O2-exposed: green, 85% O2-exposed: red. Expression values in violin plots represent Z-score-transformed log(TP10k + 1) values. Expression levels in UMAP plots are presented as log(TP10k + 1) values. Log(TP10k + 1) corresponds to log-transformed UMIs per 10k.
Fig. 9
Fig. 9. Summary of the cellular crosstalk and pathway analysis in hyperoxia-impaired late murine lung development.
Mouse lung cell subtypes with the most significant gene expression changes in hyperoxia mimicking bronchopulmonary dysplasia (BPD). Activated receptors and their involved biological pathways are indicated by the cell communication inference analysis. Biological processes in the arrows are indicated by the gene set enrichment analysis.

References

    1. Guo M, et al. Single cell RNA analysis identifies cellular heterogeneity and adaptive responses of the lung at birth. Nat. Commun. 2019;10:37. doi: 10.1038/s41467-018-07770-1. - DOI - PMC - PubMed
    1. Cohen M, et al. Lung single-cell signaling interaction map reveals basophil role in macrophage imprinting. Cell. 2018;175:1031–1044. doi: 10.1016/j.cell.2018.09.009. - DOI - PubMed
    1. Warburton D. Overview of lung development in the newborn human. Neonatology. 2017;111:398–401. doi: 10.1159/000458465. - DOI - PMC - PubMed
    1. Leong M. Genetic approaches to bronchopulmonary dysplasia. NeoRev. 2019;20:e272–e279. doi: 10.1542/neo.20-5-e272. - DOI - PubMed
    1. Lal CV, Ambalavanan N. Genetic predisposition to bronchopulmonary dysplasia. Semin. Perinatol. 2015;39:584–591. doi: 10.1053/j.semperi.2015.09.004. - DOI - PMC - PubMed

Publication types

Grants and funding