. 2021 Mar 10;11(1):5616.
doi: 10.1038/s41598-021-85146-0.

Traits and risk factors of post-disaster infectious disease outbreaks: a systematic review

Affiliations

Traits and risk factors of post-disaster infectious disease outbreaks: a systematic review

Gina E C Charnley et al. Sci Rep. .

Abstract

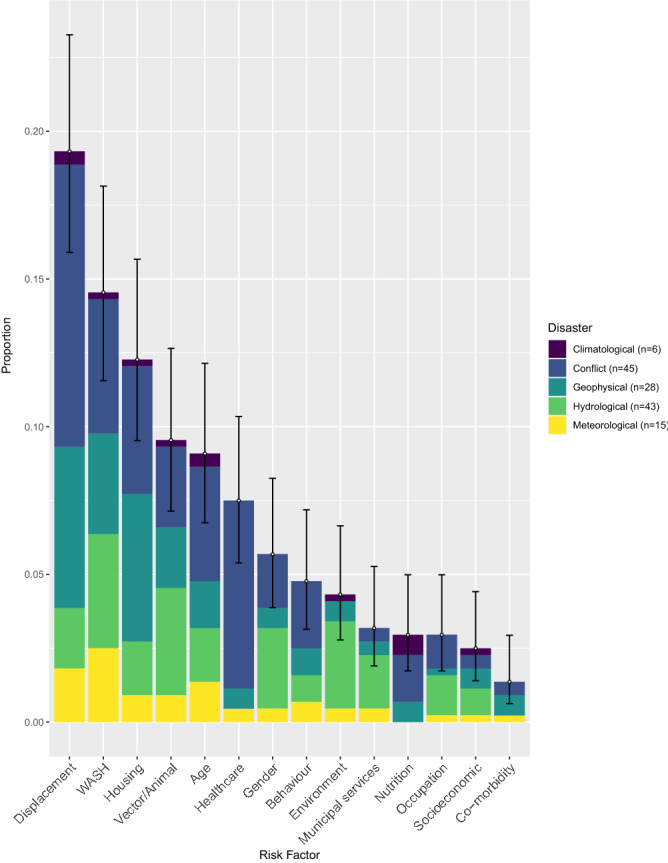
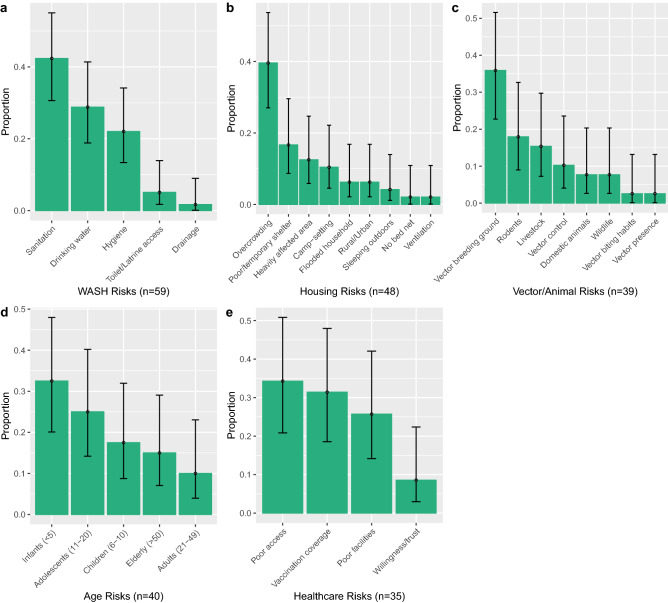
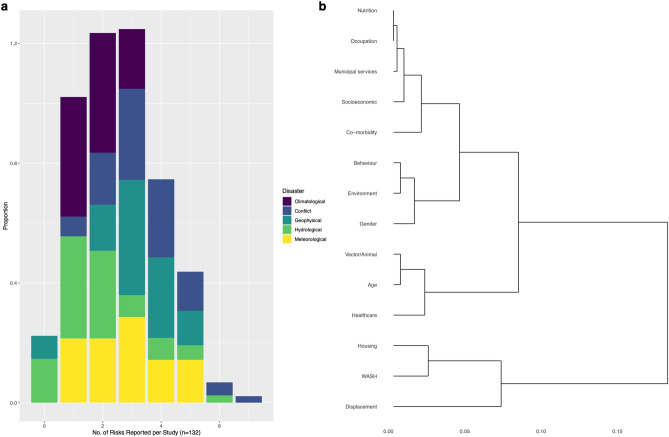
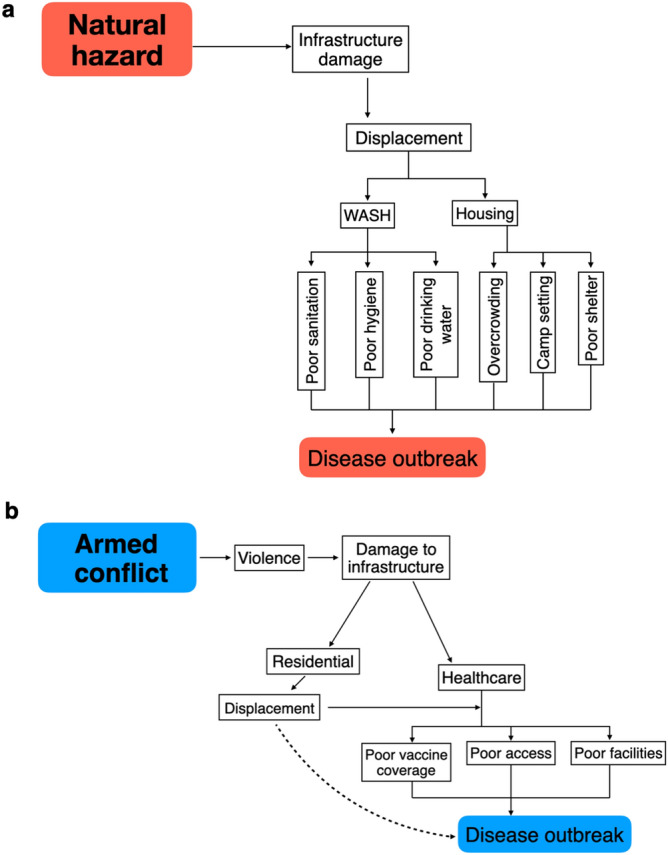
Infectious disease outbreaks are increasingly recognised as events that exacerbate impacts or prolong recovery following disasters. Yet, our understanding of the frequency, geography, characteristics and risk factors of post-disaster disease outbreaks globally is lacking. This limits the extent to which disease outbreak risks can be prepared for, monitored and responded to following disasters. Here, we conducted a global systematic review of post-disaster outbreaks and found that outbreaks linked to conflicts and hydrological events were most frequently reported, and most often caused by bacterial and water-borne agents. Lack of adequate WASH facilities and poor housing were commonly reported risk factors. Displacement, through infrastructure damage, can lead to risk cascades for disease outbreaks; however, displacement can also be an opportunity to remove people from danger and ultimately protect health. The results shed new light on post-disaster disease outbreaks and their risks. Understanding these risk factors and cascades, could help improve future region-specific disaster risk reduction.


Conflict of interest statement

The authors declare no competing interests.

Figures

Figure 1
Figure 1
Preferred Reporting Items for Systematic Reviews and Meta-Analysis (PRISMA) diagram for the selected 132 studies on post-disaster disease outbreaks.
Figure 2
Figure 2
Frequency of reported post-disaster disease outbreaks by country for each 137 separate disaster events found in the literature search.
Figure 3
Figure 3
Proportion of reported post-disaster outbreaks by (a), region against the 137 separate disasters, (b), the 140 separate disease outbreaks by pathogen type against disaster and (c), the 140 separate disease outbreaks by transmission against disaster with binomial confidence intervals (95%). LAC – Latin America and the Caribbean.
Figure 4
Figure 4
Correlation plots for the Pearson’s chi squared test residuals for each catagories in a, region against disaster (X-squared = 101.81, df = 28, P-value ≤ 0.05), b, disease against disaster (X-squared = 31.49, df = 12, P-value ≤ 0.05) and c, disease transmission against disaster (X-squared = 47.31, df = 16, P-value ≤ 0.05). Positive residuals are blue, suggesting a positive association between the corresponding row and column and negative residuals are red, suggesting a negative association.
Figure 5
Figure 5
Proportions of the fourteen main risk factor clusters out of the 418 risk factors reported in the search results, against disaster, with binomial confidence intervals (95%). WASH—Water, sanitation & hygiene.
Figure 6
Figure 6
The most commonly reported risk factor clusters (a), WASH, (b), Housing (c), Vectors/Animals (d), Age and (e), Healthcare, split into the proportion of individual reported risk factors, with binomial confidence intervals (95%). Although displacement was the highest, it was not included as it had few elements within the cluster.
Figure 7
Figure 7
Multi-risk reporting and hierarchical clustering. (a), Proportions of studies (n = 132) which reported either 0 to 7 different risk factors, within the fourteen main clusters. (b), cluster dendrogram from hierarchical cluster analysis for the fourteen main risk factor clusters. Individual segments (leaves) on the lower part of the tree are more related to each other, as indicated by distances between the branches. The scale bar showing the dissimilarity distance between the proportions of each risk cluster.
Figure 8
Figure 8
Shows an example of cascading risk factors for (a), natural hazards and (b), armed conflicts. The dashed line between displacement and disease outbreaks in 8b represents the authors understanding that displacement does not directly lead to disease outbreaks, but instead the conditions it creates.

References

    1. World Health Organization. The top 10 causes of death (2018). https://www.who.int/news-room/fact-sheets/detail/the-top-10-causes-of-death. Accessed 19 June 2020.
    1. World Health Organization. Disease outbreaks (2020). https://www.who.int/ environmental_health_emergencies/disease_outbreaks/en/. Accessed 6 December 2019.
    1. Cohen ML. Changing patterns of infectious disease. Nature. 2000;406:762–767. doi: 10.1038/35021206. - DOI - PubMed
    1. Al-Shere TA, et al. Outbreak of leptospirosis after flood, the Philippines, 2009. Emerg. Infect. Dis. 2012;18:91. doi: 10.3201/eid1801.101892. - DOI - PMC - PubMed
    1. Bompangue D, et al. Cholera epidemics, war and disasters around Goma and Lake Kivu: an eight-year survey. PLoS Neglect. Trop. D. 2009;3:51. doi: 10.1371/journal.pntd.0000436. - DOI - PMC - PubMed

Publication types