. 2021 Apr;592(7852):105-109.
doi: 10.1038/s41586-021-03316-6. Epub 2021 Mar 10.

Pattern-recognition receptors are required for NLR-mediated plant immunity

Affiliations

Pattern-recognition receptors are required for NLR-mediated plant immunity

Minhang Yuan et al. Nature. 2021 Apr.

Abstract

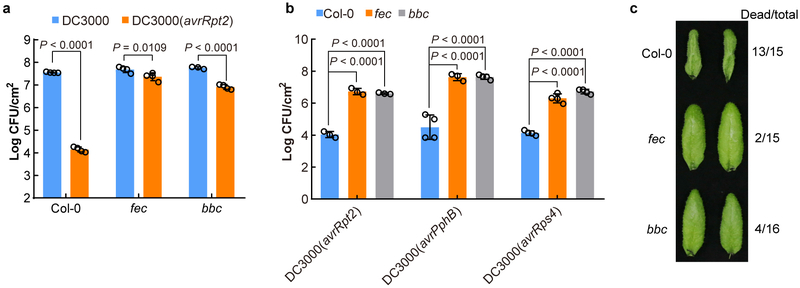
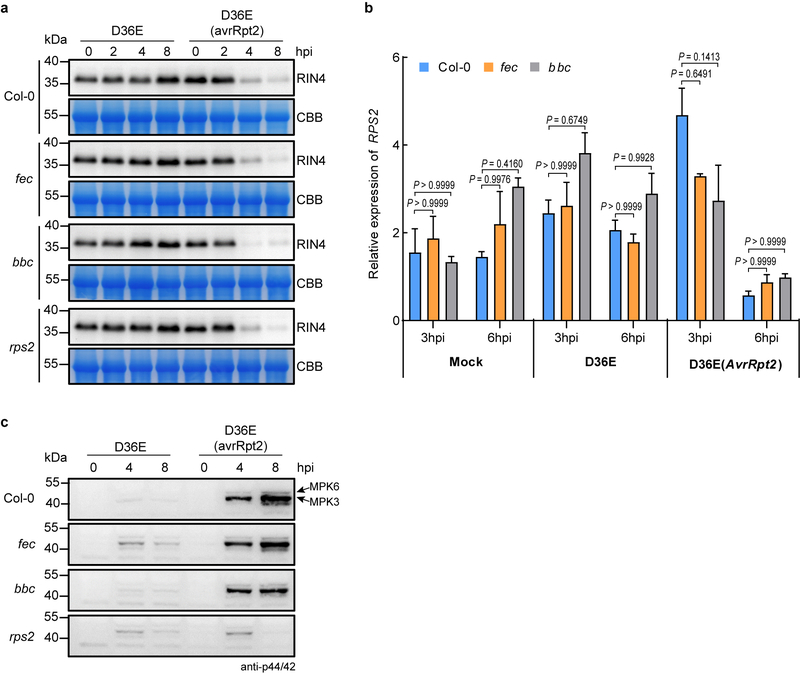
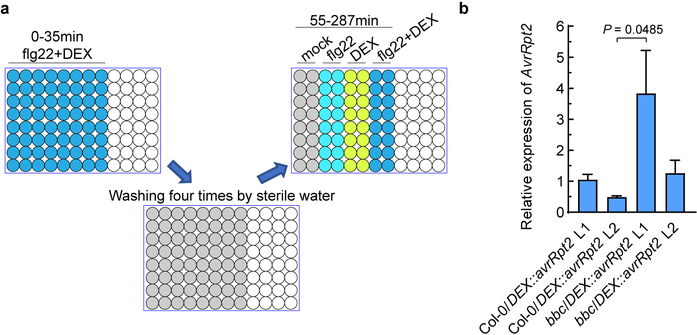
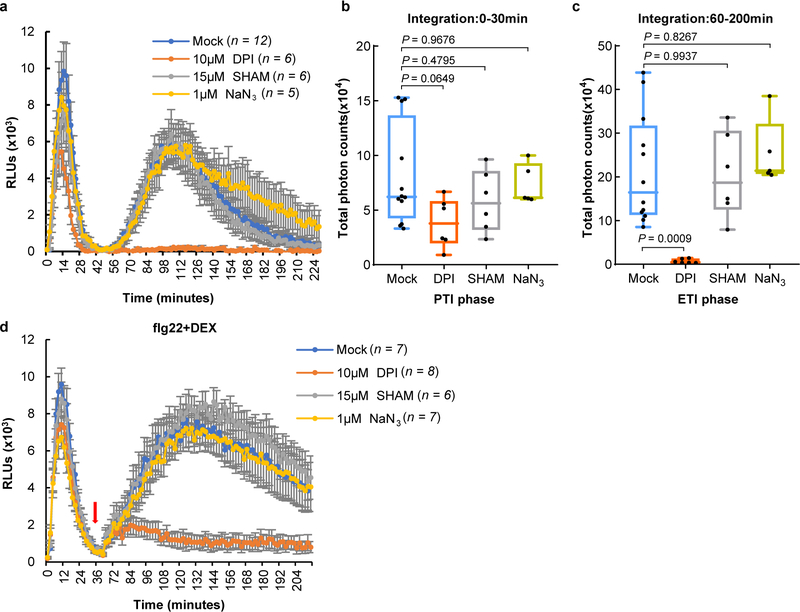
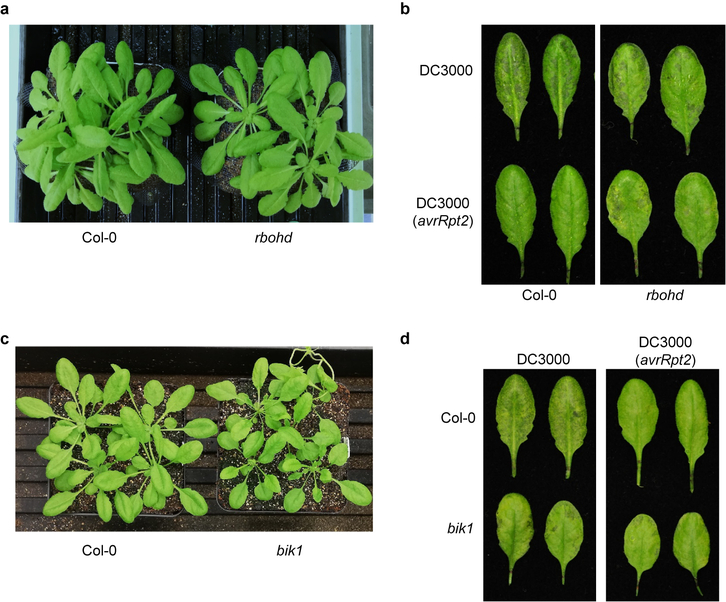
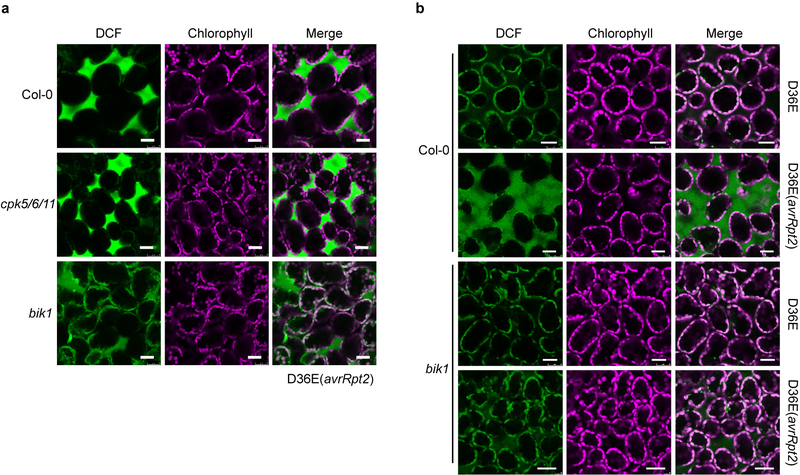
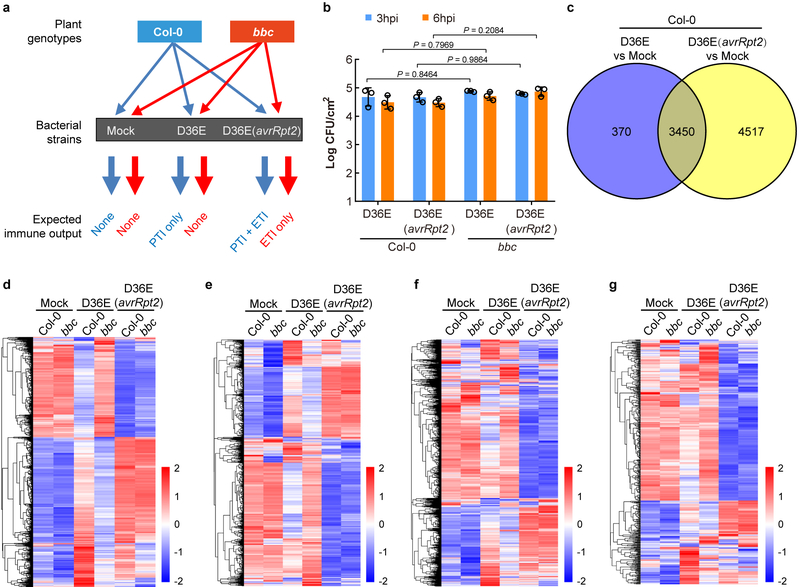
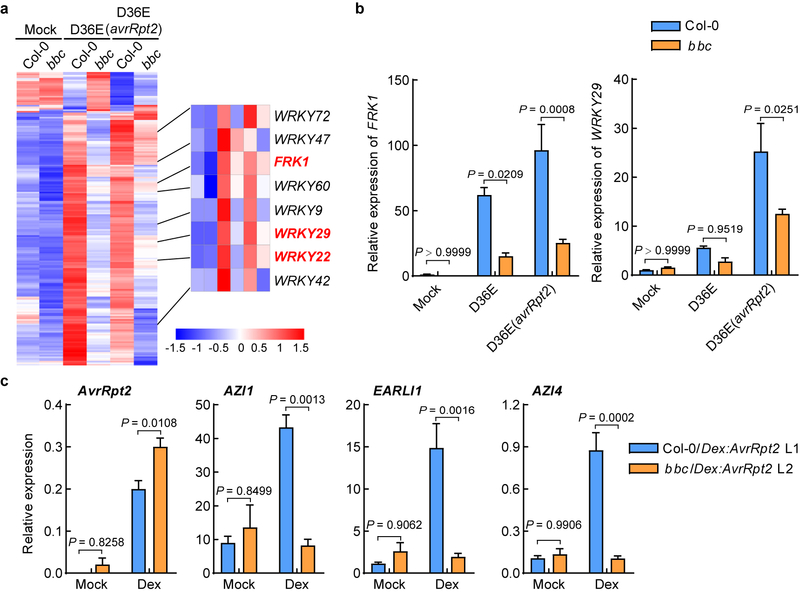
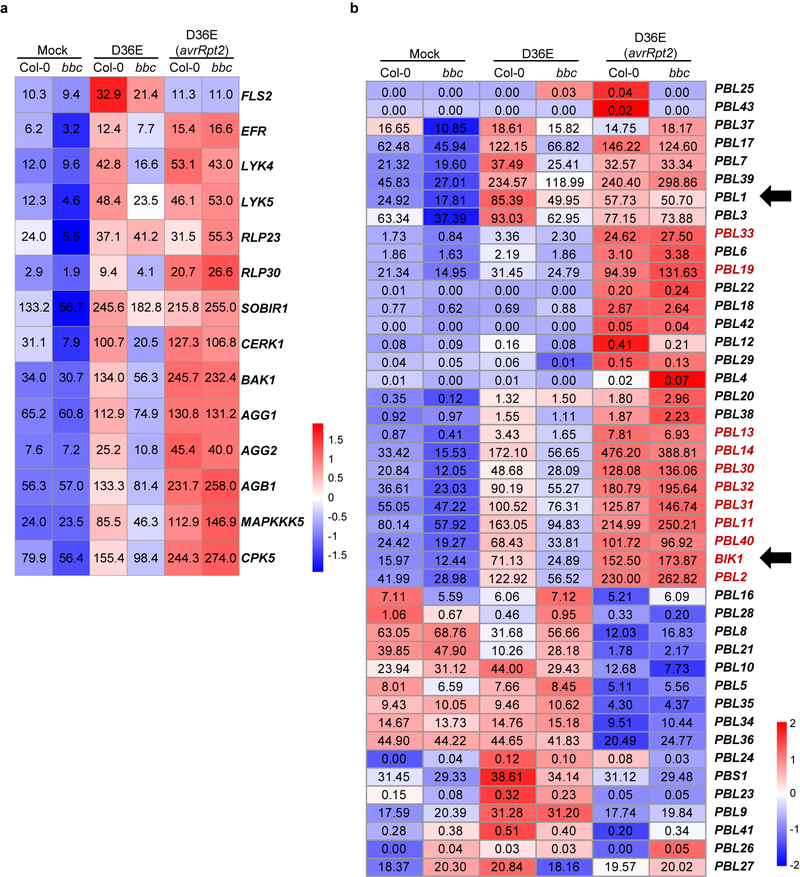
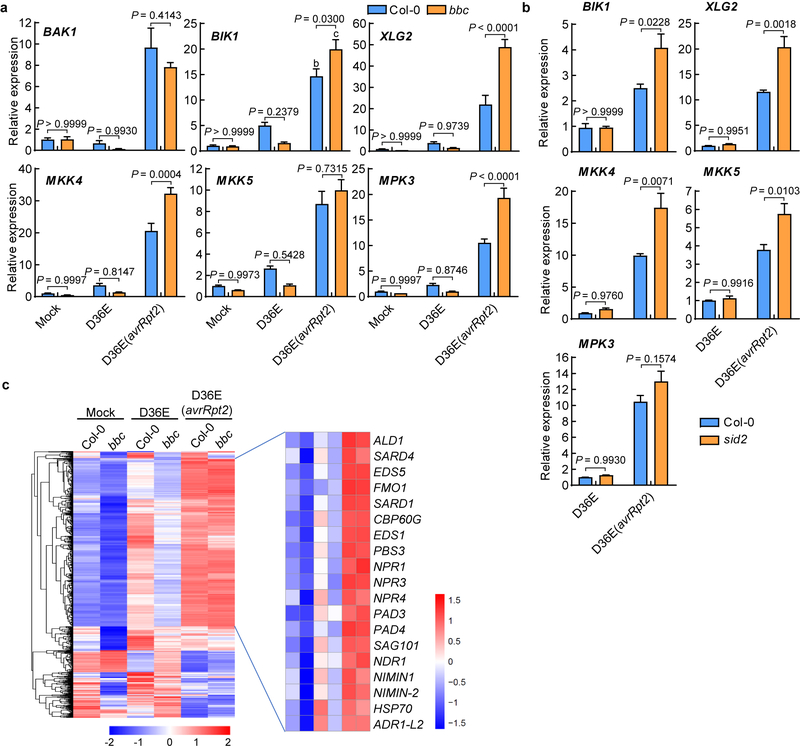
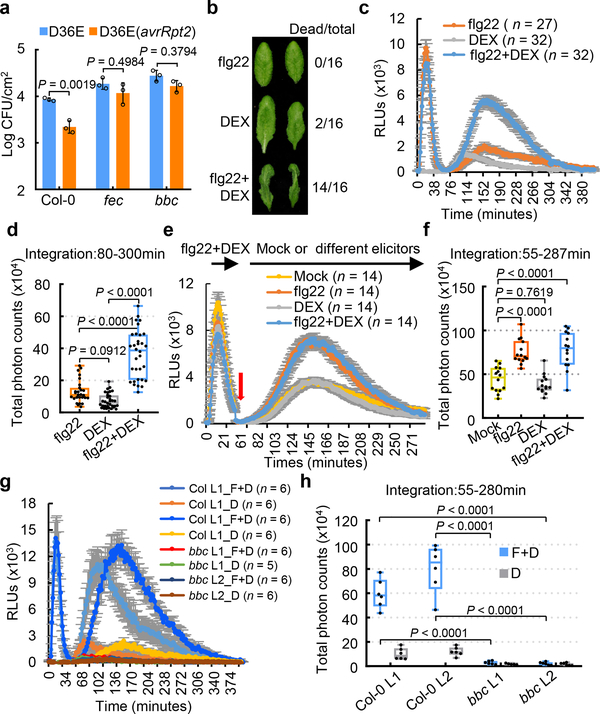
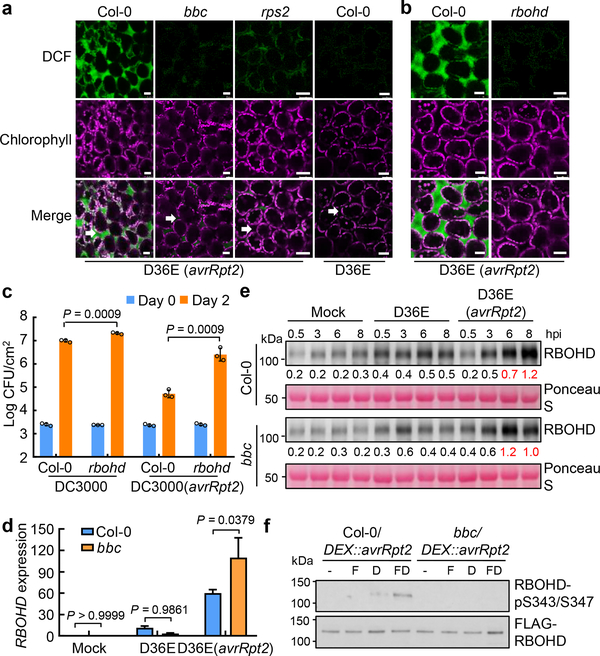
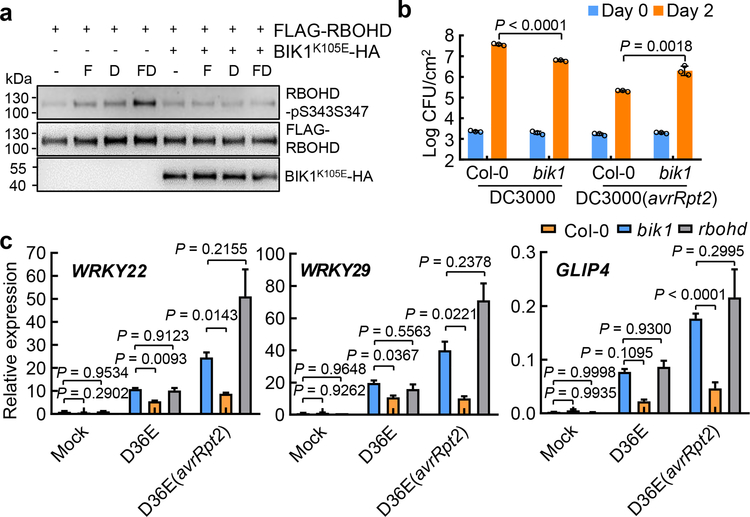
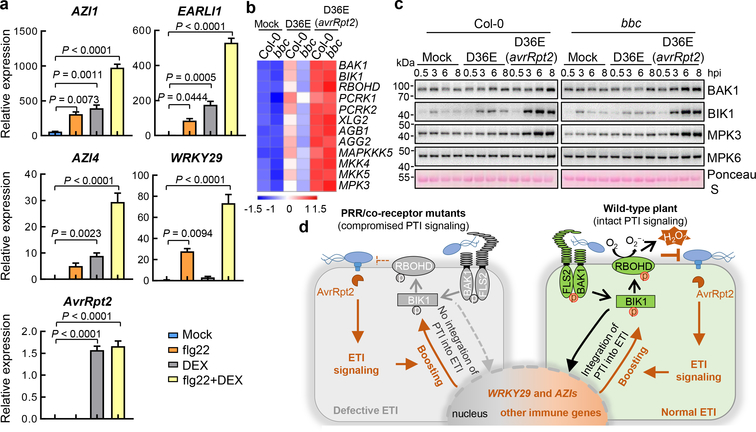
The plant immune system is fundamental for plant survival in natural ecosystems and for productivity in crop fields. Substantial evidence supports the prevailing notion that plants possess a two-tiered innate immune system, called pattern-triggered immunity (PTI) and effector-triggered immunity (ETI). PTI is triggered by microbial patterns via cell surface-localized pattern-recognition receptors (PRRs), whereas ETI is activated by pathogen effector proteins via predominantly intracellularly localized receptors called nucleotide-binding, leucine-rich repeat receptors (NLRs)1-4. PTI and ETI are initiated by distinct activation mechanisms and involve different early signalling cascades5,6. Here we show that Arabidopsis PRR and PRR co-receptor mutants-fls2 efr cerk1 and bak1 bkk1 cerk1 triple mutants-are markedly impaired in ETI responses when challenged with incompatible Pseudomonas syrinage bacteria. We further show that the production of reactive oxygen species by the NADPH oxidase RBOHD is a critical early signalling event connecting PRR- and NLR-mediated immunity, and that the receptor-like cytoplasmic kinase BIK1 is necessary for full activation of RBOHD, gene expression and bacterial resistance during ETI. Moreover, NLR signalling rapidly augments the transcript and/or protein levels of key PTI components. Our study supports a revised model in which potentiation of PTI is an indispensable component of ETI during bacterial infection. This revised model conceptually unites two major immune signalling cascades in plants and mechanistically explains some of the long-observed similarities in downstream defence outputs between PTI and ETI.


Conflict of interest statement

Competing interests

The authors declare no competing interests.

Figures

Extended Data Fig. 1|
Extended Data Fig. 1|. PRR/co-receptors are required for ETI elicited by different P. syringae avirulent effectors.
a, Pst DC3000 (avrRpt2) bacteria were infiltrated into Arabidopsis leaves at OD600=0.002 and populations were determined 3 days post infection (dpi). (mean ± s.d.; n = 4 biologically independent samples, except n = 3 biologically independent samples for “bbc-DC3000”). Data were analyzed using two-way ANOVA with Tukey’s test. b, AvrPphB- and AvrRps4-mediated ETI are also compromised in fec and bbc mutants. Plants were infiltrated with different strains at OD600=0.002. Bacterial populations were determined 3 days post inoculation. Data were analyzed using two-way ANOVA with Tukey’s test. (mean ± s.d.; n = 3 (Col-0/fec/bbc-DC3000(avrRpt2) and fec-DC3000(avrPphB)) or 4 (Col-0/fec/bbc-DC3000(avrRps4) and Col-0/bbc -DC3000(avrPphB)) biologically independent samples). c, HR was compromised in PRR/co-receptor mutants. Pst DC3000 (avrRpt2) bacteria were infiltrated at OD600=0.2 and pictures were taken ~7 h post infiltration (hpi). Experiments were repeated three times with similar trends.
Extended Data Fig. 2|
Extended Data Fig. 2|. RIN4 cleavage, transcript level of RPS2 and activation of MAPK cascades are not altered in the fec and bbc mutant plants.
a, RIN4 cleavage in Col-0 and the PRR/co-receptor mutants after D36E or D36E(avrRpt2) inoculation. CBB, Coomassie Brilliant Blue staining. An equal amount of total protein was loaded in each lane. b, RPS2 transcript levels in the fec and bbc mutant plants were similar to those in Col-0 plants after inoculation of bacterial strains indicated. Statistical analysis was performed using two-way ANOVA with Tukey’s test. (mean ± s.e.m; n = 3 biologically independent samples). c, MPK3/6 phosphorylation in Col-0 and the PRR/co-receptor mutants after D36E or D36E(avrRpt2) inoculation. An equal amount of total protein was loaded in each lane. Experiments were repeated at least three times with similar trends. For gel source data, see Supplementary Figure 1.
Extended Data Fig. 3|
Extended Data Fig. 3|. Characterization of different lines of bbc/DEX::avrRpt2 plants.
a, Schematic diagram of the experimental design. Leaf discs were first treated with flg22+DEX for 35min, and the production of ROS was detected by a microplate reader. Leaf discs were then washed with sterilized water for 4 times, 5min each time. Sterilized water (mock), 100nM flg22, 5μM DEX or 100nM flg22+5μM DEX was then added for detection of second-phase ROS. b, Expression levels of the avrRpt2 transgene in different transgenic lines 2h after infiltration with 5μM DEX. Statistical analysis was performed using one-way ANOVA with Tukey’s test. (mean ± s.e.m.; n = 3 (Col-0/DEX::avrRpt2 L2, bbc/DEX::avrRpt2 L1, bbc/DEX::avrRpt2 L2) or 4 (Col-0/DEX::avrRpt2 L1) biologically independent samples). Experiments were repeated three times with similar trends.
Extended Data Fig. 4|
Extended Data Fig. 4|. AvrRpt2-triggered ETI-ROS depends on NADPH oxidase.
a-c, ROS production in Col-0/DEX::avrRpt2 L1 plants was inhibited by NADPH oxidase inhibitor DPI. Leaf discs were treated with 100nM flg22 and 5μM DEX. DPI, SHAM and NaN3 were added at the beginning of measurement (mean ± s.e.m.; n (numbers of leaf disks) are indicated in the panel). b-c, Total photon counts are calculated from a at the PTI phase (0–30min) or ETI phase (60–200min). Statistical analysis was performed by one-way ANOVA with Tukey’s test. d, ETI-associated ROS burst is inhibited by DPI, an NADPH oxidase inhibitor. ROS was detected in Col-0/DEX::avrRpt2 plants after treatment of 100nM flg22 and 5μM DEX. Chemical inhibitors (DPI, SHAM or NaN3) were added after the first ROS burst (about 40min after addition of flg22 and DEX). Data are displayed as mean ± s.e.m. n (numbers of leaf disks) are indicated in the panel. Box plots: centre line, median; box limits, lower and upper quartiles; dots, individual data points; whiskers, highest and lowest data points. Experiments in this figure were repeated three times with similar trends.
Extended Data Fig. 5|
Extended Data Fig. 5|. The rbohd and bik1 mutant plants are compromised in ETI resistance against Pst DC3000(avrRpt2).
a, Appearance of the 5 week-old rbohd mutant plants before bacteria inoculation. b, Disease symptom of Col-0 and rbohd mutant plant 2 days after Pst DC3000 and Pst DC3000 (avrRpt2) infiltration. c, Appearance of the 4.5 week-old bik1 mutant plants growth in redi-earth soil before bacteria inoculation. d, Disease symptom of Col-0 and bik1 mutant plant 2 days after Pst DC3000 and Pst DC3000 (avrRpt2) infiltration. Experiments in this figure were repeated three times with similar trends.
Extended Data Fig. 6|
Extended Data Fig. 6|. The AvrRpt2 ETI-associated ROS burst is partially mediated by BIK1.
a, ROS was detected in the bik1 and cpk5/6/11 mutant plants by H2DCFDA dye 4.5 h after D36E (avrRpt2) inoculation. Scale bars = 25 μm. b, ROS was detected in the bik1 mutant plants by H2DCFDA dye 5 h after D36E or D36E (avrRpt2) inoculation. Plants were grown on 1/2MS plate for 3 weeks. Scale bars = 25 μm. Experiments in this figure were repeated three times with similar trends.
Extended Data Fig. 7|
Extended Data Fig. 7|. Transcriptomic analysis of RNAseq experiments.
a, A diagram showing the RNAseq design in this study. b, Bacterial population in Arabidopsis leaves at 3h or 6h post infiltration. Data are displayed by mean ± s.d. (n = 3 biologically independent samples). Statistical analysis was performed using two-way ANOVA with Tukey’s test. c, A Venn diagram showing numbers of differentially expressed genes (DEGs) 3h after D36E or D36E(avrRpt2) infection in Col-0 plants. d, A heat-map of the expression pattern of D36E/PTI-responsive genes. e-g, Heat-maps of SA- (e; genes extracted from Karolina et al., 2012), jasmonate- (f; genes extracted from Hickman et al., 2017) and ethylene-(g; genes extracted from Nemhauser et al.,2006) responsive genes.
Extended Data Fig. 8|
Extended Data Fig. 8|. PRR/co-receptors are important for immune-related gene expression
(a, b) The WRKY-FRK1 is a unique immune branch and cannot be restored by ETI in bbc mutant. a, Heat map of the 272 DEGs in the bbc plant compared to Col-0 plant after D36E (avrRpt2) infection, with the canonical PTI pathway genes highlighted in red. b, qRT-PCR of FRK1 and WRKY29 expression level in Col-0 and bbc plants 3h after infiltration with different strains or Mock. (mean ± s.e.m.; n = 3 biologically independent samples; statistical analysis by two-way ANOVA with Tukey’s test; p < 0.05; different letters indicate statistically significant difference). c, Expression level of AvrRpt2, AZI1, EARLI1 and AZI4 in the Col-0/DEX::avrRpt2 L1 and bbc/DEX::avrRpt2 L2 plants after sterilized water (mock) or DEX (50nM for Col-0/DEX::avrRpt2 and 100nM for bbc/DEX::avrRpt2) treatment. Leaves were harvested 2h post infiltration for transcript analysis (mean ± s.e.m; n = 3 biologically independent samples; statistical analysis by two-way ANOVA with Tukey’s test). Experiments in b and c were repeated at least three times with similar trends.
Extended Data Fig. 9|
Extended Data Fig. 9|. Heat map of gene expression of RLK/LYK5/RLP pathway (a) and BIK1/PBL family (b) in the RNAseq experiment.
Numerical values indicate expression level calculated by TPM (Transcripts per Kb of exon model per Million). Genes labeled in red show significant up-regulation after D36E(avrRpt2) inoculation, compared to mock and D36E inoculation, in Col-0 and bbc plants. Arrows indicate BIK1 and PBL1 genes (b).
Extended Data Fig. 10|
Extended Data Fig. 10|. Up-regulation of key PTI component genes by AvrRpt2-triggered ETI seems to be independent of PTI and SA/NHP.
a, qRT-PCR results of representative PTI pathway genes. Col-0 and bbc plants were infiltrated with different strains indicated, and leaves were harvested 3h post infiltration for transcript analysis (mean ± s.e.m; n = 3 biological replicates for all plants/genes, except “bbc-BAK1”, for which n = 4 biologically independent samples). Statistical analysis by two-way ANOVA with Tukey’s test. P-values for additional comparisons are provided in Supplementary Table 3. b, qRT-PCR analysis of BIK1, XLG2, MKK4, MKK5 and MPK3 expression levels in Col-0 and sid2 plants 3h after infiltration with D36E or D36E(avrRpt2). Statistical analysis by two-way ANOVA with Tukey’s test (mean ± s.e.m.; n = 3 (for Col-0) or 4 (for sid2) biologically independent samples). These experiments were repeated at least three times with similar trends. c, Heat-maps of NHP-responsive genes (extracted from Hartmann et al., 2018, defined by genes that are responsive to pipecolic acid and depend on FMO1 for expression) in the Col-0 and bbc plants in our RNAseq experiment.
Fig. 1|
Fig. 1|. PTI-associated PRR/co-receptors are required for ETI responses and resistance.
a, D36E(avrRpt2) bacteria were infiltrated at OD600=0.004 and populations were determined 4 days post infiltration (dpi). Two-way ANOVA with Tukey’s test. (mean ± s.d.; n = 3 biologically independent samples). b, DEX-induced HR was accelerated by flg22 co-treatment in DEX::avrRpt2 plant. Pictures were taken ~6 h after infiltration of 200nM flg22, 500nM DEX or 200nM flg22+500nM DEX into leaves. c-h, ROS burst detected by luminol-HRP approach in Col-0/DEX::avrRpt2 (c-f) and bbc/DEX::avrRpt2 plants (g, h), with treatment of different elicitors (F+D, flg22+DEX; D, Dex). Total photon counts (d, f, h) are calculated from c, e and g, respectively. e, f, Leaf disks were first treated with flg22+ DEX for 35min, washed with sterilized water four times (red arrow), and then subject to mock (sterilized water), flg22, DEX or flg22+ DEX. Individual data points (n = numbers of leaf disks as biologically independent samples) are plotted with mean ± s.e.m. displayed in d, f, h. Data were analyzed by one-way (d, f) or two-way (h) ANOVA with Tukey’s test. RLUs, relative luminescence units. Box plots: centre line, median; box limits, lower and upper quartiles; whiskers, highest and lowest data points. Experiments in this figure were repeated at least three times with similar trends.
Fig. 2|
Fig. 2|. AvrRpt2-triggered ROS is mediated by RBOHD and requires PRR/co-receptors.
a, b, ROS burst detected with fluorescent dye H2DCFDA in Col-0, bbc, rps2 and rbohd leaves 5h after infiltration of D36E(avrRpt2) or in Col-0 leaves 5h after infiltration of D36E strain. White arrows indicate the apoplast space in the leaf. Scale bars = 25μm. c, Pst DC3000 (avrRpt2) bacteria were infiltrated at OD600=0.001 and bacterial populations were determined 2 dpi. Student’s t-test, two-tailed. Data are displayed as mean ± s.d. (n = 3 biologically independent samples). d, e, RBOHD transcript (d) and protein (e) levels in Col-0 and bbc plants 3h (d) or different time points (e) after inoculation of bacterial strains indicated. d, Data are displayed by mean ± s.e.m. (n = 4 biologically independent samples for “bbc-Mock/D36E” and “Col-0-D36E” and n = 3 biologically independent samples for “Col-0-Mock/D36E(avrRpt2)” and “bbc-D36E(avrRpt2)”). Data were analyzed by two-way ANOVA with Tukey’s test. P-values for additional comparisons are provided in Supplementary Table 3. e, Numbers indicate band intensity relative to that of Ponceau S, quantified by ImageJ. f, Phosphorylation of RBOHD protein at S343/S347 sites. FLAG-RBOHD was transformed into protoplasts, which were then treated with elicitors (-, Mock; F, 100nM flg22; D, 5μM DEX; FD, 100nM flg22+5μM DEX) and harvested 2.5h later for FLAG-RBOHD immunoprecipitation and protein blotting. Experiments in this figure were repeated at least three times with similar trends. For gel source data, see Supplementary Figure 1.
Fig. 3|
Fig. 3|. BIK1 is required for phosphorylation of RBOHD, immune gene expression and resistance during ETI.
a, Phosphorylation of RBOHD at S343/S347 sites during ETI. Protoplasts from DEX::avrRpt2 plants were transformed with DNA constructs expressing FLAG-RBOHD and/or BIK1K105E-HA as indicated, followed by treatment with 100nM flg22 (F), 5μM DEX (D) or 100nM flg22+5μM DEX (F+D) for 2.5h before immuno-precipitation and protein blotting. b, Pst DC3000 (avrRpt2) bacteria were infiltrated into Arabidopsis leaves at OD600=0.001 and bacterial populations were determined 2 dpi. Student’s t-test, two-tailed. Data are displayed as mean ± s.d. (n = 3 biologically independent samples). c, qRT-PCR analysis of WRKY22, WRKY29 and GLIP4 expression level in Col-0, bik1 and rbohd plants 3h after infiltration with different bacterial strains or mock. Data shown are mean ± s.e.m. (n = 4 biologically independent samples; statistical analysis by two-way ANOVA with Tukey’s test; different letters indicate statistically significant difference). Experiments in this figure were repeated at least three times with similar trends. For gel source data, see Supplementary Figure 1.
Fig. 4|
Fig. 4|. ETI upregulates key components of the PTI pathway.
a, Expression levels of AvrRpt2, WRKY29, AZI1, EARLI1 and AZI4 genes in DEX::avrRpt2 transgenic plants after different elicitors treatment. Leaves were harvested 2h post infiltration for transcript analysis (mean ± s.e.m; n = 3 biologically independent samples). Statistical analysis by one-way ANOVA with Tukey’s test. P-values for additional comparisons are provided in Supplementary Table 3. b, Heat map of the expression pattern of PTI pathway genes. c, Protein levels of BAK1, BIK1, MPK3 and MPK6 in Col-0 and bbc plants at different time points after inoculation of bacterial strains indicated. MPK6 protein is not induced by ETI and serves as an internal control. These experiments were repeated at least three times with similar trends. e, A model depicting findings from this study showing PTI as a key component of ETI. In wild-type plant, RPS2 activation leads to protein accumulation of key PTI components such as BIK1 and RBOHD and potentiation of PTI-associated genes such as WRKY29 and AZIs. PRR/co-receptors are required for fully “activating” ROBHD (by phosphorylation) to generate robust ROS and normal ETI. In the absence of PRR/co-receptors (left panel), although NLR activation still induces PTI components, many of these components like BIK1 and RBOHD are inactive, leading to lack of ROS production and defective ETI. Grey color indicates mutated (i.e., FLS2 and BAK1) or inactive (i.e. RBOHD and BIK1) proteins and green color indicates active proteins. For gel source data, see Supplementary Figure 1.

Comment in

References

    1. Yu X, Feng B, He P & Shan L From Chaos to Harmony: Responses and Signaling upon Microbial Pattern Recognition. Annu Rev Phytopathol. 55, 109–137 (2017). - PMC - PubMed
    1. Couto D & Zipfel C Regulation of pattern recognition receptor signalling in plants. Nat Rev Immunol. 16, 537–552 (2016). - PubMed
    1. Spoel SH & Dong X How do plants achieve immunity? Defence without specialized immune cells. Nat Rev Immunol. 12, 89–100 (2012). - PubMed
    1. Cui H, Tsuda K & Parker JE Effector-triggered immunity: from pathogen perception to robust defense. Annu Rev Plant Biol. 66, 487–511 (2015). - PubMed
    1. Jones JD & Dangl JL The plant immune system. Nature. 444, 323–329 (2006). - PubMed

Publication types

MeSH terms