. 2021 Apr;16(4):1936-1965.
doi: 10.1038/s41596-020-00474-1. Epub 2021 Mar 10.

Long-term culture, genetic manipulation and xenotransplantation of human normal and breast cancer organoids

Affiliations

Long-term culture, genetic manipulation and xenotransplantation of human normal and breast cancer organoids

Johanna F Dekkers et al. Nat Protoc. 2021 Apr.

Abstract

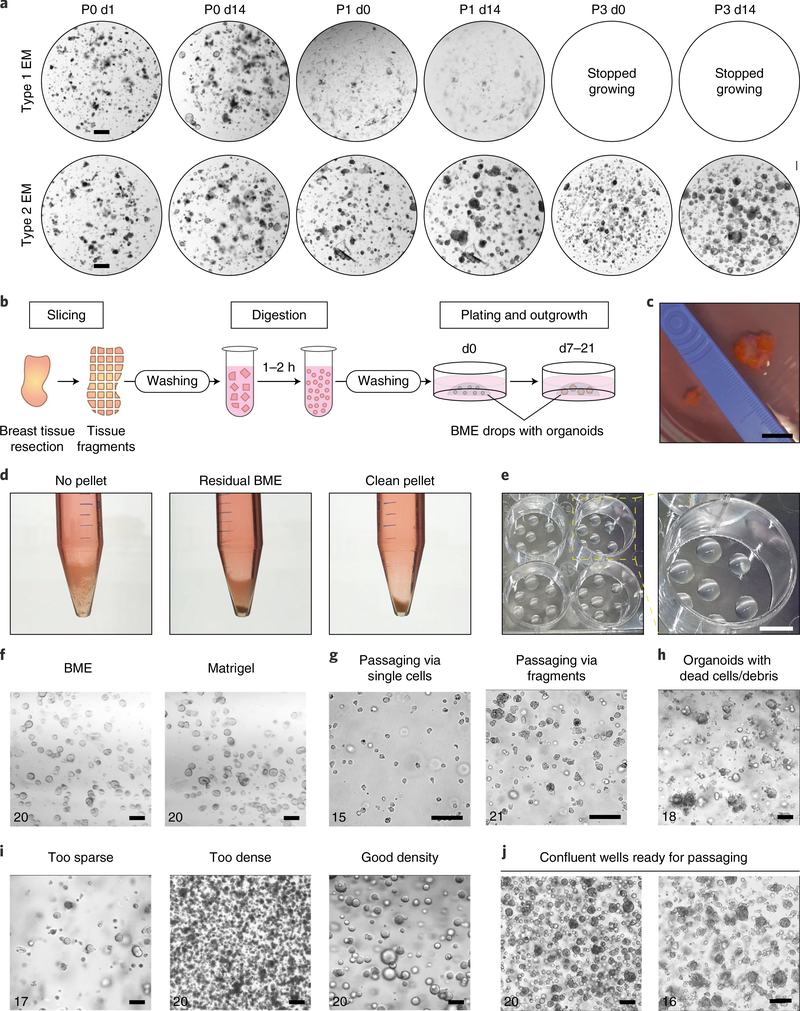
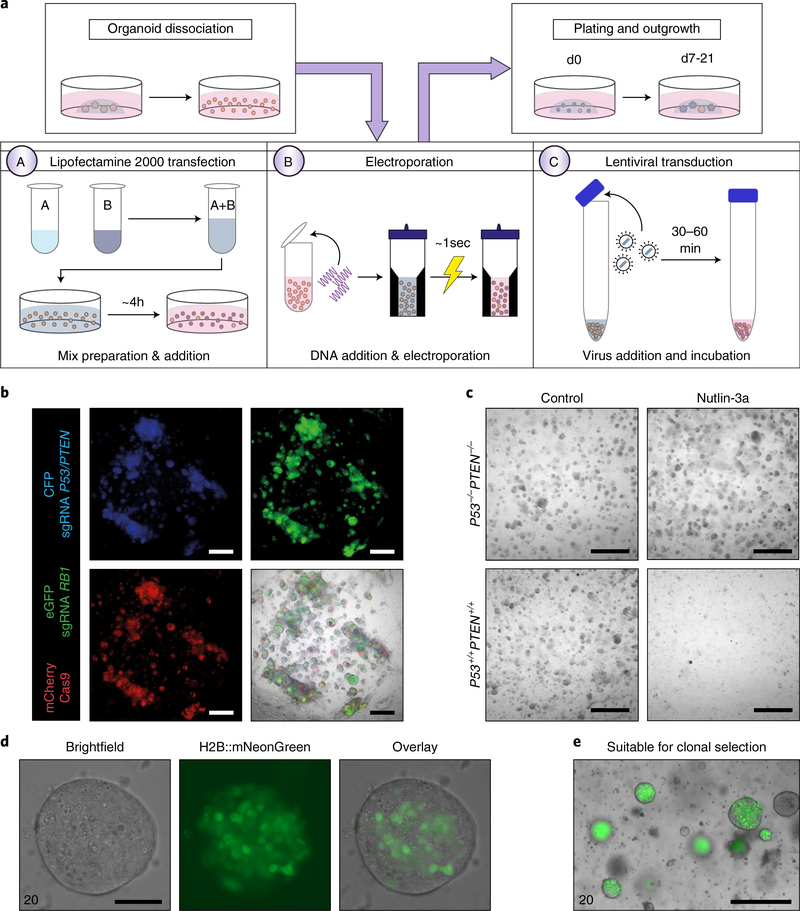
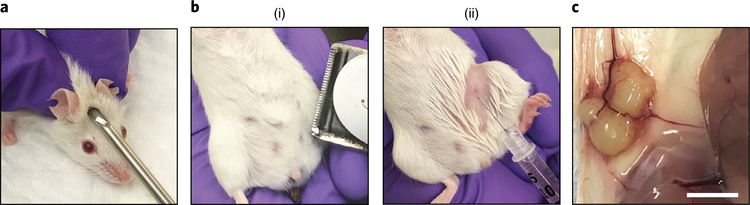
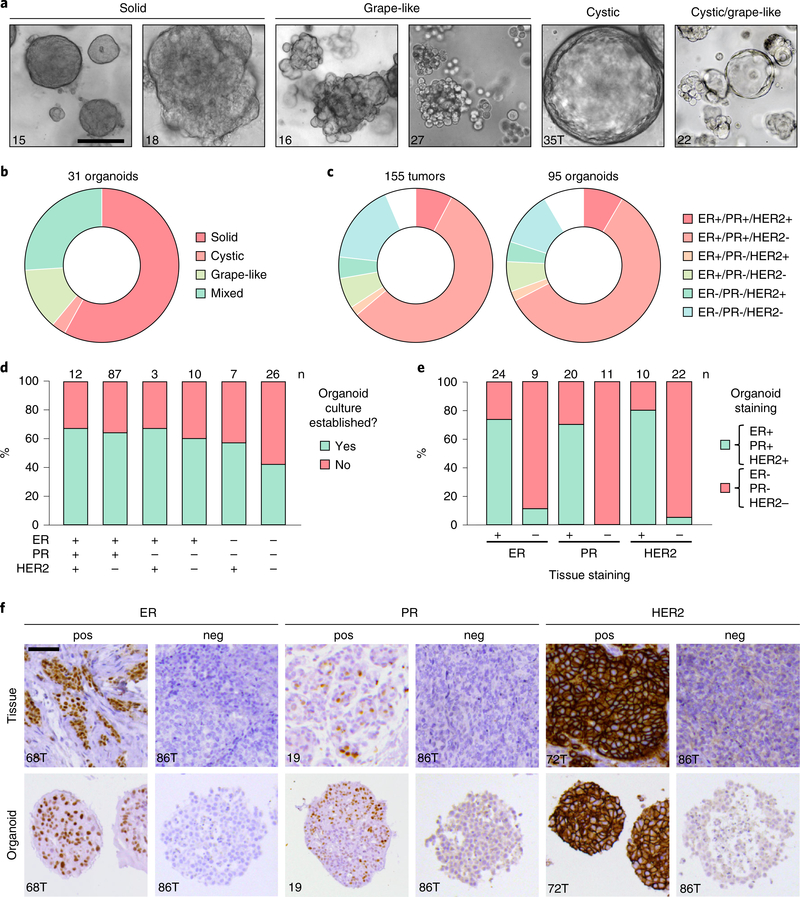
Organoid technology has revolutionized the study of human organ development, disease and therapy response tailored to the individual. Although detailed protocols are available for the generation and long-term propagation of human organoids from various organs, such methods are lacking for breast tissue. Here we provide an optimized, highly versatile protocol for long-term culture of organoids derived from either normal human breast tissues or breast cancer (BC) tissues, as well as culturing conditions for a panel of 45 biobanked samples, including BC organoids covering all major disease subtypes (triple-negative, estrogen receptor-positive/progesterone receptor-positive and human epidermal growth receptor 2-positive). Additionally, we provide methods for genetic manipulation by Lipofectamine 2000, electroporation or lentivirus and subsequent organoid selection and clonal culture. Finally, we introduce an optimized method for orthotopic organoid transplantation in mice, which includes injection of organoids and estrogen pellets without the need for surgery. Organoid derivation from tissue fragments until the first split takes 7-21 d; generation of genetically manipulated clonal organoid cultures takes 14-21 d; and organoid expansion for xenotransplantation takes >4 weeks.


Figures

Fig. 1 |
Fig. 1 |. Schematic overview of the protocol describing human breast organoid derivation, culturing, genetic manipulation and xenotransplantation.
Organoids are established from resections of normal breast or tumor tissue, followed by organoid maintenance or freezing for long-term storage. Genetic manipulation by Lipofectamine-based transfection, electroporation-based transfection or lentiviral transduction is described, as well as (clonal) organoid selection. Orthotopic injection can be performed to grow organoid-derived tumors in vivo, with the stated time indicating time until first signs of tumor formation. Corresponding steps of the protocol and their timing are indicated in yellow boxes.
Fig. 2 |
Fig. 2 |. Organoid derivation, culturing and passaging.
a, Bright-field images of BC organoids (Sample 36 of Table 1) grown in either Type 1 or Type 2 expansion medium (EM), demonstrating increased organoid outgrowth in Type 2 compared to Type 1 EM. P, passage number; d, number of days since last split. Scale bar, 400 μm. b, Schematic overview of the organoid derivation process. Biopsies are sliced into 0.5–1-mm3 pieces, digested with collagenase and plated in BME. c, Representative piece of healthy breast tissue. Scale bar, 1 cm. d, Representative images of the absence of a pellet (left), a pellet containing residual BME (middle) and a clean pellet (right), after organoid washing. e, Representative images of BME drops in a 12-well plate. Scale bar, 5 mm. f, Bright-field images of BC organoids grown in either Matrigel or BME, demonstrating similar organoid outgrowth. Scale bars, 100 μm. g, Representative images of BC organoid cultures passaged as single cells (left) or fragments of 5–20 cells (right). Scale bars, 100 μm. h, Representative image of an organoid culture with clear presence of cell debris. Scale bar, 100 μm. i, Representative bright-field images of BC organoids seeded too sparsely (left), too densely (middle) or at the proper density (right). Scale bars, 100 μm. j, Representative images of confluent organoid wells of solid (left) and grape-like (right) cultures. Scale bars, 100 μm. Numbers in f–j refer to sample numbers in Table 1.
Fig. 3 |
Fig. 3 |. Genetic manipulation of breast organoids.
a, Schematic overview of genetic manipulation of breast organoids. Dissociated organoids can be incubated with a Lipofectamine 2000-based transfection mix (A), electroporated (B) or incubated with high-titer lentivirus (C) and plated in BME. b, Representative fluorescent images of normal breast organoids 7 d in culture after transduction with lentivirus expressing fluorescent reporters and single guide RNAs or Cas9, as indicated. Scale bar, 500 μm. c, Representative bright-field images of normal breast organoids (control) or normal breast organoids knocked out for P53 and PTEN by CRISPR–Cas9 and treated with Nutlin-3a (10 μM) for 7 d. Scale bar, 200 μm. d,e, Representative images of a single organoid (d) or multipe organoids (e) (Sample 20 of Table 1) that were genetically edited to stably express H2B::mNeonGreen and a puromycin resistane gene after 14 d of puromycin selection. Scale bars, 100 μm (d) and 1,000 μm (e). Panels b and c were adapted from ref. .
Fig. 4 |
Fig. 4 |. Estrogen pellet implantation and organoid xenotransplantation.
a, Subcutaneous estrogen pellet implantation. b, Shaving of the injection site (i) and orthotopic injection of organoids into the mammary fat pad (ii). c, Representative image of a tumor grown from orthotopically injected BC organoids. Scale bar, 5 mm.
Fig. 5 |
Fig. 5 |. Characterization of BC organoid cultures.
a, Representative bright-field images of different morphologies of BC organoids. Scale bars, as indicated in the bottom right corner of the first image, 100 μm. b, Donut chart depicting the distribution of the major morphologies of 31 BC organoid cultures. c, Donut chart showing the distribution of BC subtypes in 155 tissue samples and 95 related organoid cultures. d, Stacked bar chart demonstrating the success rate of organoid establishment, grouped by receptor expression status. ‘Yes’ indicates successful establishment (>5 in vitro passages); ‘No’ indicates unsuccessful establishment. e, Stacked bar charts showing the percentage of organoid cultures with positive (green) or negative (pink) receptor status, as compared to the original tissue receptor status. f, Comparative immunohistochemical images of BC tissue and derived organoids. Shown are representative images of receptor positive (pos) and receptor negative (neg) samples. Scale bar, as indicated in the top left corner of the first image, 100 μm. Panels a, c, e and f were adapted from ref. . In panels a and f, numbers 15, 18, 16, 27, 22 and 19 refer to sample numbers in Table 1, and 35T, 68T, 86T and 72T refer to sample numbers as published in ref. .
Fig. 6 |
Fig. 6 |. Characteristics of breast organoid cultures derived from histologically normal breast tissues.
a, Diverse structure types can be seen in a single normal breast organoid culture at passage 5. b, Representative examples of organoid cultures showing structures of the mature luminal type (acinar structures with a large lumen), luminal progenitor type (smaller structures with a small inner lumen that can exhibit budding) and basal/stem cell type (larger structure types that can exhibit budding or branching). c, Fluorescent confocal image of a representative branching organoid at passage 3 of culture labeled for DAPI (white) and F-actin (red). d, Fluorescent confocal image of a luminal structure at passage 5 of culture labeled for DAPI (white) and F-actin (red). e, CyTOF analysis using a breast-specific antibody panel demonstrates the presence of all of the major mammary epithelial cell types in a single culture. Heat map showing normalized protein expression levels for the indicated markers (x axis) for single cells in a representative organoid culture (y axis). f, The indicated medium components were omitted from Type 1 expansion medium, and breast organoid cultures were generated. The distribution of mammary lineages as measured by CyTOF is shown in the donut plots (upper panel), and representative bright-field images of the cultures are shown (bottom panel). Basal: basal/stem cell; LP, luminal progenitor; ML, mature luminal. Other: cells that fall outside of the CD49f and EpCAM gating parameters, so cannot be defined as basal, LP or ML. In all panels, organoids were maintained in Type 1 expansion medium from which Y-27632 was removed 2–3 d after organoid establishment, passaging or thawing. Scale bars, 100 μm (ac) and 20 μm (d). Panels b, e and f were adapted from ref. .

References

    1. DeSantis CE et al. Breast cancer statistics, 2019. CA Cancer J. Clin 69, 438–451 (2019). - PubMed
    1. Nik-Zainal S et al. Landscape of somatic mutations in 560 breast cancer whole-genome sequences. Nature 534, 47–54 (2016). - PMC - PubMed
    1. Curtis C et al. The genomic and transcriptomic architecture of 2,000 breast tumours reveals novel subgroups. Nature 486, 346–352 (2012). - PMC - PubMed
    1. Rios AC et al. Intraclonal plasticity in mammary tumors revealed through large-scale single-cell resolution 3D imaging. Cancer Cell 35, 618–632 (2019). - PubMed
    1. Hoon Tan P et al. The 2019 World Health Organization classi!cation of tumours of the breast. Histopathology 77, 181–185 (2020). - PubMed

Publication types