Review
. 2021 Apr:64:102204.
doi: 10.1016/j.amsu.2021.102204. Epub 2021 Mar 4.

Global prevalence and determinants of mortality among patients with COVID-19: A systematic review and meta-analysis

Affiliations
Review

Global prevalence and determinants of mortality among patients with COVID-19: A systematic review and meta-analysis

Semagn Mekonnen Abate et al. Ann Med Surg (Lond). 2021 Apr.

Abstract

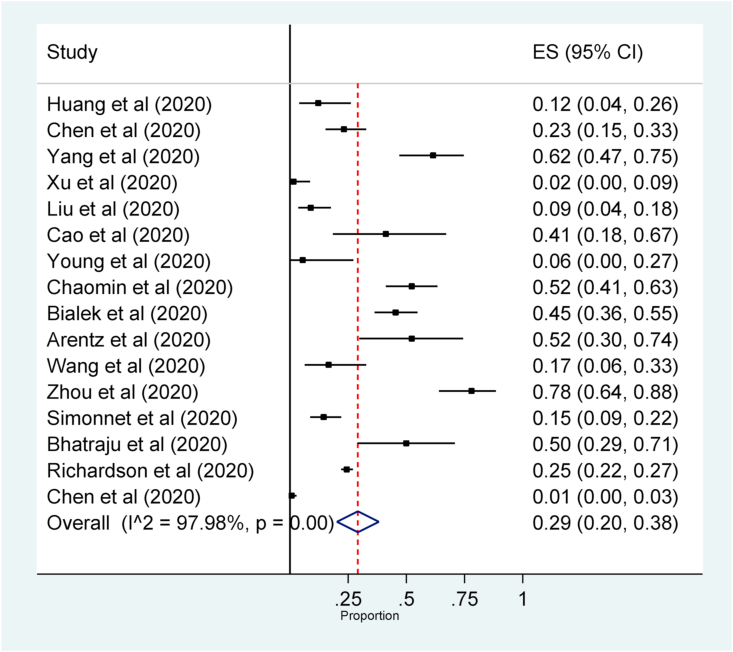
Background: The challenge of COVID-19 is very high globally due to a lack of proven treatment and the complexity of its transmission. The prevalence of in-hospital mortality among patients with COVID-19 was very high which ranged from 1 to 52% of hospital admission. The prevalence of mortality among intensive care patients with COVID-19 was very high which ranged from 6% to 86% of admitted patients.

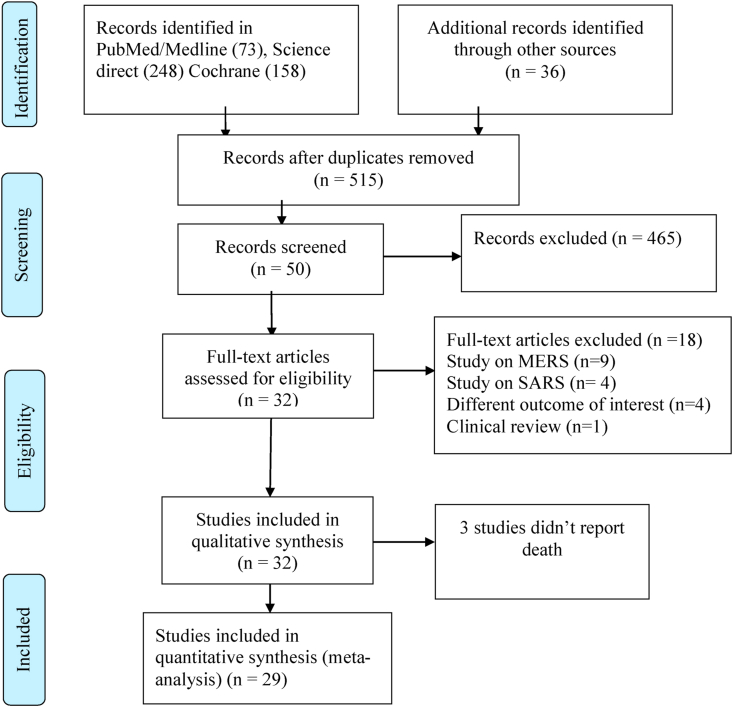
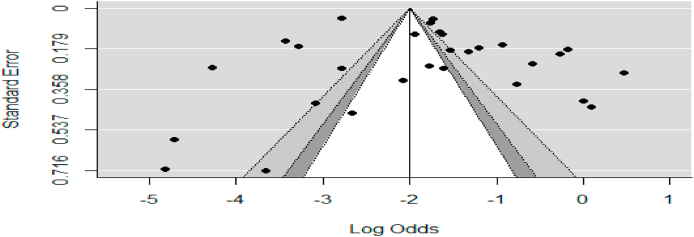
Methods: A three-stage search strategy was conducted on PubMed/Medline; Science direct Cochrane Library. The Heterogeneity among the included studies was checked with forest plot, χ2 test, I2 test, and the p-values. Publication bias was checked with a funnel plot and the objective diagnostic test was conducted with Egger's correlation, Begg's regression tests.

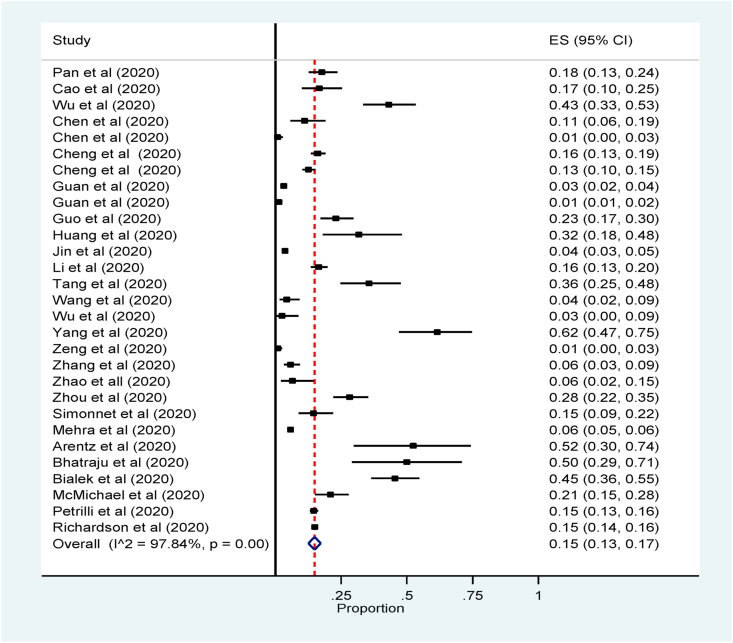
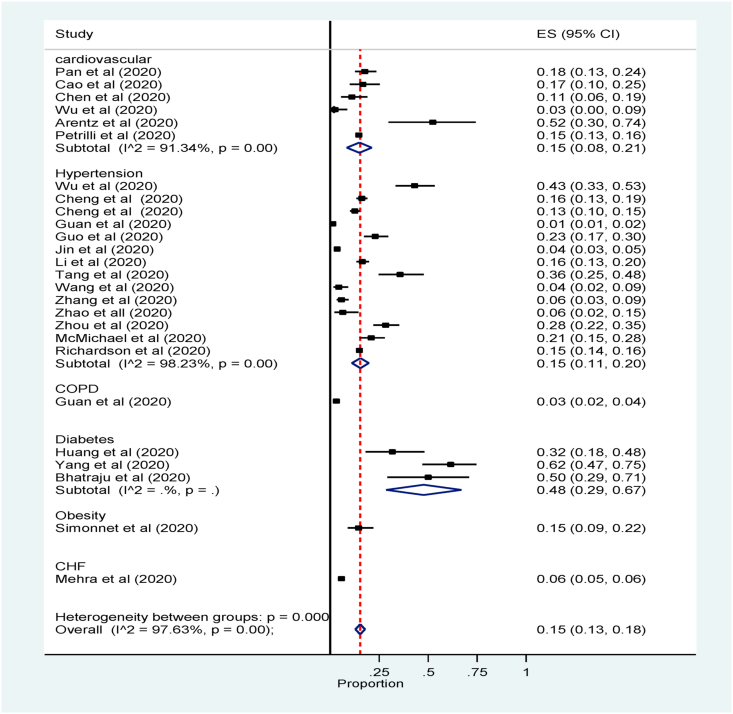
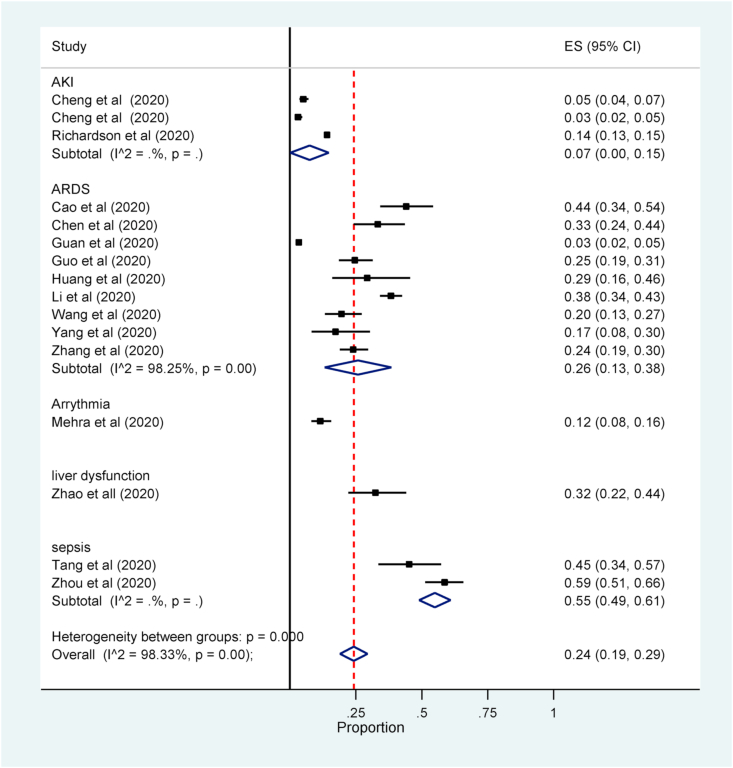
Result: The Meta-Analysis revealed that the pooled prevalence of in-hospital mortality in patients with coronavirus disease was 15% (95% CI: 13 to 17). Prevalence of in-hospital mortality in patients with COVID-19 was strongly related to different factors. Patients with Acute respiratory distress syndrome were eight times more likely to die as compared to those who didn't have, RR = 7.99(95% CI: 4.9 to 13).

Conclusion: The review revealed that more than fifteen percent of patients admitted to the hospital with coronavirus died. This presages the health care stakeholders to manage morbidity and mortality among patients with coronavirus through the mobilization of adequate resources and skilled health care providers.

Registration: This systematic review and meta-analysis was registered in research registry with UIN of reviewregistry1093.

Keywords: COVID-19; Coronavirus; Mortality; Severe acute respiratory syndrome.


Conflict of interest statement

The authors declared that there is no conflict of interest.

Figures

Fig. 1
Fig. 1
Prisma flow chart.
Fig. 2
Fig. 2
Forest plot for the prevalence of mortality among hospitalized patients with COVID: The midpoint of each line illustrates the prevalence; the horizontal line indicates the confidence interval, and the diamond shows the pooled prevalence.
Fig. 3
Fig. 3
Forest plot for the prevalence of mortality among patients with Coronaviruses admitted in Intensive Care Unit: The midpoint of each line illustrates the prevalence; the horizontal line indicates the confidence interval, and the diamond shows the pooled prevalence.
Fig. 4
Fig. 4
Forest plot for the prevalence of comorbidity among hospitalized patients with COVID-19: The midpoint of each line illustrates the prevalence; the horizontal line indicates the confidence interval, and the diamond shows the pooled prevalence.
Fig. 5
Fig. 5
Forest plot for subgroup analysis of the prevalence of comorbidity among patients in hospital by major comorbidities. The midpoint of each line illustrates the prevalence; the horizontal line indicates the confidence interval, and the diamond shows the pooled prevalence.
Fig. 6
Fig. 6
Forest plot for the prevalence of complication among hospitalized patients with COVID-19: The midpoint of each line illustrates the prevalence; the horizontal line indicates the confidence interval, and the diamond shows the pooled prevalence.
Fig. 7
Fig. 7
Forest plot for subgroup analysis of the prevalence of complication among patients in hospital by major complication.: The midpoint of each line illustrates the prevalence; the horizontal line indicates the confidence interval, and the diamond shows the pooled prevalence.
Fig. 8
Fig. 8
Funnel plot to assess publication bias. The vertical line indicates the effect size whereas the diagonal line indicates precision of individual studies with 95% confidence interval.

References

    1. Wang L.-F., Shi Z., Zhang S., Field H., Daszak P., Eaton B.T. Review of bats and SARS. Emerg. Infect. Dis. 2006;12(12):1834. - PMC - PubMed
    1. Weiss S.R., Navas-Martin S. Coronavirus pathogenesis and the emerging pathogen severe acute respiratory syndrome coronavirus. Microbiol. Mol. Biol. Rev. 2005;69(4):635–664. Epub 2005/12/13. - PMC - PubMed
    1. Wong J., Goh Q.Y., Tan Z., Lie S.A., Tay Y.C., Ng S.Y. Preparing for a COVID-19 pandemic: a review of operating room outbreak response measures in a large tertiary hospital in Singapore. Can. J. Anaesth. 2020 doi: 10.1007/s12630-020-01620-9. - DOI - PMC - PubMed
    1. Weiss S.R., Navas-Martin S. Coronavirus pathogenesis and the emerging pathogen severe acute respiratory syndrome coronavirus. Microbiol. Mol. Biol. Rev. 2005;69(4):635–664. - PMC - PubMed
    1. Lau S.K., Chan J.F. Coronaviruses: emerging and re-emerging pathogens in humans and animals. BioMed Central. 2015;12:209. doi: 10.1186/s12985-015-0432-z. - DOI - PMC - PubMed