. 2021 Feb 9;11(2):jkaa061.
doi: 10.1093/g3journal/jkaa061.

Gene-level quantitative trait mapping in Caenorhabditis elegans

Affiliations

Gene-level quantitative trait mapping in Caenorhabditis elegans

Luke M Noble et al. G3 (Bethesda). .

Abstract

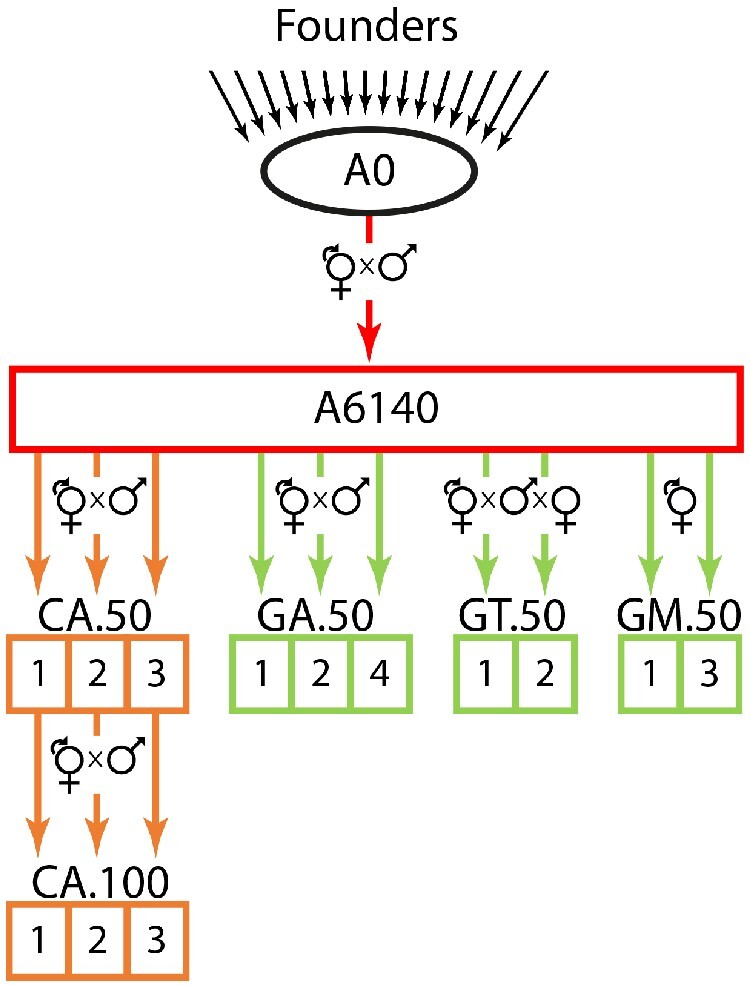
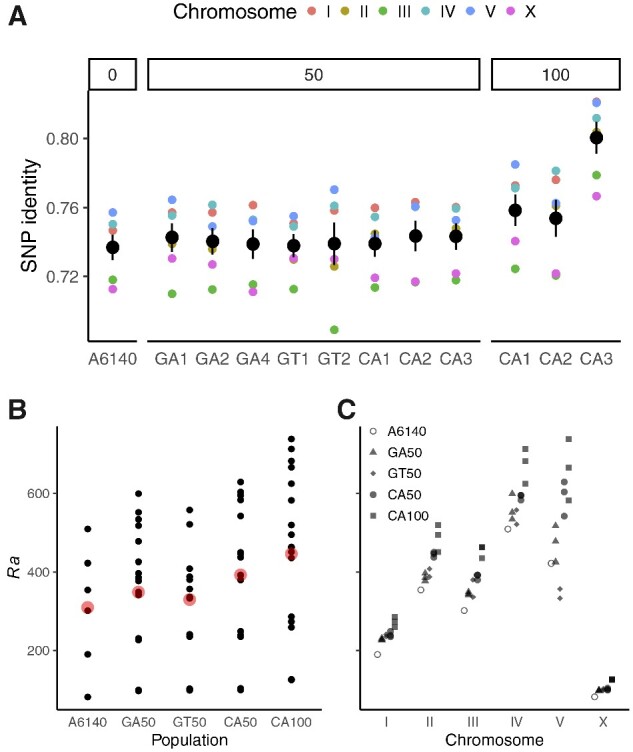
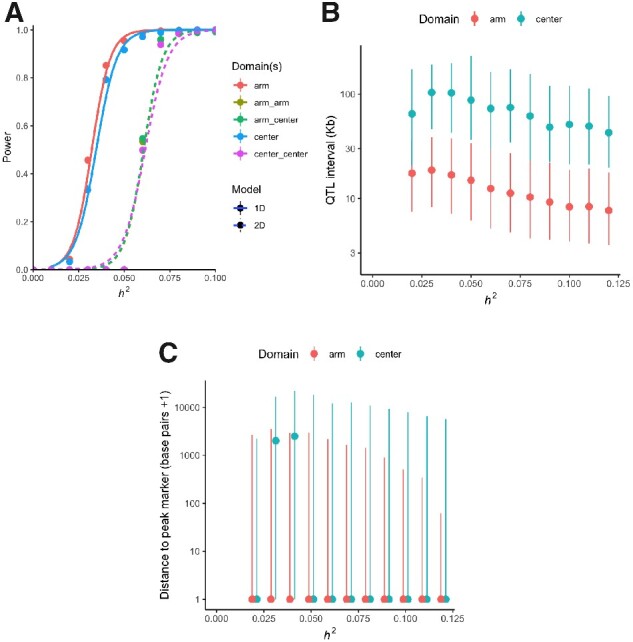
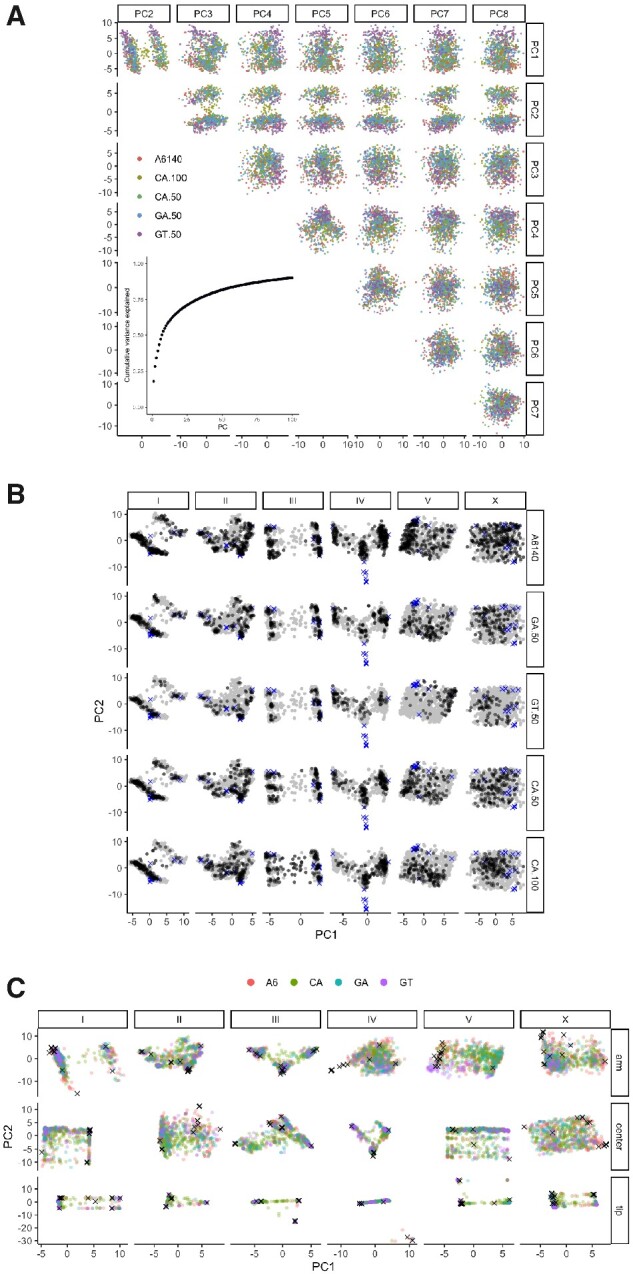
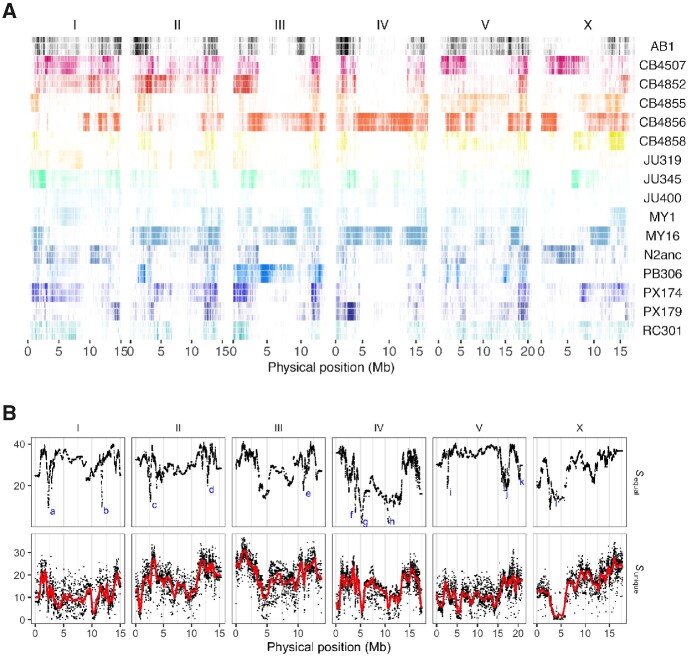
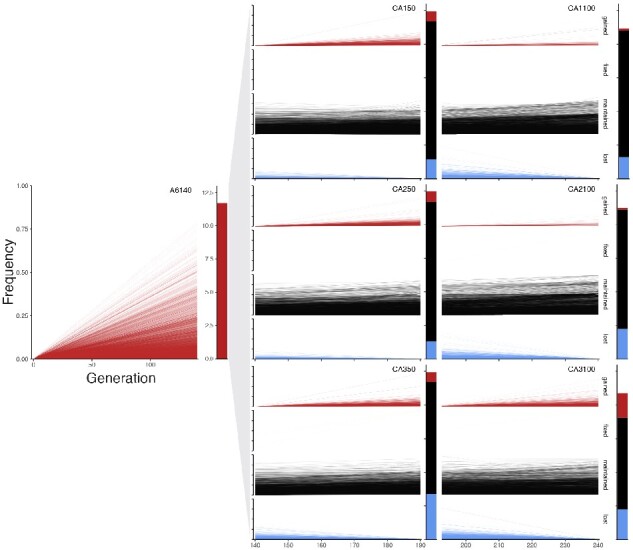
The Caenorhabditis elegans multiparental experimental evolution (CeMEE) panel is a collection of genome-sequenced, cryopreserved recombinant inbred lines useful for mapping the evolution and genetic basis of quantitative traits. We have expanded the resource with new lines and new populations, and here report the genotype and haplotype composition of CeMEE version 2, including a large set of putative de novo mutations, and updated additive and epistatic mapping simulations. Additive quantitative trait loci explaining 4% of trait variance are detected with >80% power, and the median detection interval approaches single-gene resolution on the highly recombinant chromosome arms. Although CeMEE populations are derived from a long-term evolution experiment, genetic structure is dominated by variation present in the ancestral population.

Keywords: MPP; Multiparent Advanced Generation Inter-Cross (MAGIC); Multiparental Populations; QTL; complex trait; experimental evolution; genetic architecture; quantitative trait.


Figures

Figure 1
Figure 1
Experimental evolution scheme. Colors indicate environmental and reproductive system regimes: black for derivation of the hybrid androdiecious (hermaphrodite/male) population A0 from inbred founders, red for domestication under mixed selfing and outcrossing for 140 generations (resulting in the A6140), orange for continued evolution in the standard environment (three lineages, sampled at 50 and 100 generations), green for evolution in changing environments under androdioecious, trioecious (male/female/hermaphrodite) or monoecious (hermaphrodite) mating systems (50 generations). In each regime, samples from replicate populations (numbered in boxes) are periodically frozen for contemporaneous characterization of ancestral and derived characters. CeMEE RILs were derived from A6140 and all descendant lineages shown.
Figure 2
Figure 2
(A) Genetic relatedness within population replicates, grouped by generation from A6140 (mean and standard error of pairwise identity among lines at segregating sites for each chromosome). (B–C) Realized map expansion across experimental populations (B) and chromosomes (C). Each point is a single value for a chromosome of each replicate population, with the grand mean overplotted in red in (B). Map expansion increases with generation (p<1035 by Poisson linear model), and for all chromosomes, though variably so (r2 > 0.77 for chromosomes other than V (0.58) and the outlying IV (0.37), the latter of which carries a very highly recombined haplotype within the right arm piRNA cluster (Chelo and Teotónio 2013; Noble et al. 2017).
Figure 3
Figure 3
(A) Detection power for additive (1D; single marker linear mixed-effects model) or interaction effects (2D; linear regression for a single marker pair), at 10% FDR based on the effective number of tests. Results (mean and standard error) are split by chromosome recombination rate domain(s) of the simulated site(s). (B) QTL detection intervals (median and interquartile range of markers within 1.5 LOD units of the peak marker) for the single-marker additive test. (C) Median and interquartile range for the distance of the true simulated site from the peak QTL marker. The x-axis shows simulated marker h2 (equivalently, r2).
Figure 4
Figure 4
Genetic structure is not dominated by experimental structure. (A) The first eight principal components (PCs) of the additive genetic relatedness matrix (accounting for almost half of the variance), colored by population. The inset shows the cumulative proportion of variance explained by the first 100 PCs. (B) Populations show relatively consistent structure, with the exception of chromosome V for GT populations due to introgression of a sex-determining allele. The top PCs for each chromosome are shown by experimental population (replicates combined). The full space occupied by populations (gray background points) and founders (× symbols) is shown across all panels. Variance explained for the populations ranges from 17% for chromosome X to 57% for IV. (C) As in B, with populations overplotted (CA50 and CA100 pooled), and stratified by recombination rate domain. All values are multiplied by 100.
Figure 5
Figure 5
(A) Founder representation across CeMEE populations. For each of the 16 founders, the composition of reconstructed haplotypes is shown for A6140 (top), CA[1-3]50 (middle) and CA[1-3]100 (bottom) RILs, averaging over populations for CA lines. Identity at segregating markers in 5 kb windows is plotted, color intensity scales with frequency (see Supplementary Figure S5A for quantities). (B) Upper row: haplotype divergence across all CeMEE RILs in each 5 kb window (entropy, high values indicating low divergence), against the expectation of equal representation of all 16 founders. Outliers highlighted span known loci zeel-1/peel-1 (a), fog-2 (k; an experimental artifact from introgression of a null allele into GT populations), and npr-1 (l). Other labeled, well-localized peaks of divergence correspond to selection of (b) CB4856 haplotypes upstream of vab-10, (c) hyperdivergent CB4852 haplotypes, (d) hyperdivergent MY16 haplotypes, centered on gsy-1, (e) MY1 haplotypes spanning vab-7, (f-h) long, recombined MY16 and CB4856 haplotypes nearing fixation, (i) hyperdivergent CB4856 haplotypes, and (j) MY16 haplotypes with unique variants in srr-3, cpr-2 and four other genes. Second row: as above, but against the expectation of equal proportions of the unique SNV founder haplotypes observed in each window, with a locally-weighted (LOESS) polynomial regression.
Figure 6
Figure 6
Frequencies of candidate new mutations estimated from RILs of A6140 and three derived control (CA) replicate lineages sampled at G + 50 and G + 100. Of 12,826 filtered diallelic SNVs, the majority (11,695) arose sometime before sampling in A6140, and many were maintained in CA populations (10,511 detected in at least one lineage at generation 50 and 100, 5293 detected in all six). For each derived population, variants are split and colored by class (gained, fixed, maintained or lost, labeled at left for CA100 populations). All unlabeled axes are consistent across plots.

References

    1. Andersen EC, Bloom JS, Gerke JP, Kruglyak L. 2014. A variant in the neuropeptide receptor npr-1 is a major determinant of Caenorhabditis elegans growth and physiology. PLoS Genet. 10:e1004156. - PMC - PubMed
    1. Andersen EC, Gerke JP, Shapiro JA, Crissman JR, Ghosh R, et al. 2012. Chromosome-scale selective sweeps shape Caenorhabditis elegans genomic diversity. Nat Genet. 44:285–290. - PMC - PubMed
    1. Atwal GS, Bond GL, Metsuyanim S, Papa M, Friedman E, et al. 2007. Haplotype structure and selection of the MDM2 oncogene in humans. Proc Natl Acad Sci USA. 104:4524–4529. - PMC - PubMed
    1. Barton NH. 2017. How does epistasis influence the response to selection? Heredity. 118:96–109. - PMC - PubMed
    1. Barton NH, Keightley PD. 2002. Multifactorial genetics: understanding quantitative genetic variation. Nat Rev Genet. 3:11–21. - PubMed

Publication types

LinkOut - more resources