. 2021 May 12;76(6):1580-1592.
doi: 10.1093/jac/dkab054.

Reduced Trypanosoma cruzi-specific humoral response and enhanced T cell immunity after treatment interruption with benznidazole in chronic Chagas disease

Affiliations

Reduced Trypanosoma cruzi-specific humoral response and enhanced T cell immunity after treatment interruption with benznidazole in chronic Chagas disease

Melisa D Castro Eiro et al. J Antimicrob Chemother. .

Abstract

Background: Interruption of benznidazole therapy due to the appearance of adverse effects, which is presumed to lead to treatment failure, is a major drawback in the treatment of chronic Chagas disease.

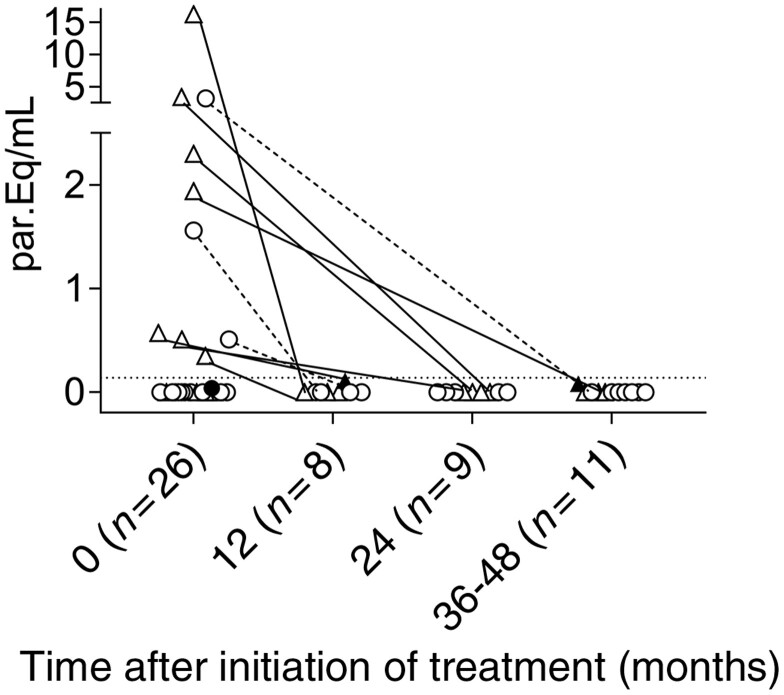
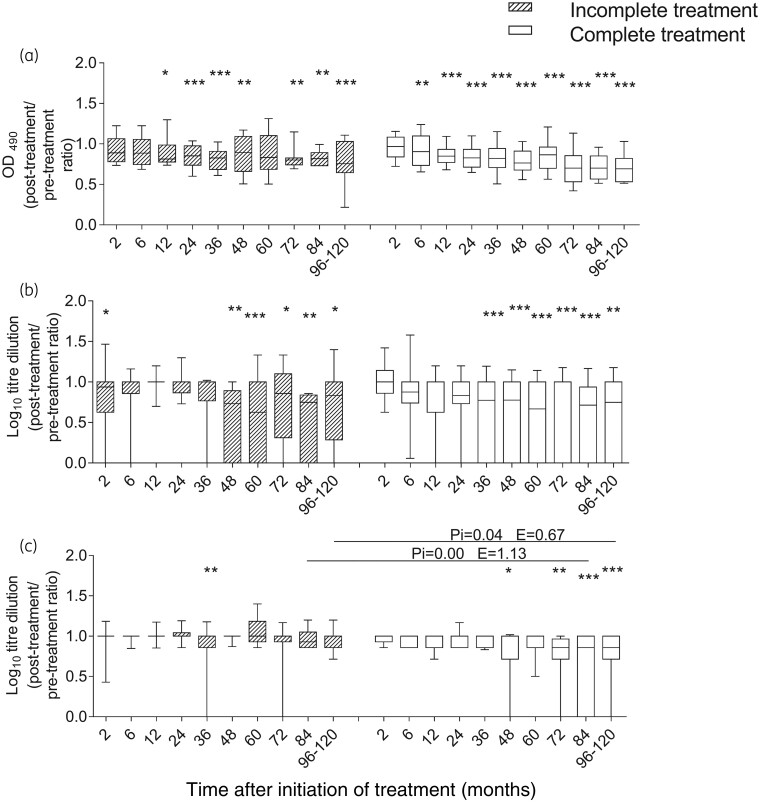
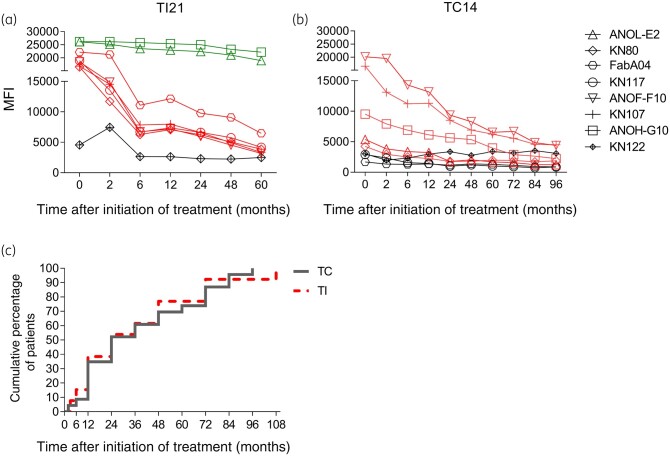
Methods: Trypanosoma cruzi-specific humoral and T cell responses, T cell phenotype and parasite load were measured to compare the outcome in 33 subjects with chronic Chagas disease treated with an incomplete benznidazole regimen and 58 subjects treated with the complete regimen, during a median follow-up period of 48 months.

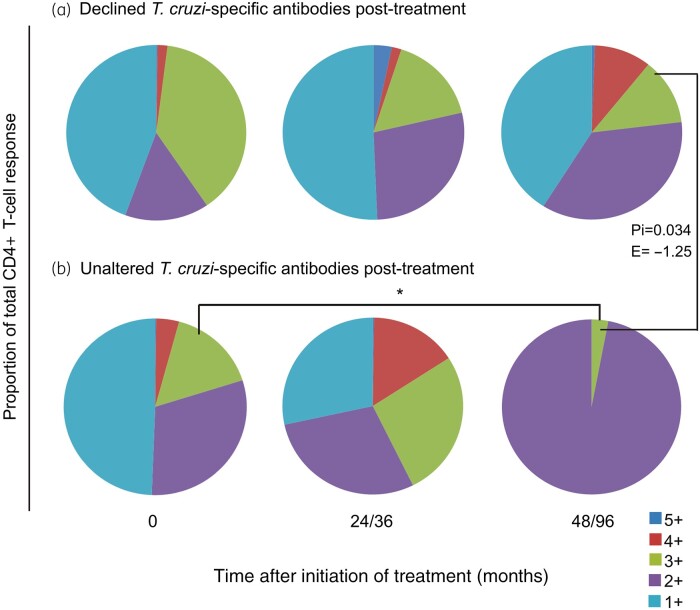
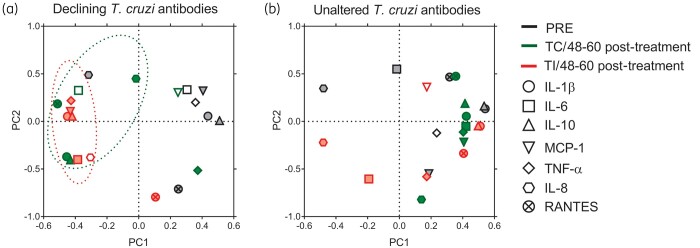
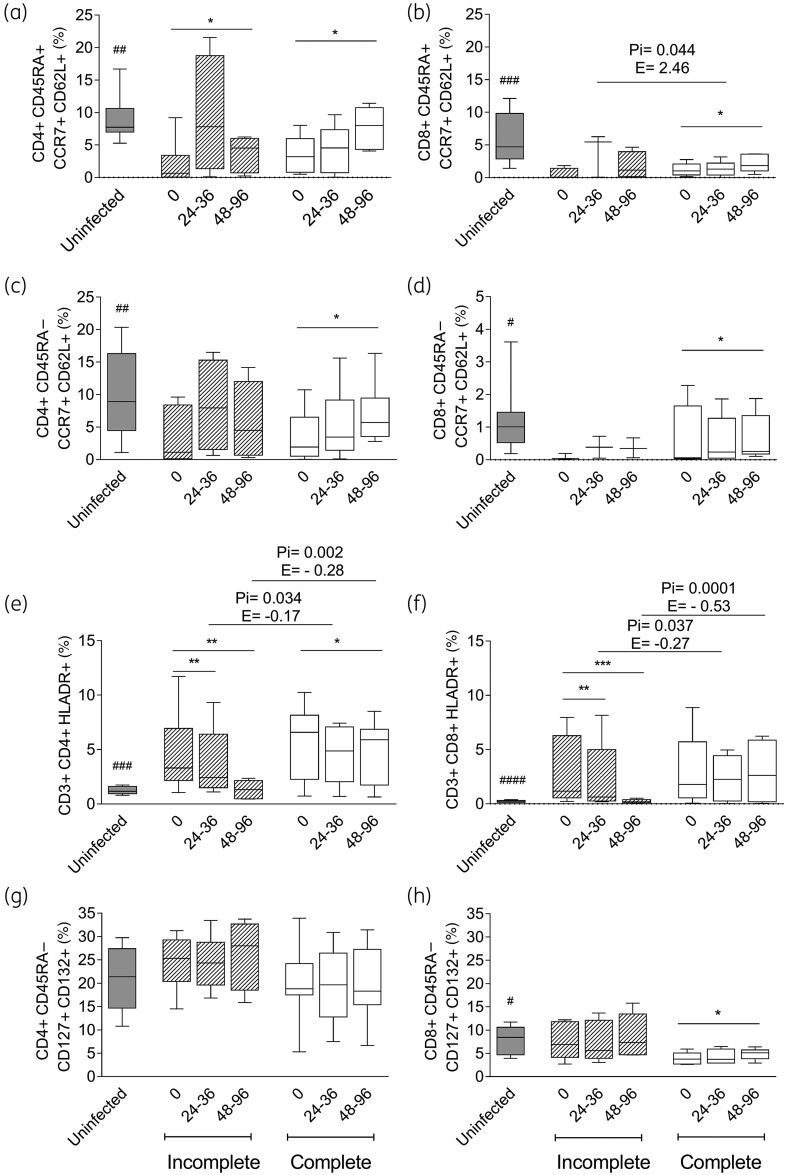
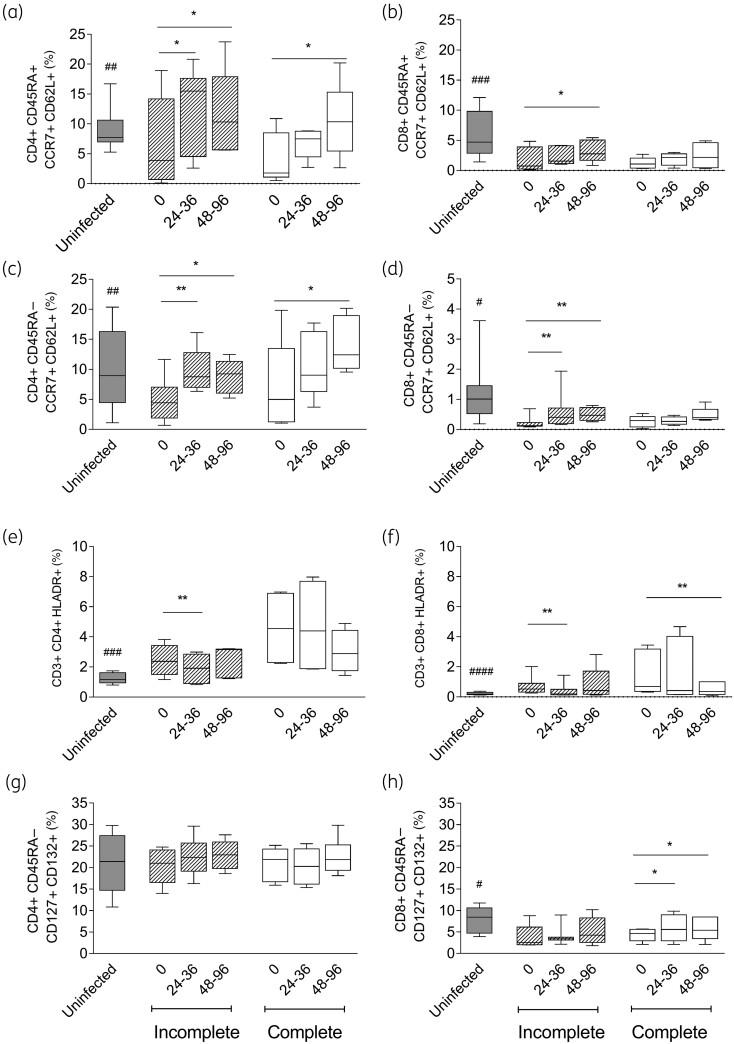
Results: Both treatment regimens induced a reduction in the T. cruzi-specific antibody levels and similar rates of treatment failure when evaluated using quantitative PCR. Regardless of the regimen, polyfunctional CD4+ T cells increased in the subjects, with successful treatment outcome defined as a decrease of T. cruzi-specific antibodies. Regardless of the serological outcome, naive and central memory T cells increased after both regimens. A decrease in CD4+ HLA-DR+ T cells was associated with successful treatment in both regimens. The cytokine profiles of subjects with successful treatment showed fewer inflammatory mediators than those of the untreated T. cruzi-infected subjects. High levels of T cells expressing IL-7 receptor and low levels of CD8+ T cells expressing the programmed cell death protein 1 at baseline were associated with successful treatment following benznidazole interruption.

Conclusions: These findings challenge the notion that treatment failure is the sole potential outcome of an incomplete benznidazole regimen and support the need for further assessment of the treatment protocols for chronic Chagas disease.


Figures

Figure 1.
Figure 1.
Quantification of parasite DNA using quantitative PCR prior to and after incomplete or complete treatment regimens with benznidazole in subjects with chronic Chagas disease. Satellite DNA was quantified in adult subjects after incomplete (triangles, n = 14) and complete (circles, n = 12) treatment regimens. Each symbol represents the quantitative PCR value for each subject. Dotted lines represent the limit of quantification established at 0.14 parasites/mL of blood that contain equivalent amounts of DNA to the sample (i.e. par.Eq/mL). Closed symbols show samples with detectable but non-quantifiable DNA.
Figure 2.
Figure 2.
T. cruzi-specific humoral response measured using conventional serological tests in subjects with chronic Chagas disease undergoing incomplete and complete benznidazole treatment regimens. The post-treatment/pre-treatment antibody ratios measured using ELISA (a), IHA (b) and IIF assay (c) at different timepoints after benznidazole therapy are depicted. Medians and 10–90 percentile values are shown for the incomplete (striped boxes, n = 33) and complete (white boxes, n = 58) treatment groups. Changes from baseline (Time 0) and between groups were evaluated using a linear mixed model for repeated measures. *** P < 0.001, ** P < 0.01 and * P < 0.05 compared with pre-treatment values. Pi indicates the P value of the linear mixed model with interaction between the incomplete and complete treatment regimens. E is the estimate value of the linear mixed model comparing the incomplete and complete treatment groups.
Figure 3.
Figure 3.
T. cruzi-specific humoral response measured using the multiplex technique in subjects with chronic Chagas disease following incomplete and complete benznidazole regimens. Serum specimens were screened using a bead array-based multiplex serological assay. Plots a and b show representative data for a subject who underwent an incomplete regimen (TI21) (a) and a subject who underwent a complete regimen (TC14) (b), for the different proteins assessed. Each point represents the MFI of reactive (red and green lines) and non-reactive (black lines) proteins prior to treatment (Time 0) and at several post-treatment timepoints. Red lines and symbols indicate more than 50% decreased reactivity compared with baseline reactivity, while green lines and symbols indicate unaltered reactivity post-treatment. (c) Cumulative percentage of subjects reaching a significant decline in T. cruzi antibody levels following incomplete (TI, n = 14, red dotted line) or complete (TC, n = 21, grey line) benznidazole regimens.
Figure 4.
Figure 4.
Functionality of T. cruzi-specific CD4+ T cells in subjects with chronic Chagas disease before and after successful treatment with complete or incomplete benznidazole regimens. PBMCs were stimulated with a T. cruzi lysate preparation and analysed using flow cytometry for intracellular expression of IFN-γ, IL-2, TNF-α, MIP-1β and CD154 in CD4+ T cells. Lymphocytes were gated based on forward scatter (FSC) and side scatter (SSC) parameters, and CD3+ cells were then analysed for CD4 versus each marker. Cytokine co-expression profiles with one (1+), two (2+), three (3+), four (4+) and five (5+) functions were determined in subjects who underwent incomplete (n = 12) or complete (n = 7) treatment regimens, using the Boolean gating function of FlowJo software. A detected antigen-specific response was defined as a positive response when it was higher than the cut-off, at least twice the response with media alone and if there were at least three events. The contribution of each cytokine-producing subset to the total T. cruzi-specific CD4+ T cell response was assessed in donors showing a positive response in the intracellular staining assay. The average for each combination was calculated. Each slice of the pie chart represents the fraction of the total response that consists of CD4+ T cells positive for one to five functions (light blue, violet, green, red and blue, respectively) in subjects with declined (a) and unaltered (b) T. cruzi antibodies post-treatment, regardless of the type of regimen. Changes from baseline (Time 0) and between groups were evaluated using a linear mixed model for repeated measures. *P < 0.05 compared with pre-treatment values. Pi indicates the P value of the linear mixed model with an interaction between the incomplete and complete treatment regimens. E indicates the estimate value of the linear mixed model comparing the incomplete and complete treatment groups.
Figure 5.
Figure 5.
PCA of cytokine production in T. cruzi-infected subjects following incomplete or complete benznidazole treatment. CBA assays were conducted with the supernatants of T. cruzi-stimulated PBMCs of subjects with an incomplete (TI, n = 17) or complete (TC, n = 11) treatment regimen. Following log transformation, the principal components were extracted with eigenvalues of 1.0. Factor loadings >0, 4 or < −0.4 were considered as influential mediators (filled symbols). Loading plots depict the relationship between the first two principal components (PC1, PC2) and the expression of IL-1β, IL-6, IL-8, IL-10, monocyte chemoattractant protein-1 (MCP-1), regulated on activation, normal T cell expressed and secreted (RANTES) and TNF-α in the pre-treatment (PRE) stage and at 48–60 months after complete or incomplete treatment in subjects with declining T. cruzi antibodies (a; TC n = 4, TI n = 10) or unaltered T. cruzi antibodies (b; TC n = 7, TI n = 7).
Figure 6.
Figure 6.
Phenotypic profiles of CD4+ and CD8+ T cells in T. cruzi-infected subjects with declined T. cruzi-specific antibodies following incomplete or complete benznidazole treatment regimens. PBMCs were stained with the indicated monoclonal antibodies and analysed using flow cytometry. Lymphocytes were gated based on forward scatter (FSC) and side scatter (SSC) parameters. CD4+ or CD8+ T cells were then selected and analysed for the different T cell phenotypes. Bars indicate the median and IQR of the percentages of CD4+ or CD8+ T cells expressing a particular phenotype prior to (0) and after the incomplete (n = 8) or complete (n = 6) treatment regimen for the infected subjects and in the uninfected subjects (n = 10). Frequencies of naive (a and b), central memory (c and d), activated (e and f) and CD4+ and CD8+ T cells expressing IL-7R (g and h) are provided. *** P < 0.001, ** P < 0.01 and * P < 0.05 compared with pre-treatment values using a linear mixed model for repeated measures. Pi indicates the significant P value of the linear mixed model with interaction between the incomplete and complete treatment regimens. E indicates the estimate value of the linear mixed model. ####P < 0.0001, ###P < 0.001, ##P < 0.01 and #P < 0.05 compared with untreated T. cruzi-infected subjects (Time 0).
Figure 7.
Figure 7.
Phenotypic profiles of CD4+ and CD8+ T cells in T. cruzi-infected subjects with unaltered T. cruzi-specific antibodies following incomplete or complete benznidazole treatment regimens. PBMCs were stained with the indicated monoclonal antibodies and analysed using flow cytometry. Lymphocytes were gated based on forward scatter (FSC) and side scatter (SSC) parameters. CD4+ or CD8+ T cells were then selected and analysed for the different T cell phenotypes. Bars indicate the median and IQR of the percentages of CD4+ or CD8+ T cells expressing a particular phenotype prior to (0) after incomplete (n = 8) or complete (n = 6) treatment regimens for the infected subjects and in the uninfected subjects (n = 10). Frequencies of naive (a and b), central memory (c and d), activated (e and f) and CD4+ and CD8+ T cells expressing IL-7R (g and h) are provided. ** P < 0.01 and * P < 0.05 compared with pre-treatment values using a linear mixed model for repeated measures. No significant differences were found between the incomplete and complete treatment regimens applying a linear mixed model with treatment interaction. ####P < 0.0001; ###P < 0.001, ##P < 0.01 and #P < 0.05 compared with untreated T. cruzi-infected subjects (Time 0).

References

    1. WHO. Chagas disease (also known as American trypanosomiasis). 2018. http://www.who.int/news-room/fact-sheets/detail/chagas-disease-(american...).
    1. Antinori S, Galimberti L, Bianco R. et al. Chagas disease in Europe: a review for the internist in the globalized world. Eur J Intern Med 2017; 43: 6–15. - PubMed
    1. Ministerio de Salud Argentina. Guías para la atención al paciente infectado con Trypanosoma cruzi (Enfermedad de Chagas). https://bancos.salud.gob.ar/recurso/guias-para-la-atencion-al-paciente-i....
    1. Viotti R, Vigliano C, Lococo B. et al. Side effects of benznidazole as treatment in chronic Chagas disease: fears and realities. Expert Rev Anti Infect Ther 2009; 7: 157–63. - PubMed
    1. Crespillo-Andújar C, Venanzi-Rullo E, López-Vélez R. et al. Safety profile of benznidazole in the treatment of chronic Chagas disease: experience of a referral centre and systematic literature review with meta-analysis. Drug Saf 2018; 41: 1035–48. - PubMed

Publication types

MeSH terms