. 2021 May 7;13(5):evab048.
doi: 10.1093/gbe/evab048.

Large genetic diversity and strong positive selection in F-box and GPCR genes among the wild isolates of Caenorhabditis elegans

Affiliations

Large genetic diversity and strong positive selection in F-box and GPCR genes among the wild isolates of Caenorhabditis elegans

Fuqiang Ma et al. Genome Biol Evol. .

Abstract

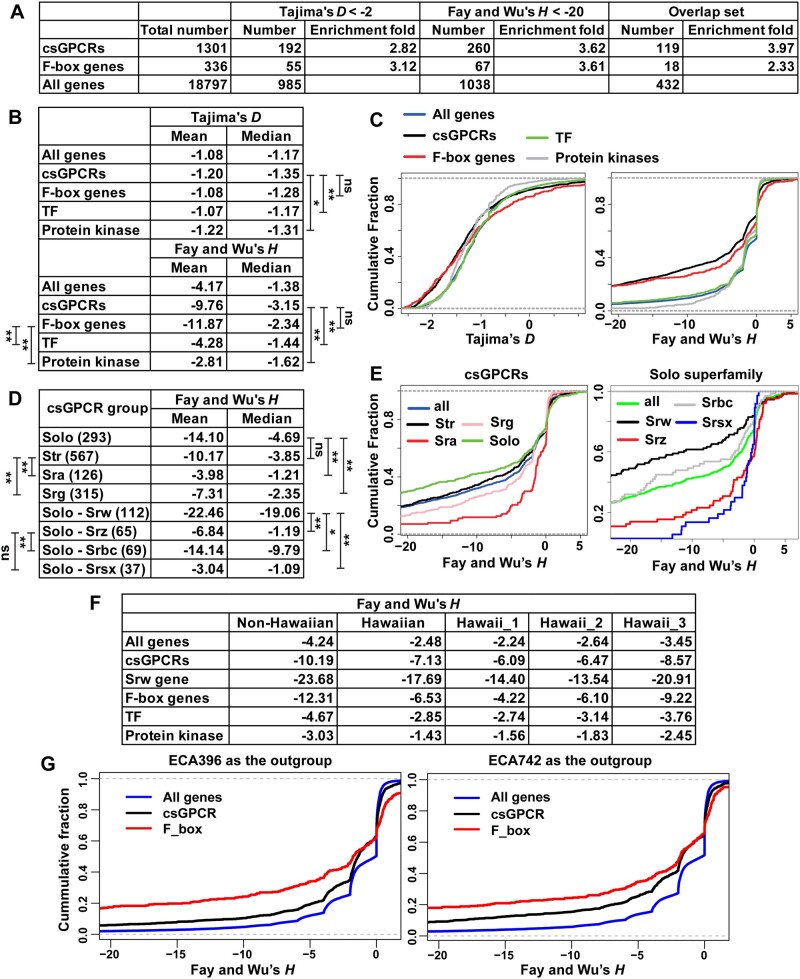
The F-box and chemosensory GPCR (csGPCR) gene families are greatly expanded in nematodes, including the model organism Caenorhabditis elegans, compared to insects and vertebrates. However, the intraspecific evolution of these two gene families in nematodes remain unexamined. In this study, we analyzed the genomic sequences of 330 recently sequenced wild isolates of C. elegans using a range of population genetics approaches. We found that F-box and csGPCR genes, especially the Srw family csGPCRs, showed much more diversity than other gene families. Population structure analysis and phylogenetic analysis divided the wild strains into eight non-Hawaiian and three Hawaiian subpopulations. Some Hawaiian strains appeared to be more ancestral than all other strains. F-box and csGPCR genes maintained a great amount of the ancestral variants in the Hawaiian subpopulation and their divergence among the non-Hawaiian subpopulations contributed significantly to population structure. F-box genes are mostly located at the chromosomal arms and high recombination rate correlates with their large polymorphism. Moreover, using both neutrality tests and Extended Haplotype Homozygosity analysis, we identified signatures of strong positive selection in the F-box and csGPCR genes among the wild isolates, especially in the non-Hawaiian population. Accumulation of high-frequency derived alleles in these genes was found in non-Hawaiian population, leading to divergence from the ancestral genotype. In summary, we found that F-box and csGPCR genes harbour a large pool of natural variants, which may be subjected to positive selection. These variants are mostly mapped to the substrate-recognition domains of F-box proteins and the extracellular and intracellular regions of csGPCRs, possibly resulting in advantages during adaptation by affecting protein degradation and the sensing of environmental cues, respectively.

Keywords: C. elegans; F-box; GPCR; polymorphisms; positive selection.


Figures

Fig. 1
Fig. 1
Large genetic polymorphism of csGPCR and F-box genes. (A) Genes with large Pi for nonsynonymous SNVs tend to be enriched in csGPCR and F-box gene families. Pi values of individual genes can be found in supplementary table S4, Supplementary Material online. (B) The cumulative distribution of the Pi values for all genes, csGPCR, F-box, TF, and protein kinases genes. (C) The mean and median of Pi for different gene families and for different csGPCR superfamilies. The number of genes are in parentheses. For statistical significance in a nonparametric Wilcoxon’s rank-sum test, ns means not significant, a single asterisk means P <0.05, and double asterisks mean P <0.01. Similar annotations apply for the rest of the figures.
Fig. 2
Fig. 2
Phylogenetic relationship of the C. elegans wild isolates. Neighbor-joining nets plotted using the nonsynonymous SNVs of all genes (A), F-box genes (B), csGPCRs (C), or Srw genes (D). C. brenneri, C. remanei, and C. briggsae were used as outgroups for tree construction. Three representative non-Hawaiian strains (in black) with high ancestral population fraction were chosen from each of the eight non-Hawaiian groups. Edges are labelled with “100,” if 100% bootstrap support was attained in 1,000 bootstrap replicates. To fit the trees into one figure, some branches connecting the three outgroups and the root are manually shortened (dashed lines).
Fig. 3
Fig. 3
csGPCR and F-box genes contribute to the large divergence of Hawaiian strains and the differentiation among non-Hawaiian subpopulations. (A) The mean of CDS length-normalized Pi of all genes, csGPCRs, Srw genes, F-box genes, TF, and Protein kinase for non-Hawaiian and Hawaiian populations, as well as the three Hawaiian subpopulations (see the grouping in Materials and Methods). (B) The average number of segregating sites that belong to only Hawaiian or non-Hawaiian strains and the sites that are shared by Hawaiian and non-Hawaiian strains for the six gene families. The number is also normalized to the CDS length of individual genes. The number of non-singleton segregating sites are in parentheses. (CE) The cumulative distribution of Hudson’s FST values for different gene families between the non-Hawaiian and Hawaiian populations (C), among the eight non-Hawaiian subpopulations (D), and among the three Hawaiian subpopulations (E). (F) The average FST value of different gene families among non-Hawaiian and among Hawaiian subpopulations.
Fig. 4
Fig. 4
High recombination rate may contribute to the large diversity of F-box genes. (A) Genomic location of F-box, csGPCR, protein kinase, and TF genes plotted using TBtools. (B) Recombination rates (Rho) and the density of SNVs across Chr II, III, and V in 50-kb windows. (C) The polymorphism for synonymous and nonsynonymous SNVs in the low (Rho = 0) and high (Rho > 0) recombination regions. (D) The Pearson correlation between recombination rate and the Pi of all SNVs for individual genes on Chr III.
Fig. 5
Fig. 5
Positive selection on F-box and csGPCR gene. (A) Enrichment of csGPCR and F-box genes among the genes with Tajima’s D < −2 and Fay and Wu’s H < −20, respectively. Overlap set include genes that fits both criteria. (B) The mean and median of Tajima’s D and Fay and Wu’s H values of all genes, csGPCRs, F-box, TF, and Protein kinase. (C) The cumulative distribution of different gene families. (D) The mean and median of Fay and Wu’s H values of genes in csGPCR superfamilies and Solo gene families. The number of genes are in parentheses. (E) The cumulative distribution of genes in csGPCR subfamilies and Solo families. The statistical significance was determined by Wilcoxon rank-sum test. (F) The average Fay and Wu’s H values of all genes, csGPCRs, Srw genes, F-box genes, TFs, and protein kinase for the non-Hawaiian and Hawaiian populations, as well as the three Hawaiian subpopulations. The above H values were all calculated using XZ1516 as the outgroup. (G) The cumulative distribution of the H values of all genes, csGPCR, or F-box genes calculated using ECA396 or ECA742 as the outgroup.
Fig. 6
Fig. 6
Selection on synonymous and nonsynonymous variants in F-box and csGPCR genes. (A) Mean values for Pi, Tajima’s D, and Fay and Wu’s H for different groups of genes calculated using synonymous or nonsynonymous SNVs. To compare the same set of genes for average Pi, we included the genes which has no synonymous or nonsynonymous SNVs (Pi = 0). So, the mean of Pi is slightly smaller than that in fig. 1C, which excluded the genes without nonsynonymous SNVs. (B) The mean and median of pN/pS ratios for different groups of genes and the cumulative distribution of the pN/pS ratios. (C) The average Fay and Wu’s H values for nonsynonymous and synonymous variants and the pN/pS ratios for different groups of genes in low and high recombination regions.
Fig. 7
Fig. 7
High-frequency-derived sites were mapped to the substrate recognition domain of a reprehensive F-box protein and the extracellular loops of a representative csGPCR. (A) Cumulative distribution of Pi and Fay and Wu’s H for nonsynonymous SNVs in the F-box domain or putative substrate-binding domains of F-box proteins. (B) Distribution of Pi and H for SNVs in the TM or extracellular or intracellular domains of csGPCRs. (C) The domain structure of a F-box protein encoded by fbxb-49. The F-box domain is in blue, and the type 2 F-box-associated (FBA_2) domain, likely involved in binding substrate, is in cyan. (D) The domain structure of a csGPCR encoded by srw-68. The predicted transmembrane (TM) domain is in green. Extracellular loops (Out.) and intracellular (In.) tails are indicated. In both (A) and (B), the panel immediately below the domain structure indicate the position of high-frequency-derived (>0.5) sites in non-Hawaiian populations using XZ1516 as the outgroup. Y axis indicate the frequency of the derived alleles among the non-Hawaiian population (black dots) or the Hawaiian population (red dots). Each dot indicates a nonsynonymous SNVs. SNVs causing amino acid substitution with PROVEAN score below −2.5 were shown. The lower two panels showed the high-frequency-derived sites in the non-Hawaiian population calculated using ECA396 (“Hawaii_1” strain; purple dots) or ECA742 (“Hawaii_2” strain; blue dots) as the outgroup.
Fig. 8
Fig. 8
F-box and csGPCR genes are enriched in the genomic regions with selective footprint identified by EHH analysis. (AC) Manhattan plots of the extent of haplotype homozygosity measured by the iHS within the non-Hawaiian population (A) and Hawaiian population (B). (C) Regions of selection in non-Hawaiian population but not the Hawaiian population indicated by the Manhattan plots of cross-population EHH (XPEHH). (D) The number of F-box and csGPCR genes that contain SNVs with significant iHS or XPEHH and their folds of enrichment. For extended regions, significant SNVs that are less than 50-kb apart were connected to generate regions with selective footprints. (E) The mean Fay and Wu’s H values for all genes, F-box, and csGPCR genes in the arms and the center of chromosome (Chr) II, III, and V. (F) The domain structure of a representative F-box protein coded by fbxa-85; the F-box domain is in blue and the FTH domain in cyan. (G) The domain structure of a representative csGPCR coded by srw-56; the predicted transmembrane (TM) domain is in green, and extracellular loops (Out.) and intracellular (In.) tails are also indicated. Among the sites whose XPEHH > 2 in the two genes, the ones that are also high-frequency-derived (> 0.5) sites with ECA396 (purple dots) and ECA742 (blue dots) as the outgroup are shown.

References

    1. Andersen EC, et al.2012. Chromosome-scale selective sweeps shape Caenorhabditis elegans genomic diversity. Nat. Genet. 44(3):285–290. - PMC - PubMed
    1. Angeles-Albores D, Lee RYN, Chan J, Sternberg PW.. 2018. Two new functions in the WormBase Enrichment Suite. Micropublication: biology. Dataset. - PMC - PubMed
    1. Bakowski MA, et al.2014. Ubiquitin-mediated response to microsporidia and virus infection in C. elegans. PLoS Pathog. 10(6):e1004200. - PMC - PubMed
    1. Begun DJ, Aquadro CF.. 1992. Levels of naturally occurring DNA polymorphism correlate with recombination rates in D. melanogaster. Nature 356(6369):519–520. - PubMed
    1. Bounoutas A, Zheng Q, Nonet ML, Chalfie M.. 2009. mec-15 encodes an F-box protein required for touch receptor neuron mechanosensation, synapse formation and development. Genetics 183(2):607–617. - PMC - PubMed

Publication types

Substances

LinkOut - more resources