. 2021 May 11;151(5):1073-1083.
doi: 10.1093/jn/nxab005.

Maternal Iron Deficiency Modulates Placental Transcriptome and Proteome in Mid-Gestation of Mouse Pregnancy

Affiliations

Maternal Iron Deficiency Modulates Placental Transcriptome and Proteome in Mid-Gestation of Mouse Pregnancy

Chang Cao et al. J Nutr. .

Abstract

Background: Maternal iron deficiency (ID) is associated with poor pregnancy and fetal outcomes. The effect is thought to be mediated by the placenta but there is no comprehensive assessment of placental responses to maternal ID. Additionally, whether the influence of maternal ID on the placenta differs by fetal sex is unknown.

Objectives: To identify gene and protein signatures of ID mouse placentas at mid-gestation. A secondary objective was to profile the expression of iron genes in mouse placentas across gestation.

Methods: We used a real-time PCR-based array to determine the mRNA expression of all known iron genes in mouse placentas at embryonic day (E) 12.5, E14.5, E16.5, and E19.5 (n = 3 placentas/time point). To determine the effect of maternal ID, we performed RNA sequencing and proteomics in male and female placentas from ID and iron-adequate mice at E12.5 (n = 8 dams/diet).

Results: In female placentas, 6 genes, including transferrin receptor (Tfrc) and solute carrier family 11 member 2, were significantly changed by maternal ID. An additional 154 genes were altered in male ID placentas. A proteomic analysis quantified 7662 proteins in the placenta. Proteins translated from iron-responsive element (IRE)-containing mRNA were altered in abundance; ferritin and ferroportin 1 decreased, while TFRC increased in ID placentas. Less than 4% of the significantly altered genes in ID placentas occurred both at the transcriptional and translational levels.

Conclusions: Our data demonstrate that the impact of maternal ID on placental gene expression in mice is limited in scope and magnitude at mid-gestation. We provide strong evidence for IRE-based transcriptional and translational coordination of iron gene expression in the mouse placenta. Finally, we discover sexually dimorphic effects of maternal ID on placental gene expression, with more genes and pathways altered in male compared with female mouse placentas.

Keywords: gene expression; iron deficiency; iron metabolism; placenta; proteomics.


Figures

FIGURE 1
FIGURE 1
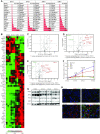
Iron gene expression in the mouse placenta across gestation. (A) The 15 most highly expressed iron metabolic genes in mouse placentas at different gestational ages by RT2profiler PCR iron array analysis. The expression value [2^(-ΔCt)] is the mean transcript expression relative to the housekeeping gene (n = 3 placentas/time point). (B) Clustergram of 60 iron genes that are significantly changed at E14.5, E16.5, or E19.5 compared to E12.5 placentas. (C–D) Volcano plots of iron array analyses of placentas at each gestational time interval. Upregulated genes are identified by red dots and downregulated genes by green dots. (F) Changes in genes of the canonical cellular iron transport across gestation. Fold change is the normalized gene expression relative to the E12.5 placentas (n = 3 placentas/time point). Data are presented as means ± SDs. Significant differences from baseline expression at E12.5 of Slc11a2 are indicated:*P < 0.05, Irp1; P < 0.05, Fth1; P < 0.05, Tfrc; §< 0.05, Fpn1; and P < 0.05. (G) Western blots of TFRC, FPN1, FTH1, and IRP1 in mouse placentas across gestation (n = 2–3 placentas/time point). (H) Immunofluorescence of TFRC (red) and FPN1 (green) in mouse placentas counter-stained with Hoechst nuclear dye (blue). Images were acquired using the Zeiss Observer D1 microscope with the 63 × 1.4 oil objective. Scale bar, 10 μm. Full definitions of all other genes in Figure 1 are given in Supplemental Table 3. Abbreviations: Ct, cycle threshold; E, embryonic day; FC, fold change; FPN1, ferroportin 1; FTH1, ferritin heavy chain 1; IRP1, iron regulatory protein 1; Slc11a2, solute carrier family 11 member 2; TFRC, transferrin receptor.
FIGURE 2
FIGURE 2
ID diet produces characteristic ID phenotype in pregnant mice. (A) Schematic of study design. We randomized 16 female 129S6/SvEvTac wild-type littermates to either the IA diet (50 ppm) or ID diet (<5 ppm) at weaning. At 2 to 3 weeks after weaning, females were paired with wild-type males, and placentas were harvested at E12.5. We used 12 female and male placenta pools from 3 IA and 3 ID dams for RT2 profiler PCR iron array, RNA-Seq, and proteomic analyses. (B) Hb in IA and ID animals before and after pregnancy (n = 8 animals/diet). Significantly different from the pre-pregnancy level in a paired t-test at *P < 0.05. (C–G) Maternal iron status measurements. Diet groups were compared by a 1-way ANOVA for normally distributed variables or by a Kruskal-Wallis test for liver Hamp mRNA and serum hepcidin. (H) Embryo CRL and (I) the mean of placental disk diameters of each litter were calculated and compared between diet groups (n = 8 litters/diet). (J) Non-heme iron concentration in IA and ID placentas (n = 8 placentas/diet). Values are presented as means ± SDs. Significant difference from the IA group are noted: *P < 0.05, **P < 0.001. Abbreviations: CRL, crown rump length; E, embryonic day; Hb, hemoglobin; Hamp, hepcidin; IA, iron adequate; ID, iron deficient; Tfrc, transferrin receptor.
FIGURE 3
FIGURE 3
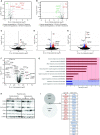
Maternal ID alters the transcriptome and proteome in mid-gestation mouse placentas. Iron PCR array analyses of placental iron gene expression in (A) female placentas (n = 3 placenta pools/diet) and (B) male placentas (n = 3 placenta pools/diet). Upregulated genes in ID placentas are represented by red dots; downregulated genes in ID placentas are shown as green dots. (C–E) Volcano plots of RNA-Seq comparison between maternal ID and IA diets in female placentas (n = 3 placenta pools/diet), male placentas (n = 3 placenta pools/diet), and combined placentas (n = 6 placenta pools/diet). Red dots represent upregulated genes in ID placentas and blue dots represent downregulated genes in ID placentas compared to IA placentas. (F) Volcano plot of proteomic comparison between ID and IA diets in the combined placentas (n = 6 ID placenta pools and n = 5 IA placenta pools). Red dots represent proteins upregulated by more than 1.5-fold in ID placentas and blue dots represent proteins downregulated by more than 1.5-fold in ID placentas compared to IA placentas. (G) Gene ontology enrichment analysis of differentially expressed proteins between ID and IA placentas in the combined analyses. Biological processes with more than 20 proteins are included in the graph. Significant biological process is defined as adjusted < 0.05. (H) Western blot of selected iron proteins identified in proteomic analysis using the same pooled placental protein samples. (I) Venn diagram showing the numbers of differentially regulated genes and proteins by maternal ID identified in RNA-Seq and proteomic analyses in the combined placentas. The sizes of circles and the overlapping areas correspond to the numbers of genes and proteins in each category. Overlapping genes are listed next to the diagram. Upregulated genes in ID placentas are labeled in red and downregulated genes in ID placentas are in blue. *Genes with different direction of change at the protein level. Full definitions of all proteins identified in proteomic analysis, including those in Panels F and I, are provided in Supplemental Table 5. Abbreviations: Ankrd37, ankyrin repeat domain 37; Cts6, cathepsin 6; FC, fold change; Gypa, glycophorin A; Hemgn, hemogen; Hp, haptoglobin; IA, iron adequate; ID, iron deficient; Il1a, interleukin 1 alpha; ncRNA, non-coding RNA; Nox1, NAD(P)H oxidase 1; rRNA, ribosomal RNA; Slc11a1, solute carrier family 11 member 1; Slc11a2, solute carrier family 11 member 2; Slc39a8, solute carrier family 39 member 8; Tfrc, transferrin receptor; Tfr2, transferrin receptor 2; Tmcc2, transmembrane and coiled-coil domain family 2; Tlr9, toll-like receptor 9.

References

    1. Vos T, Abajobir AA, Abate KH, Abbafati C, Abbas KM, Abd-Allah F, Abdulkader RS, Abdulle AM, Abebo TA, Abera SF, et al. , Global, regional, and national incidence, prevalence, and years lived with disability for 328 diseases and injuries for 195 countries, 1990–2016: a systematic analysis for the Global Burden of Disease Study 2016. Lancet. 2017;390:1211–59. - PMC - PubMed
    1. Georgieff MK. Iron deficiency in pregnancy. Am J Obstet Gynecol. 2020;223:516–24. - PMC - PubMed
    1. De Benoist B, Cogswell M, Egli I, McLean E. Worldwide prevalence of anaemia 1993–2005. Geneva: WHO Global Database of Anaemia; 2008.
    1. Gupta PM, Hamner HC, Suchdev PS, Flores-Ayala R, Mei Z. Iron status of toddlers, nonpregnant females, and pregnant females in the United States. Am J Clin Nutr. 2017;106:1640S–6S. - PMC - PubMed
    1. Viteri FE. The consequences of iron deficiency and anemia in pregnancy. Adv Exp Med Biol. 1994;352:127–39. - PubMed

Publication types