Review
. 2021 Jul;17(27):e2004289.
doi: 10.1002/smll.202004289. Epub 2021 Mar 10.

Operando Surface Spectroscopy and Microscopy during Catalytic Reactions: From Clusters via Nanoparticles to Meso-Scale Aggregates

Affiliations
Review

Operando Surface Spectroscopy and Microscopy during Catalytic Reactions: From Clusters via Nanoparticles to Meso-Scale Aggregates

Günther Rupprechter. Small. 2021 Jul.

Abstract

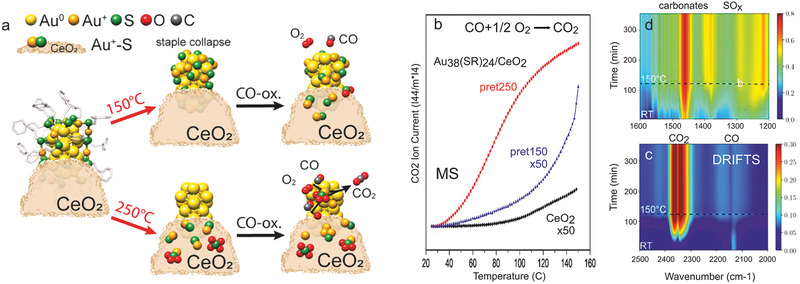
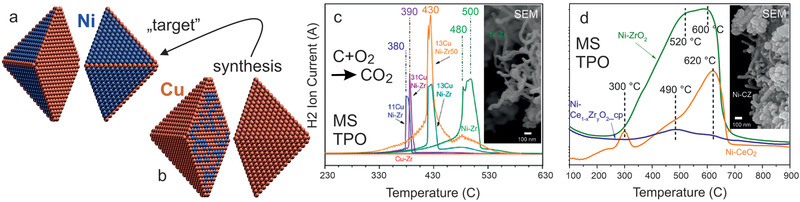
Operando characterization of working catalysts, requiring per definitionem the simultaneous measurement of catalytic performance, is crucial to identify the relevant catalyst structure, composition and adsorbed species. Frequently applied operando techniques are discussed, including X-ray absorption spectroscopy, near ambient pressure X-ray photoelectron spectroscopy and infrared spectroscopy. In contrast to these area-averaging spectroscopies, operando surface microscopy by photoemission electron microscopy delivers spatially-resolved data, directly visualizing catalyst heterogeneity. For thorough interpretation, the experimental results should be complemented by density functional theory. The operando approach enables to identify changes of cluster/nanoparticle structure and composition during ongoing catalytic reactions and reveal how molecules interact with surfaces and interfaces. The case studies cover the length-scales from clusters via nanoparticles to meso-scale aggregates, and demonstrate the benefits of specific operando methods. Restructuring, ligand/atom mobility, and surface composition alterations during the reaction may have pronounced effects on activity and selectivity. The nanoscale metal/oxide interface steers catalytic performance via a long ranging effect. Combining operando spectroscopy with switching gas feeds or concentration-modulation provides further mechanistic insights. The obtained fundamental understanding is a prerequisite for improving catalytic performance and for rational design.

Keywords: clusters; heterogeneous catalysis; interfaces; nanoparticles; operando; surface science.


Conflict of interest statement

The author declares no conflict of interest.

Figures

Figure 1
Figure 1
Bridging length‐scales of supported catalysts from clusters via nanoparticles to meso‐sized aggregates. The models illustrate the orders of magnitude: a) cluster of 11 atoms (with all but one on the surface), b) ≈2 nm nanoparticle with >100 atoms (with about 60% on the surface), c) ≈5 nm nanoparticle with >1000 atoms (with about 30% on the surface) and d) ≈100 µm aggregate with >1015 atoms (with about 10−3% on the surface). e–g) display ligand removal and restructuring of supported Au38 clusters upon oxidative treatments. In (h), some possible structural and compositional changes of catalysts are illustrated. e–g) Adapted with permission.[ 99 ] Copyright 2018, Wiley‐VCH. h) Adapted with permission.[ 100 ] Copyright 2008, IOP Publishing.
Figure 2
Figure 2
Key concept of the operando approach to heterogeneous catalysis. Using dedicated cells (dashed line), spectroscopy, microscopy or diffraction is performed on the catalyst under working conditions, while simultaneously monitoring catalytic performance, for example, by GC/MS analysis of reactants and products. Methods discussed below serve as examples.
Figure 3
Figure 3
a) Illustration of operando X‐ray absorption spectroscopy (XAS) in transmission and fluorescence mode.[ 139 ] Various cells are shown: b) quartz tube (Swiss Light Source), c) quartz capillary (TU Wien[ 131b ]), d) transmission cell (MAX‐LAB II, l811), and e) fluorescence cell (ALBA, CLAESS), with the inset showing the pellet holder.
Figure 4
Figure 4
Illustration of operando near ambient pressure X‐ray photoelectron spectroscopy (NAP‐XPS):[ 61 , 62 ] a) measurement geometry and b) sample (holder)‐nozzle arrangement, (c) shows a differentially‐pumped (pre‐)lense system, d) overview of NAP‐XPS at HZB/BESSY II (ISISS), and e) interchangeable in situ cells, a) Adapted with permission.[ 61 ] Copyright 2010, Elsevier. c, d) Adapted with permission.[ 62 ] Copyright 2013, The Royal Society of Chemistry.
Figure 5
Figure 5
Illustration of operando infrared spectroscopy in a,b) transmission, c,d) diffuse reflectance, and e,f) attenuated total reflection mode. Cell design and IR beam paths are shown in the lower row (b,d,f).
Figure 6
Figure 6
a) Illustration of operando photoemission electron microscopy (PEEM) and kinetics by imaging:[ 97 , 185 , 186 , 187 ] a) an ongoing catalytic reaction on a structurally‐heterogeneous sample, for example, a polycrystalline Pd foil, is monitored simultaneously by PEEM and MS. Local data obtained from the intensity analysis of PEEM video‐sequences for each individual (hkl)‐domain (µm‐scale) are compared with global (averaged) MS data. The selected region of interest (ROI) may be an individual µm‐sized domain or an oxide‐supported metallic agglomerate. b–d) Schematical comparison of the PEEM intensity of a clean (dashed line), O‐covered and CO‐covered Pd surface, enabling to differentiate catalytically active from inactive regions, as well as to monitor kinetic transitions. See the text for details. a) Adapted with permission.[ 189 ] Copyright 2013, Springer.
Figure 7
Figure 7
Activation of Au38(SR)24 nanoclusters supported on CeO2 (nominal Au loading 1.4 wt%): a) Initial structure with characteristic distances and b) corresponding MALDI‐MS spectrum. c) HAADF‐STEM images after activation in O2 at 250 °C and CO oxidation. d) XANES S K‐edge spectra of the unsupported clusters, the thiol ligand supported on CeO2 and the Au38/CeO2 catalysts (after deposition). The red arrows illustrate the changes upon oxidation at 150 °C and 250 °C. e) S 2p and Au 4f (inset) core level XPS spectra after activation at 150 °C. f) analysis and fit (red) of in situ EXAFS spectra of the as‐prepared catalyst, after activation (at 150 or 250 °C) and post‐reaction. a,b,c,f) Adapted with permission.[ 27 ] Copyright 2020, American Chemical Society. d,e) Adapted with permission.[ 99 ] Copyright 2018, Wiley VCH.
Figure 8
Figure 8
Dynamic structure changes of Au38(SR)24 clusters on CeO2 upon activation and CO oxidation reaction (derived from in situ EXAFS, ex situ HAAD‐STEM, XPS) and operando DRIFTS: a) schematics. b) MS analysis of CO oxidation on Au38(SR)24/CeO2 and (pure) CeO2 (3.3% CO, 7% O2, 89.7% He, total flow: 60 mL min−1, ramp: 5 °C min−1; CO2 traces were normalized to the catalyst mass and the He signal). Operando DRIFTS of Au38/CeO2 activated at 250 °C, from room temperature to 150 °C: c) 2500–2000 cm−1 and d) 1600–1200 cm−1. Adapted with permission.[ 27 ] Copyright 2020, American Chemical Society.
Figure 9
Figure 9
a) TEM and b) HRTEM images of Ni/ZrO2. c) HRTEM and elemental EDX mapping (K edge) of 1:1 CuNi/ZrO2. The encircled nanoparticle contained both Cu and Ni. d) In situ XANES K‐edge spectra during reduction in H2. e) Ni 2p3/2 and f) Cu 2p3/2 in situ XPS of 1:3 CuNi/ZrO2 in 0.25 mbar H2 at 400°C (E kin of 150 eV). g) infrared spectra of reduced catalysts in 5 mbar CO pressure (solid lines) and after evacuation (dashed lines) at room temperature. a,b) Adapted with permission.[ 263 ] Copyright 2016, Elsevier. c,e,f) Adapted with permission.[ 264 ] Copyright 2015, The Royal Society of Chemistry. d,g) Adapted with permission.[ 265 ] Copyright 2013, Springer.
Figure 10
Figure 10
DFT‐derived surface and interior composition of bimetallic nanoparticles: Cu35Ni105 (1:3), Cu70Ni70 (1:1) and Cu105Ni35 (3:1), with optimized chemical ordering. Color code: Cu—redwood, Ni—blue. Adapted with permission Copyright 2017, Elsevier.
Figure 11
Figure 11
Hydrogen evolution and surface composition changes during methane decomposition. MS traces on a) 1:3 CuNi/ZrO2 and b) Ni/ZrO2. Catalysts were reduced at 400 °C, followed by 3 heating (solid lines) / cooling (dashed lines) cycles (5 °C min−1) between 300 and 500 °C in CH4/Ar. c) Ni 2p3/2 and d) C1s XPS of 1:3 CuNi/ZrO2 in 0.25 mbar CH4 upon heating from 250 to 450 °C (E kin of 150 eV; incident photon energies were 1100, 1010, and 425 eV for Cu, Ni, and C, respectively). The models of Cu70Ni70 in (c) illustrate the Ni segregation to the surface, induced by CH x groups detected in d). Adapted with permission.[ 264 ] Copyright 2015, The Royal Society of Chemistry.
Figure 12
Figure 12
Model of the “ideal” CuNi nanoparticle (2435 Cu atoms and 840 Ni atoms, 3275 atoms in total). a) target structure under reaction conditions and b) as‐synthesized. Temperature programmed oxidation (CO2 (m/z 44) trace upon heating in 20 vol% O2/Ar; 5 K min−1) after methane decomposition on (c) CuNi/ZrO2 and Ni/ZrO2 catalysts, and (d) after reforming on Ni/ZrO2, Ni/CeO2 and Ni/Ce1‐ x Zr x O2 (24 h). The insets in (c) and (d) are post‐reaction SEM images displaying different amounts of carbon filaments. c) Adapted with permission.[ 264 ] Copyright 2015, The Royal Society of Chemistry. d) Adapted with permission.[ 263 ] Copyright 2016, Elsevier.
Figure 13
Figure 13
Operando surface microscopy of CO oxidation on oxide‐supported µm‐sized Pd aggregates (“Pd black”): a) optical micrograph and b) Pd 3d XPS spectrum of the clean metallic Pd particles. Comparison of the kinetic behavior of individual ZrO2‐supported and “quasi‐unsupported” Pd particles: c) schematic illustration of the concept (PEEM intensity versus pCO) and d–l) PEEM imaging of CO poisoning. Detailed conditions of PEEM images: d) field of view with several supported Pd agglomerates. e,f) Pd agglomerate marked in (d) in the active steady state (oxygen covered) upon increasing the CO pressure to 4 × 10−5 mbar at constant T = 200 °C and pO2  = 1.3 × 10⁻⁵ mbar. g) isothermal kinetic transition (propagation of the CO front) to the inactive steady state at pCO  = 4×10⁻⁵ mbar. h) Local PEEM intensity of the oxide supported Pd agglomerate marked in d) (green curve) and of the Pt‐supported Pd particle marked in (i) (red curve). (i) Pd agglomerates of similar size as in (d), but supported by Pt. j) Pd agglomerate marked in (i) being in the active state at the same T and p O2 as in (e–g) and at p CO < 2×10⁻⁵ mbar. k) kinetic transition to the inactive state (CO front propagates) at pCO  = 2×10⁻⁵ mbar. l) Pd agglomerate in the inactive state (CO covered) at p CO > 2×10⁻⁵ mbar. Note that under these conditions, the oxide supported Pd agglomerate f) still remains active (oxygen covered). Adapted with permission.[ 183 ] Copyright 2018, Springer Nature.
Figure 14
Figure 14
Local kinetic data for CO oxidation on Pd, derived from PEEM kinetics by imaging. a) Kinetic phase diagram for CO oxidation on the individual Pd agglomerate supported by ZrO2 marked in Figure 13d (p O2 = 1.3 × 10⁻⁵ mbar). The left inset displays how the t A and t B values are deduced from the PEEM intensity hysteresis during a cycle‐wise variation of p CO at 200 °C. The right inset shows the kinetic transition t B from the inactive to the active steady state. b) comparison of catalytic behaviour of Pd/ZrO2, Pd supported on Pt and a Pd(111) domain of a polycrystalline Pd foil. Adapted with permission.[ 183 ] Copyright 2018, Springer Nature.
Figure 15
Figure 15
Origin of the long‐ranging effect of the nano‐scale metal/oxide interface on CO oxidation on Pd, reaching over hundreds of µm. a) optical micrograph and b) schematic illustration. Results of DFT calculations of oxygen adsorption energies on c) unsupported, d) cubic ZrO2(111)‐supported and e) MgO(100)‐supported Pd119 particles with respect to ½O2 gas phase molecule. The values of E ads(O) in kJ mol−1 are calculated for fcc sites. Pd atoms on edges and corners are displayed as turquoise spheres and those on terraces as cyan spheres; Zr, O, and Mg atoms are displayed as grey, red and green spheres, respectively. Adapted with permission.[ 183 ] Copyright 2018, Springer Nature.
Figure 16
Figure 16
a) Illustrated optical 3D image of meso‐scale Rh particles supported by ZrO2. The catalytic H2 oxidation reaction on Rh is visualized in situ by PEEM. b) Oxide supported Rh particles: the row of video‐frames illustrates the kinetic transition τA from the inactive to the active steady state upon variation of the H2 pressure between 1 × 10−7 and 8 × 10−6 mbar at 180 °C and constant p O2 of 7.7 × 10⁻⁷ mbar. The inactive (oxygen covered) Rh surface is marked with “ox.” in frame 2, the active Rh surface with “red”. The corresponding PEEM intensity curve is shown on the right. c) Analogous measurements for unsupported sputtered polycrystalline Rh foil. Adapted with permission.[ 184 ] Copyright 2018, Elsevier.
Figure 17
Figure 17
a) CO oxidation activity of Co3O4 in 5 vol.% CO, 10 vol.% O2 and 85 vol.% He (total flow 50 mL min−1) after different pretreatments. The inset shows a HRTEM image. b) Operando NAP‐XPS on Co3O4 during O2/CO switching (0.15 mbar O2 versus 0.15 mbar CO; hν = 1015 eV; KE = 200 eV; probing depth ≈0.6 nm): comparison in O2 and CO at RT and 200 °C, and difference spectrum (CO 200 °C‐ O2 RT). c) Corresponding catalytic MS data: evolution of CO2 upon switching between O2 and CO at different temperatures. d) Operando FTIR on Co3O4 upon CO/O2 switching (50 mbar CO vs 50 mbar O2): spectra recorded during the 10th minute of CO exposure (black), during the 2nd minute of O2 exposure (red) and during the 10th minute of O2 exposure (green). Monodentates in red, bidentates in blue. Adapted with permission.[ 59 ] Copyright 2018, American Chemical Society.
Figure 18
Figure 18
a) TEM Micrograph of Pd2Ga/Ga2O3. b) MS and c) corresponding DRIFTS traces recorded during three modulation periods (82 s each) of pulsing H2O/Ar into a steady CH3OH/Ar flow (1%CH3OH/Ar vs 1%CH3OH/1%H2O/Ar at 250 °C). Arrows indicate when the spectra used to calculate the averaged spectra of d) (top) were recorded. d) Two selected averaged time‐resolved spectra recorded at the end of each half‐period (top) and corresponding phase‐resolved spectra in a phase angle range of 0–60° calculated using phase sensitive detection (PSD). e) Scheme of mechanistic insights from operando concentration modulation IR. Adapted with permission.[ 72 ] Copyright 2012, American Chemical Society.

References

    1. Ertl G., Knözinger H., Weitkamp J., Handbook of Heterogeneous Catalysis, Wiley‐VCH, Weinheim: 2008.
    1. Wandelt K., Surface and Interface Science, Wiley‐VCH, Weinheim: 2016.
    1. Rupprechter G., Weilach C., Nano Today 2007, 2, 20.
    1. Bell A. T., Science 2003, 299, 1688. - PubMed
    1. Campbell C. T., Surf. Sci. Rep. 1997, 27, 1.

LinkOut - more resources