. 2021 Apr 16;128(8):1173-1190.
doi: 10.1161/CIRCRESAHA.120.318124. Epub 2021 Mar 11.

MIR503HG Loss Promotes Endothelial-to-Mesenchymal Transition in Vascular Disease

Affiliations

MIR503HG Loss Promotes Endothelial-to-Mesenchymal Transition in Vascular Disease

João P Monteiro et al. Circ Res. .

Abstract

[Figure: see text].

Keywords: endothelial cells; lncRNA; microRNAs; pulmonary arterial hypertension; vascular remodeling.


Figures
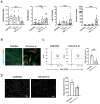
Figure 1
Figure 1. EndMT in vitro modelin venous EC.
HUVEC were treated with TGF-β2 (10 ng/mL) and/or IL-1β (1 ng/mL) for 7 days. (A) Expression analysis of EndMT markers by RT-qPCR relative to UBC (relative quantification:RQ). (PECAM1 n=5, ACTA2, SNAI2 and COL1A1 n=8). Statistical analysis was done using a repeated measures one-way ANOVA with Bonferroni correction. (B) Representative images of immunofluorescence staining for PECAM1 (green), SNAI2 (red) and DAPI (blue) (scale bar 50 μm). (C) Quantification of EdU uptake in untreated and treated HUVECs (n=4) with representative FACS histogram plots. (D) Transwell migration assay of treated and untreated HUVECs with representative image of fixed migrated cells stained with DAPI (scale bar 100μM) and quantification (n=3). Statistical analysis of panel C and D was done using linear mixed effects modelling.
Figure 2
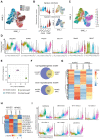
Figure 2. single-cell and bulk RNAseq analysis of EndMT identify a common lncRNA signature
(A) tSNE plot of the 5 datasets (untreated HUVEC at day 0, 3 and 7 and TGF-β2 + IL-1β co-treated HUVEC at day3 and day7). (B) Violin and tSNE plots of endothelial and mesenchymal signature (C) Unsupervised cluster identification (D) Violin plot of endothelial (PECAM1, ICAM2), mesenchymal (TAGLN, COL1A1), EndMT (SNAI2) and proliferation (MKI67) marker expression (as z-score) in the different clusters. (E) Principal Component Analysis of control and EndMT-induced HUVEC and HPAEC (bulk RNAseq). (F) Overlap of EndMT up/down-regulated genes between HUVEC and HPAEC. (G) Heatmap of significantly regulated genes and (H) of candidate lncRNAs expression (as z-score). (I) Violin plot of candidate lncRNA expression in the scRNA-seq clusters.
Figure 3
Figure 3. MIR503HG expression during EndMTin vitro.
(A) Schematic representation of the MIR503HG, miRNA-424 and miRNA-503 loci based on GENCODE v26 annotation. (B) Expression of miRNA-424/-503 in HUVEC ± EndMT (TGF-β2 + IL-1β) (n=4) (C) MIR503HG_2 expression in HSVEC and HCAEC ± EndMT (n=3). (D) MIR503HG_2 expression in HUVEC after treatment with TGF-β2 (50 ng/mL) and H2O2 (200nM) (n=3). (E) MIR503HG correlation to endothelial and mesenchymal signatures based on single-cell RNA-seq. (F) MIR503HG_2, 18S and NEAT1 localisation by cell fractionation. (G) Mean MIR503HG nuclear copy number compared to unstained negative control (n=4) (H) and localisation of MIR503HG, SNORD3, and UBC by RNA-FISH in HUVEC. Relative quantification of RT-qPCR normalized to RNU48 or UBC relative to Control cells. Statistical analysis was done using linear mixed effects modelling for panel B and C or a repeated measures one-way ANOVA with Bonferroni correction for panel D.
Figure 4
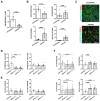
Figure 4. MIR503HG knockdown induces EndMT in HUVEC.
(A) MIR503HG_2 expression in siRNA-mediated MIR503HG depletion (si503HG) after 7 days in HUVEC (n=3) (B) EndMT markergene expression in si503HG compared to control after 7 days (n= 3). (C) Representative immunofluorescence images of EndMT markers expression in HUVEC (scale bar 50 μm) after knockdown using si503HG. PECAM1 (green), SNAI2 (red) and DAPI (blue). (D) MIR503HG_2 (Left: CRISPR/Cas9-targeted Exon3 (Ex3), right: untargeted Exon1 (Ex1)), (E) miR-424 and miR-503, and (F) EndMT marker gene expression in HUVEC following CRISPR-mediated deletion of MIR503HG, using two lentiviral CRISPR/Cas9 gRNA pairs, after 8 days compared to empty control pairs (n=5). Relative quantification of RT-qPCR normalised to RNU48 or UBC relative to Control cells. Statistical analysis was done using linear mixed effects modelling for panel A and B and a repeated measures one-way ANOVA with Bonferroni correction for panel D-F.
Figure 5
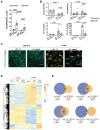
Figure 5. MIR503HG overexpression represses EndMT in vitro.
Expression of (A) MIR503HG_2 and (B) EndMTmarker genes in HUVEC following MIR503HG overexpression with LNT_503_2 (MOI 5) with or without TGF-β2 and IL-1β treatment (Control/EndMT) for 7 days (n=5). Relative quantification of RT-qPCR normalized to UBC relative to LNT_CT in Control cells. Analysis by two-way ANOVA with Bonferroni correction. (C) Representative immunofluorescence images of EndMT markers in HUVEC following MIR503HG overexpression. PECAM1 (green), SNAI2 (red) and DAPI (blue) (scale bar 50 μm). (D) Heatmap of the 1683 significant genes between LNT_503HG and LNT_CT in EndMT conditions (displayed as z-score). (E) Venn diagram of the overlap between significant changes due to MIR503HG overexpression in EndMT-cells (EndMT_LNT_503HG vs EndMT_LNT_CT) and EndMT changes (EndMT vs Control).
Figure 6
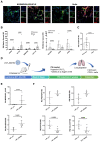
Figure 6. MIR503HG modulation in mouse is associated with EndMT in PAH
(A) Representative immunofluorescence staining of Normoxia/vehicle or SuHx mouse lung tissue for Cd31 (green), Dapi (blue) and Acta2 or Snai2 (red) (scale bar 50 μm). (B) Endothelial and mesenchymal markers expression in TdTomato+ cells isolated from Normoxia/vehicle (n=8) or SuHx mouse lung tissue (n=7). (C) MIR503HG mouse lncRNA homolog Gm28730 expression in in TdTomato+ cells isolated from Normoxia/vehicle (n=8 mice) or SuHx mouse lung tissue (n=7). (D) Strategy to assess the effect of human MIR503HG_2 overexpression in EndMT in SuHx PAH model (E) Human MIR503HG_2, MIR503HG mouse lncRNA homolog Gm28730 and (F) Endothelial/mesenchymal marker expression in CD31+ lung cells isolated from SuHx mouse lung tissue following MIR503HG overexpression with LNT_503HG or LNT_Control (LNT_503HG n=5, LNT_Control n=4). Relative quantification of RT-qPCR normalized to 18S relative to Normoxia (B-C) or LNT_CT (E-F). Statistical analysis of panel B and C was done using an unpaired two-tailed t-test except for Col1a1 expression, not following a normal distribution, analysed using a Mann-Whitney test. Panel E and F was analysed using Iman and Conover non-parametric ranking followed by unpaired two-tailed t-test.
Figure 7
Figure 7. Human PAH is associated with loss of MIR503HG
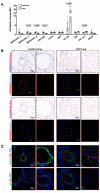
(A) MIR503HG_2 and EndMT markers gene expression in BOECs cells isolated from PAH patients and controls (control n=4, PAH n=5). Relative quantification of RT-qPCR normalized to UBC relative to Control cells. Analysis by Iman and Conover non-parametric ranking followed by unpaired two-tailed t-test. (B) In situ hybridization for MIR503HG in control and PAH patient lungs, with brightfield staining, and pseudo fluorescence imaging to enhance visualisation of MIR503HG (purple/red) and the nucleus (pink/blue). (C) Immunofluorescence for smooth muscle cells (ACTA2, green), endothelial cells (vWF, red) and nucleus (DAPI, blue), and IgG controls in control and PAH patient lungs. Scale bar 50μm. Dotted squares denote high-power view of vessels.
Figure 8
Figure 8. MIR503HG binding partner PTBP1 regulates EndMT
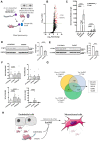
(A) Schematic of MIR503HG in-vitro pulldown experiment. (B) Dot plot of -log10 pvalue versus log2 fold change of MIR503HG_2 interacting proteins compared to GFP control after RNA pulldown assay and mass spectrometry (n=3) (C) RT-qPCR analysis of MIR503HG_2 and UBC in RNA immunoprecipitation of IgG, PTBP1 and HNRNPA0 from HUVEC lysate (n=3). (D) Western blot analysis of PTBP1 level in si503HG in HUVEC after 7 days. GAPDH used as a loading control. (E) Western blot analysis of PTBP1 level in CONTROL and EndMT HUVEC. GAPDH used as a loading control (F) EndMT marker expression in siPTBP1 samples 7 days after transfection (n=5). (G) Overlap of genes significantly down-regulated by LNT_503 in EndMT condition, up-regulated in EndMT compared to control and up-regulated by PTBP1 in HepG2 cells. Relative quantification of RT-qPCR normalized to UBC relative to siCONTROL treatment. Statistical analysis was done using a repeated measures one-way ANOVA with Bonferroni correction for panel C and F and linear mixed effects modelling for panel D-E.
None

References

    1. Kovacic JC, Dimmeler S, Harvey RP, Finkel T, Aikawa E, Krenning G, Baker AH. Endothelial to mesenchymal transition in cardiovascular disease: Jacc state-of-the-art review. J Am Coll Cardiol. 2019;73:190–209. - PMC - PubMed
    1. Manavski Y, Lucas T, Glaser SF, et al. Clonal expansion of endothelial cells contributes to ischemia-induced neovascularization. Circ Res. 2018;122:670–677. - PubMed
    1. Chen PY, Simons M. When endothelial cells go rogue. EMBO Mol Med. 2016;8:1–2. - PMC - PubMed
    1. Dejana E, Hirschi KK, Simons M. The molecular basis of endothelial cell plasticity. Nat Commun. 2017;8 14361. - PMC - PubMed
    1. Zeisberg EM, Tarnavski O, Zeisberg M, et al. Endothelial-to-mesenchymal transition contributes to cardiac fibrosis. Nat Med. 2007;13:952–961. - PubMed

Publication types

MeSH terms

Substances