. 2021 May 3;220(5):e202008030.
doi: 10.1083/jcb.202008030.

FUS-dependent liquid-liquid phase separation is important for DNA repair initiation

Affiliations

FUS-dependent liquid-liquid phase separation is important for DNA repair initiation

Brunno R Levone et al. J Cell Biol. .

Abstract

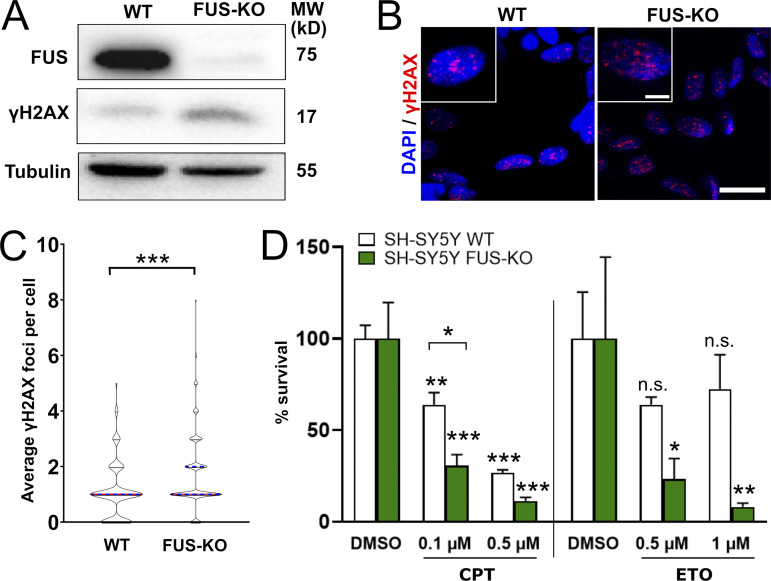
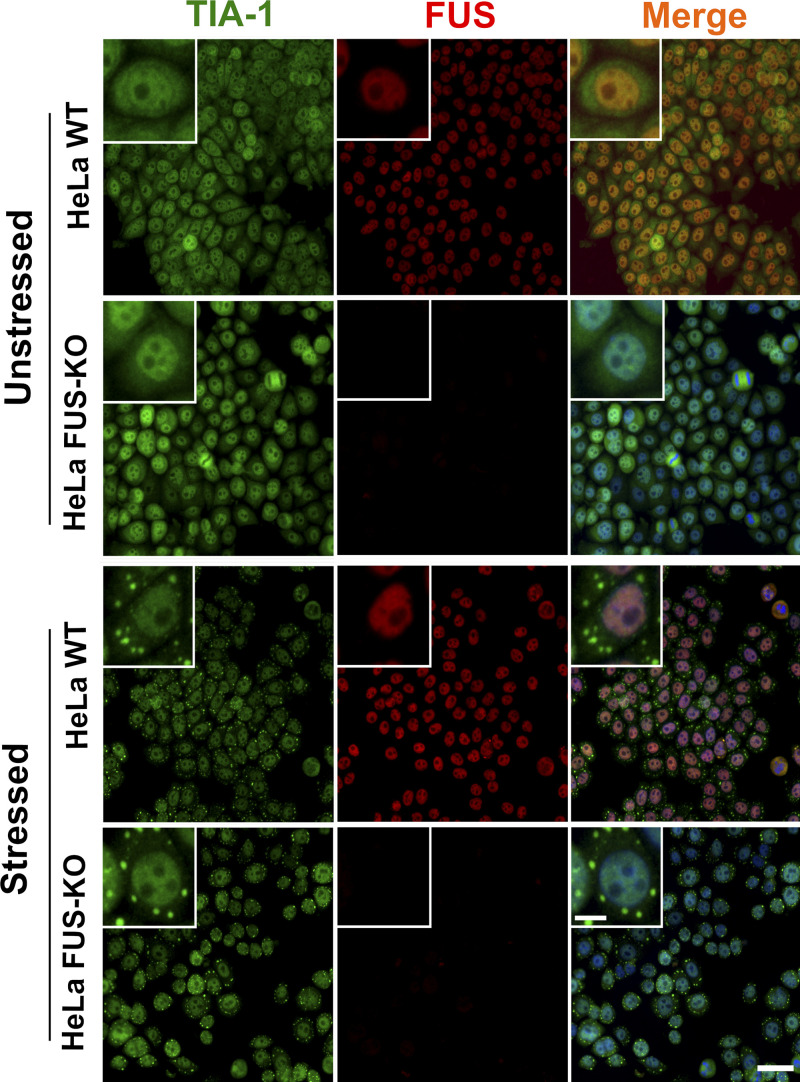
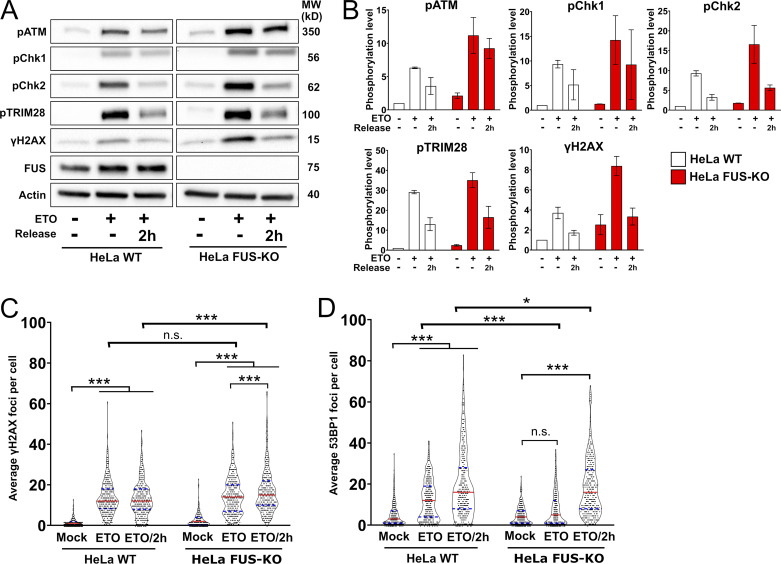
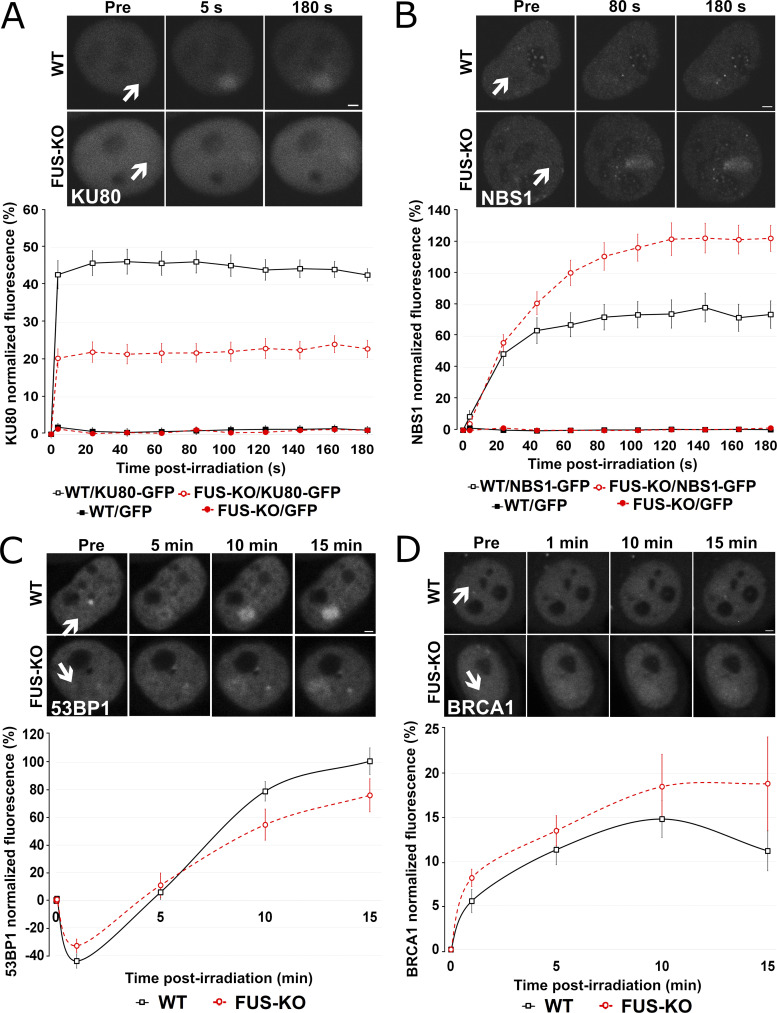
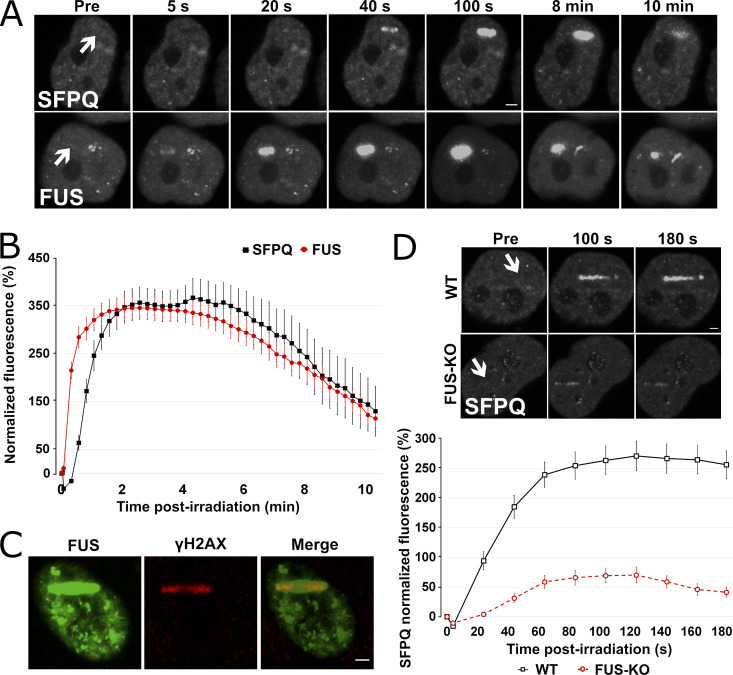
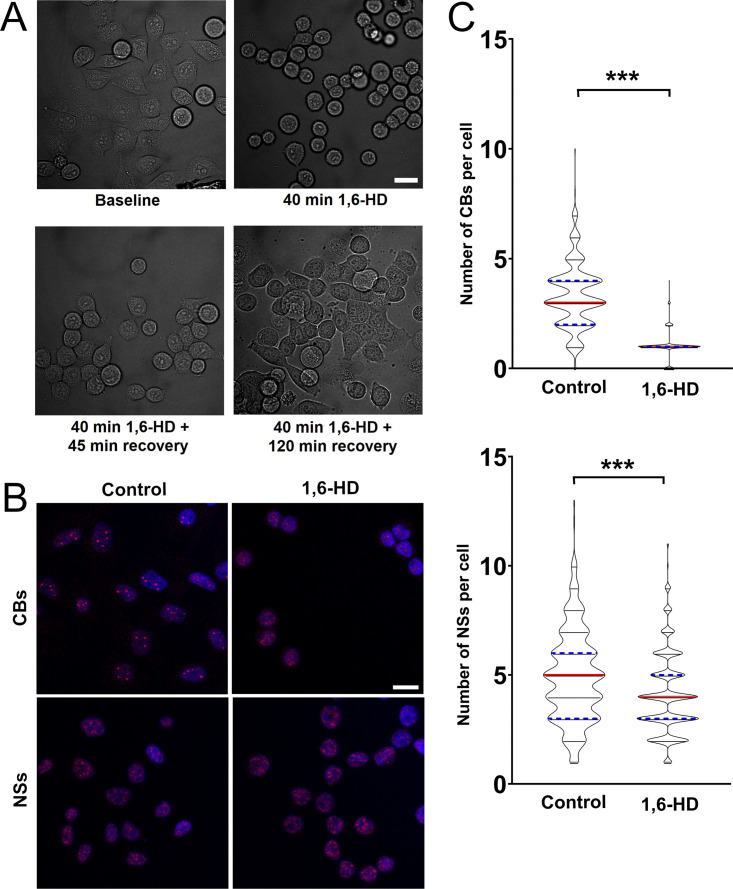
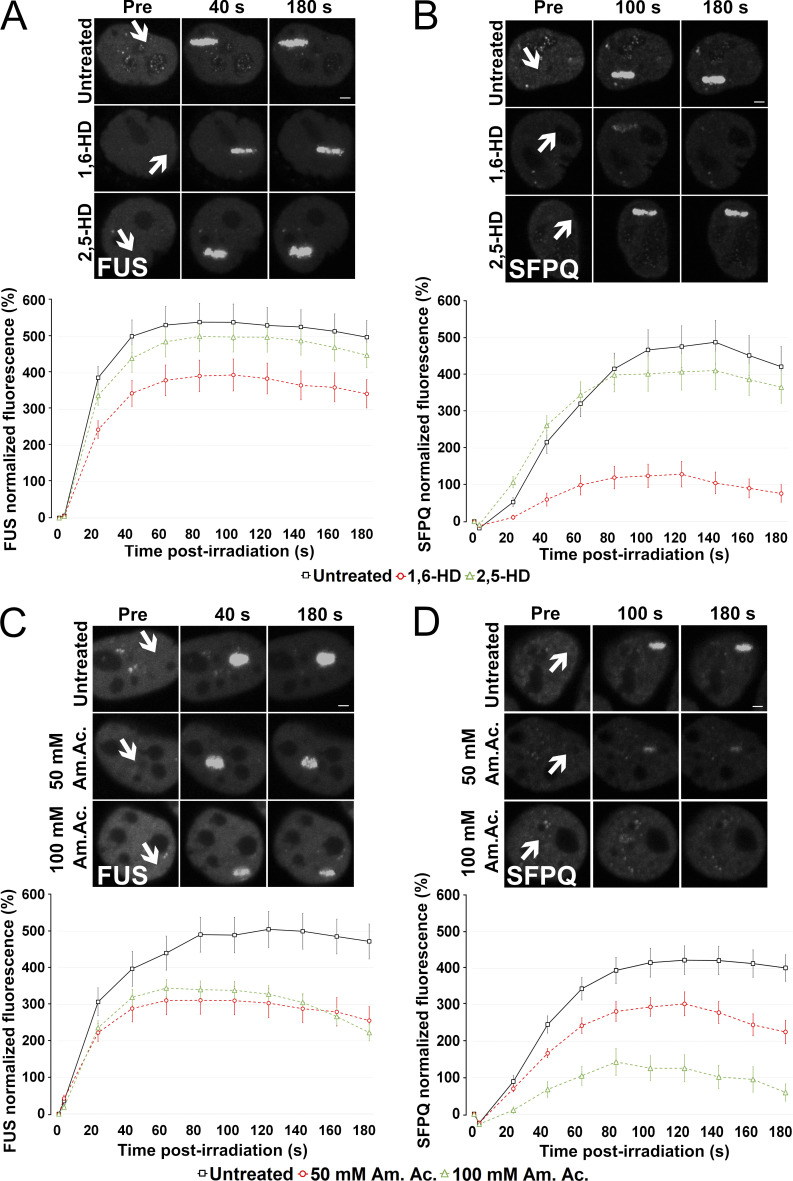
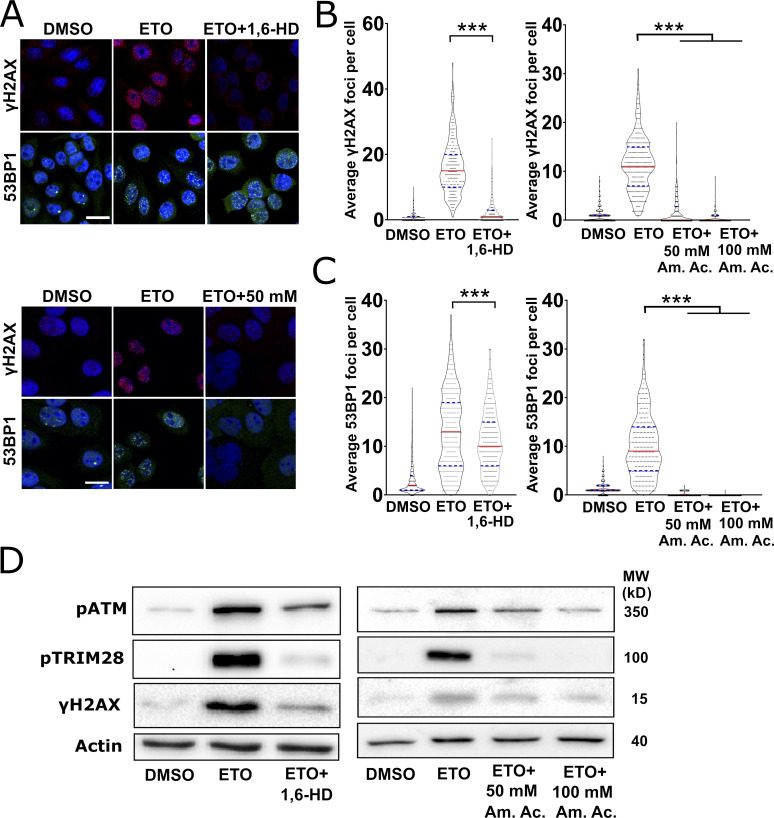
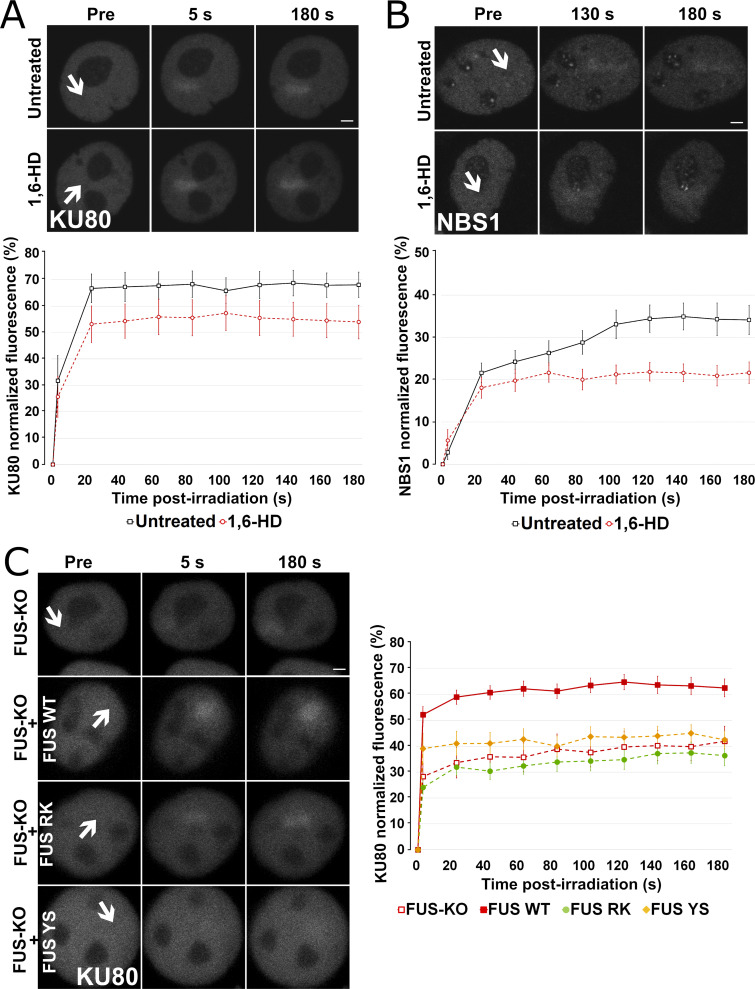
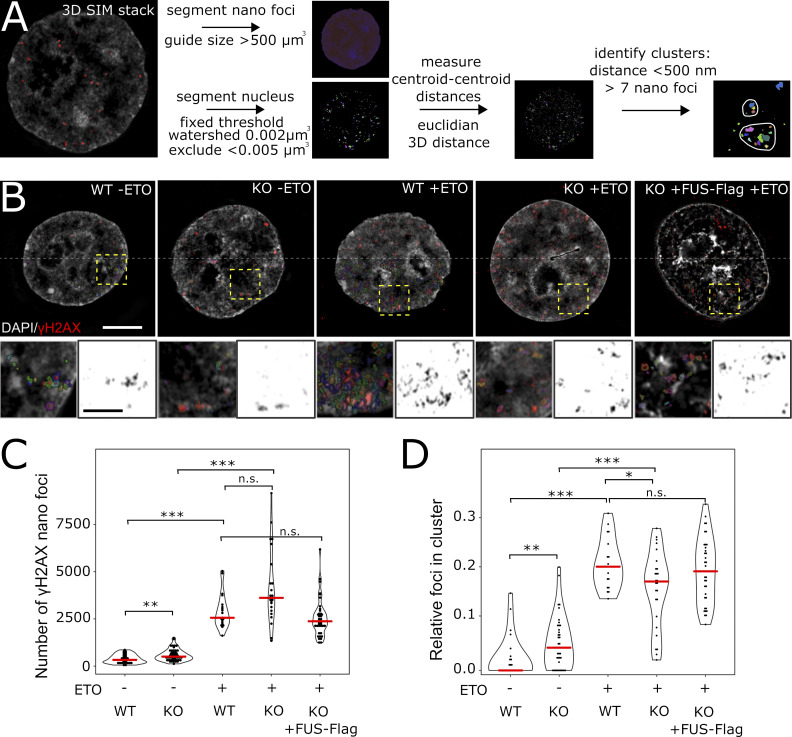
RNA-binding proteins (RBPs) are emerging as important effectors of the cellular DNA damage response (DDR). The RBP FUS is implicated in RNA metabolism and DNA repair, and it undergoes reversible liquid-liquid phase separation (LLPS) in vitro. Here, we demonstrate that FUS-dependent LLPS is necessary for the initiation of the DDR. Using laser microirradiation in FUS-knockout cells, we show that FUS is required for the recruitment to DNA damage sites of the DDR factors KU80, NBS1, and 53BP1 and of SFPQ, another RBP implicated in the DDR. The relocation of KU80, NBS1, and SFPQ is similarly impaired by LLPS inhibitors, or LLPS-deficient FUS variants. We also show that LLPS is necessary for efficient γH2AX foci formation. Finally, using superresolution structured illumination microscopy, we demonstrate that the absence of FUS impairs the proper arrangement of γH2AX nanofoci into higher-order clusters. These findings demonstrate the early requirement for FUS-dependent LLPS in the activation of the DDR and the proper assembly of DSB repair complexes.


Figures

Figure 1.
Figure 1.
Loss of FUS results in accumulation of DNA damage and sensitization to genotoxic insult in HeLa cells. (A) Total extracts of WT and FUS-KO HeLa cells were analyzed by Western blotting with anti-FUS and anti-γH2AX antibodies (loading control: Tubulin). FUS-KO cells display an 8.1-fold increase in the level of endogenous γH2AX in comparison to WT cells. (B) Representative confocal micrographs of γH2AX foci in WT and FUS-KO HeLa cells. Scale bar: 20 µm. Cropped single cells are enlarged 2× (scale bar: 5 µm). (C) Quantification of γH2AX foci. The number of foci per nucleus was counted using ImageJ. WT cells have an average of 1.02 foci per cell, compared with 1.82 in FUS-KO cells. Data are from two biological replicates (170 cells each). Statistics: Student’s t test. (D) HeLa FUS-KO cells were transiently transfected with a plasmid expressing FUS-Flag and stained with anti-Flag and anti-γH2AX. Foci were quantified by ImageJ. Data are from two biological replicates (65 cells each; only transfected cells were included). Statistics: Student’s t test. (E) HeLa WT and FUS-KO cell viability assessed by Trypan blue staining upon treatment with CPT (0.1 or 0.5 µM) or ETO (0.5 or 1 µM). Percentage survival was calculated by normalizing the number of surviving cells by their respective DMSO group. Statistics: two-way ANOVA, Bonferroni post hoc test. In all panels: *, P < 0.05; **, P < 0.01; ***, P < 0.001.
Figure S1.
Figure S1.
Loss of FUS results in accumulation of DNA damage and sensitization to genotoxic insult in SH-SY5Y cells. (A) Total extracts of WT and FUS-KO SH-SY5Y cells were analyzed by Western blotting with anti-FUS and anti-γH2AX antibodies. FUS-KO cells display a 2.6-fold increase in the level of endogenous γH2AX in comparison to WT cells. Tubulin was used as loading control. MW, molecular weight. (B) Representative confocal micrographs of γH2AX foci in WT and FUS-KO SH-SY5Y cells. Scale bar: 20 µm. Cropped single cells are enlarged 2× (scale bar: 5 µm). (C) Quantification of B. The number of foci per nucleus was counted using ImageJ and plotted as a violin plot. Data from two biological replicates, with 170 cells per replicate. The average foci number in WT cells is 1.01, compared with 1.71 in FUS-KO cells. Statistics: Student’s t test (***, P < 0.001). (D) SH.SY5Y WT and FUS-KO cell viability assessed by Trypan blue staining upon treatment with increasing concentrations of CPT (0.1 or 0.5 µM) or ETO (0.5 or 1 µM). Statistics: two-way ANOVA followed by Bonferroni post hoc test (*, P < 0.05; **, P < 0.01; ***, P < 0.001).
Figure S2.
Figure S2.
Loss of FUS does not affect SG assembly. HeLa WT and FUS-KO cells were stressed by treatment with 0.5 mM sodium arsenite for 1 h and immunostained for FUS and TIA-1 (a eukaryotic SG marker). Consistent with previous observations (Sama et al., 2013; Hock et al., 2018), FUS remained nuclear in WT cells upon arsenite incubation, and SGs could be detected in the cytoplasm of both WT and FUS-KO cells. Scale bar: 50 µm (10 µm for cropped image).
Figure 2.
Figure 2.
Loss of FUS perturbs DDR signaling and foci formation upon genotoxic insult. (A) Representative Western blot of DDR proteins in HeLa WT and FUS-KO cells upon ETO treatment. Cells were treated with 10 µM ETO for 1 h and were allowed to recover in ETO-free medium for 2 h (ETO release). Cells were collected at the indicated time points, lysed in the presence of phosphatase inhibitors, separated on a gradient SDS-PAGE, and processed for Western blotting (loading control: Actin). MW, molecular weight. (B) Quantification of the blots from two independent experiments as in A (n = 2). (C) Quantification of ETO-induced γH2AX foci. Data are from two biological replicates (170 cells each). Statistics: two-way ANOVA, Bonferroni post hoc test. (D) Quantification of ETO-induced 53BP1 foci analyzed as in C. *, P < 0.05; ***, P < 0.001.
Figure S3.
Figure S3.
FUS is required for efficient DSB repair and DNA damage foci formation upon genotoxic insult. (A) DDR activation in HeLa WT and FUS-KO cells upon ETO treatment. Cells were treated with 10 µM ETO for 1 h and were allowed to recover in ETO-free medium for 2 h (ETO release). Cells were collected at the indicated time points, lysed in the presence of phosphatase inhibitors, separated on a gradient SDS-PAGE, and processed for Western blotting (loading control: Actin). ATR and BRCA1 were probed on the same blot as the proteins shown in Fig. 2 B. MW, molecular weight. (B) DSB repair efficiency was quantified in U2OS cells containing a stably integrated NHEJ reporter system. Cells were silenced for FUS, KU80, or both. Right: Western blot demonstrating the silencing of the respective proteins. Data are presented as the mean ± SEM (experiments done in triplicate, with at least 10,000 cells analyzed per experiment). Statistics: one-way ANOVA, followed by Bonferroni post hoc test. *, P < 0.05. (C) DSB repair efficiency was quantified in U2OS cells containing a stably integrated HR reporter system. Cells were silenced for FUS, TOPBP1, or both. Right: Western blot demonstrating the silencing of the respective proteins. Statistical analysis as in A. ***, P < 0.001. (D) HeLa WT and FUS-KO cells were stained with γH2AX and counterstained with DAPI. Cells were treated with DMSO, ETO for 1 h, or ETO plus 2-h recovery from ETO treatment (ETO/2h). These are representative figures for graph shown in Fig. 2 C. Scale bar: 20 µm. (E) HeLa WT and FUS-KO cells were stained with 53BP1 and counterstained with DAPI. Cells were treated with DMSO, ETO for 1 h, or ETO plus 2-h recovery from ETO treatment (ETO/2h). These are representative figures for graph shown in Fig. 2 D. Scale bar: 20 µm. (F) 53BP1 expression is affected by neither KO of FUS nor by the ETO exposure. Loading control: Tubulin.
Figure S4.
Figure S4.
Microirradiation experiments are not influenced by differential expression of KU80-GFP or NBS1-GFP in WT versus FUS-KO cell lines. (A) KU80-GFP is recruited to the microirradiated area and colocalizes with γH2AX staining. Scale bar: 2 µm. (B) The raw fluorescence intensity of HeLa WT and FUS-KO cells transiently transfected with KU80-GFP was assessed to rule out the possibility that differential expression levels could affect the observed effect in Fig. 3 A. (C) The raw fluorescence intensity of HeLa WT and FUS-KO cells transiently transfected with NBS1-GFP was assessed to rule out the possibility that differential expression levels could affect the observed effect in Fig. 3 B.
Figure 3.
Figure 3.
Loss of FUS changes the pattern of recruitment of HR- and NHEJ-related proteins to DSBs. (A) HeLa WT and FUS-KO cells were transiently transfected with a KU80-GFP expressing plasmid. Upper panel: Representative micrographs of selected time points. Lower panel: Time course of the normalized fluorescence intensity of KU80-GFP recruitment at the microirradiated sites. All microirradiation experiments were performed in two biological replicates (with 10 cells each, except for BRCA1 recruitment, which was done in four biological replicates with 10 cells each). (B) HeLa WT and FUS-KO cells were transiently transfected with a NBS1-GFP–expressing plasmid. Upper panel: Representative micrographs of selected time points. Lower panel: Time course for NBS1-GFP recruitment. (C) HeLa WT and FUS-KO cells were transiently transfected with a 53BP1-GFP–expressing plasmid. Upper panel: Representative micrographs of selected time points. Lower panel: Time course for 53BP1-GFP recruitment. (D) HeLa WT and FUS-KO cells were transiently transfected with BRCA1-GFP–expressing plasmids. Upper panel: Representative micrographs of selected time points. Lower panel: Time course for BRCA1-GFP recruitment. In all graphs, data are plotted as normalized average ± SEM. Scale bars: 2 µm. Arrows indicate microirradiated area.
Figure 4.
Figure 4.
FUS recruitment to DSBs precedes SFPQ, and its absence strongly reduces SFPQ accumulation. (A) WT HeLa cells were transiently transfected either with SFPQ-GFP or FUS-GFP plasmid and then laser microirradiated. (B) Comparison of FUS and SFPQ recruitment kinetics. (C) HeLa cells were transiently transfected with a GFP-tagged FUS expression plasmid and then laser microirradiated. Cells were then immunostained for γH2AX. H2AX is phosphorylated at laser microirradiation sites and colocalized with FUS-GFP. (D) HeLa WT and FUS-KO cells were transiently transfected with a SFPQ-GFP–expressing plasmid. Upper panel: Representative micrographs of selected time points (see Video 1). Lower panel: Time course for SFPQ-GFP recruitment. In all graphs, data are plotted as normalized average ± SEM. Scale bars: 2 µm. Arrows indicate microirradiated area.
Figure S5.
Figure S5.
Loss of FUS specifically affects SFPQ but not XRCC1 recruitment to DSB. (A) WT HeLa cells were transiently cotransfected with SFPQ-GFP and XRCC1-RFP plasmids and submitted to laser microirradiation as described in Materials and methods. Recruitment of these proteins was assessed for a 3-min period, and images were taken every 20 s. Scale bar: 2 µm. (B) Recruitment and accumulation of SFPQ, as shown in Fig. 4 D, is severely impaired in FUS-KO cells. (C) Recruitment of XRCC1 is very high (saturated fluorescence signal) and the same for WT and FUS-KO cells. Error bars represent SE.
Figure S6.
Figure S6.
2% 1,6-HD treatment does not irreversibly affect the morphology and vitality of cells. (A) Bright-field micrograph of HeLa cells treated with 1,6-HD as described in Materials and methods. Cells were allowed to recover in alcohol-free medium. Cells returned to a normal morphology within 120 min after 1,6-HD withdrawal. Scale bar: 20 µm. (B) Representative images of HeLa WT cells treated or not with 1,6-HD for 30 min and stained for Cajal bodies (CBs, α-coilin antibody) or nuclear speckles (NSs, α-SC-35 antibody). Scale bar: 20 µm. (C) Quantification of Cajal bodies and nuclear speckles in untreated and 1,6-HD–treated cells. HeLa cells were treated with 2% 1,6-HD for 30 min and then stained with DAPI and either anti-coilin or anti-SC35 antibodies. Quantification was performed as in Materials and methods. Experiments were done in duplicate, and 200 cells were analyzed per experiment. Statistics: Student’s t test (***, P < 0.001).
Figure 5.
Figure 5.
LLPS is required for FUS and SFPQ recruitment to DNA damage sites. (A) HeLa WT cells were transiently transfected with a FUS-GFP–expressing plasmid and incubated with either 2% 1,6-HD or 2% 2,5-HD for 30 min before laser microirradiation. Upper panel: Representative micrographs of selected time points. Lower panel: Time course of FUS recruitment. (B) HeLa WT cells were transiently transfected with a SFPQ-GFP–expressing plasmid and treated as in A. Upper panel: Representative micrographs of selected time points. Lower panel: Time course of SFPQ recruitment. (C) HeLa WT cells were transiently transfected with a FUS-GFP–expressing plasmid and incubated with 50 or 100 mM Am. Ac. for 30 min before laser microirradiation. Upper panel: Representative micrographs of selected time points. Lower panel: Time course of FUS recruitment. (D) HeLa WT cells were transiently transfected with a SFPQ-GFP–expressing plasmid and treated as in C. Upper panel: Representative micrographs of selected time points. Lower panel: Time course of SFPQ recruitment. In all graphs, data are plotted as normalized average ± SEM. Scale bars: 2 µm. Arrows indicate microirradiated area.
Figure 6.
Figure 6.
LLPS-deficient FUS variants do not rescue SFPQ recruitment. HeLa FUS-KO cells were transiently cotransfected with one mCherry FUS construct (WT or the mutants RK, YS, or QG) and SFPQ-GFP before laser microirradiation. (A) Representative confocal micrographs of the recruitment of SFPQ and FUS in HeLa FUS-KO cells transiently transfected with both SFPQ and a FUS construct (WT or RK, YS, or QG mutants). (B) Time course of recruitment of WT and mutant FUS-mCherry. (C) Time course of SFPQ-GFP in FUS-KO cells either not transfected with FUS or transfected with FUS WT, FUS RK, FUS YS, or FUS QG. In all graphs, data are plotted as normalized average ± SEM. Scale bars: 2 µm. Arrows indicate microirradiated area.
Figure 7.
Figure 7.
LLPS is required for DDR activation and foci formation. (A) Representative confocal micrographs of HeLa cells that were treated with ETO alone, ETO plus 1,6-HD (upper micrographs), or ETO plus 50 or 100 mM Am. Ac. (lower micrographs) before immunostaining for γH2AX or 53BP1. Scale bars: 20 µm. (B) Quantification of γH2AX 1 foci in the experiments in A. In the HD experiment, 200 cells were analyzed per condition, and in the Am. Ac. experiment, 150 cells per condition, and experiments were performed in duplicate. Graphs represent the number of foci per cell and are shown as violin plots with all samples. Statistics: one-way ANOVA and Bonferroni post hoc test. (C) Quantification of 53BP1 foci in the experiments in A. Experiments, quantifications, and statistics were performed as described in B. (D) Western blot analysis of total extracts prepared from HeLa cells treated with ETO alone, ETO and 2% 1,6-HD, or ETO and Am. Ac. (50 or 100 µM). Phosphorylation of ATM, TRIM28, and H2AX was assessed (loading control: Actin). MW, molecular weight. ***, P < 0.001.
Figure 8.
Figure 8.
LLPS is required for the proper recruitment of HR- and NHEJ-related proteins. (A) HeLa WT cells were transiently transfected with KU80-GFP–expressing plasmids and then incubated with 2% 1,6-HD for 30 min before laser microirradiation. Upper panel: Representative micrographs of selected time points. Lower panel: Time course of KU80 recruitment. (B) HeLa WT cells were transiently transfected with NBS1-GFP–expressing plasmids and then incubated with 2% 1,6-HD for 30 min before laser microirradiation. Upper panel: Representative micrographs of selected time points. Lower panel: Time course of NBS1 recruitment. (C) Recruitment of KU80-GFP in FUS-KO cells either untransfected or transfected with FUS WT, FUS RK, or FUS YS. Upper panel: Representative micrographs of selected time points. Lower panel: Time course of KU80 recruitment. In all graphs, data are plotted as normalized average ± SEM. Scale bars: 2 µm. Arrows indicate microirradiated area.
Figure 9.
Figure 9.
FUS is required for γH2AX nanofoci clustering. (A) Image analysis workflow for 3D-SIM γH2AX cluster analysis. Nuclei and γH2AX nanofoci are segmented; centroid-centroid distances for the nanofoci are computed; and nanofoci with a centroid-centroid distance shorter than 500 nm are assigned to the same cluster. Clusters are quantified as structures that contain more than seven nanofoci. (B) Images of HeLa WT and FUS-KO cells treated for 1 h with ETO or DMSO, respectively. Additionally, HeLa-FUS-KO cells transiently transfected with FUS-Flag plasmid were analyzed after ETO treatment. The main images show the merged DAPI and γH2AX nanofoci in pseudo-color (scale: 5 µm). The lower half of the image shows the outline of the segmented nanofoci. Crop areas are highlighted with yellow boxes, and the magnified regions are shown below (scale bar: 1 µm). (C) Quantification of nanofoci per cell in the different conditions indicated. Red lines indicate the median. Statistics: Wilcoxon’s rank sum test. (D) Frequency of nanofoci found in clusters, as compared with the total number of nanofoci in the cell. Red lines indicate the median. Statistics as in C. *, P < 0.05; **, P < 0.01; ***, P < 0.001.

References

    1. Abbasi, S., and Schild-Poulter C.. 2019. Mapping the Ku Interactome Using Proximity-Dependent Biotin Identification in Human Cells. J. Proteome Res. 18:1064–1077. 10.1021/acs.jproteome.8b00771 - DOI - PubMed
    1. Aguirre, N., Beal M.F., Matson W.R., and Bogdanov M.B.. 2005. Increased oxidative damage to DNA in an animal model of amyotrophic lateral sclerosis. Free Radic. Res. 39:383–388. 10.1080/10715760400027979 - DOI - PubMed
    1. Akhmedov, A.T., and Lopez B.S.. 2000. Human 100-kDa homologous DNA-pairing protein is the splicing factor PSF and promotes DNA strand invasion. Nucleic Acids Res. 28:3022–3030. 10.1093/nar/28.16.3022 - DOI - PMC - PubMed
    1. Aleksandrov, R., Dotchev A., Poser I., Krastev D., Georgiev G., Panova G., Babukov Y., Danovski G., Dyankova T., Hubatsch L., et al. . 2018. Protein Dynamics in Complex DNA Lesions. Mol. Cell. 69:1046–1061.e5. 10.1016/j.molcel.2018.02.016 - DOI - PubMed
    1. Allodi, I., Comley L., Nichterwitz S., Nizzardo M., Simone C., Benitez J.A., Cao M., Corti S., and Hedlund E.. 2016. Differential neuronal vulnerability identifies IGF-2 as a protective factor in ALS. Sci. Rep. 6:25960. 10.1038/srep25960 - DOI - PMC - PubMed

Publication types