. 2022 Jun;78(2):421-434.
doi: 10.1111/biom.13453. Epub 2021 Mar 23.

Nonparametric estimation of Spearman's rank correlation with bivariate survival data

Affiliations

Nonparametric estimation of Spearman's rank correlation with bivariate survival data

Svetlana K Eden et al. Biometrics. 2022 Jun.

Abstract

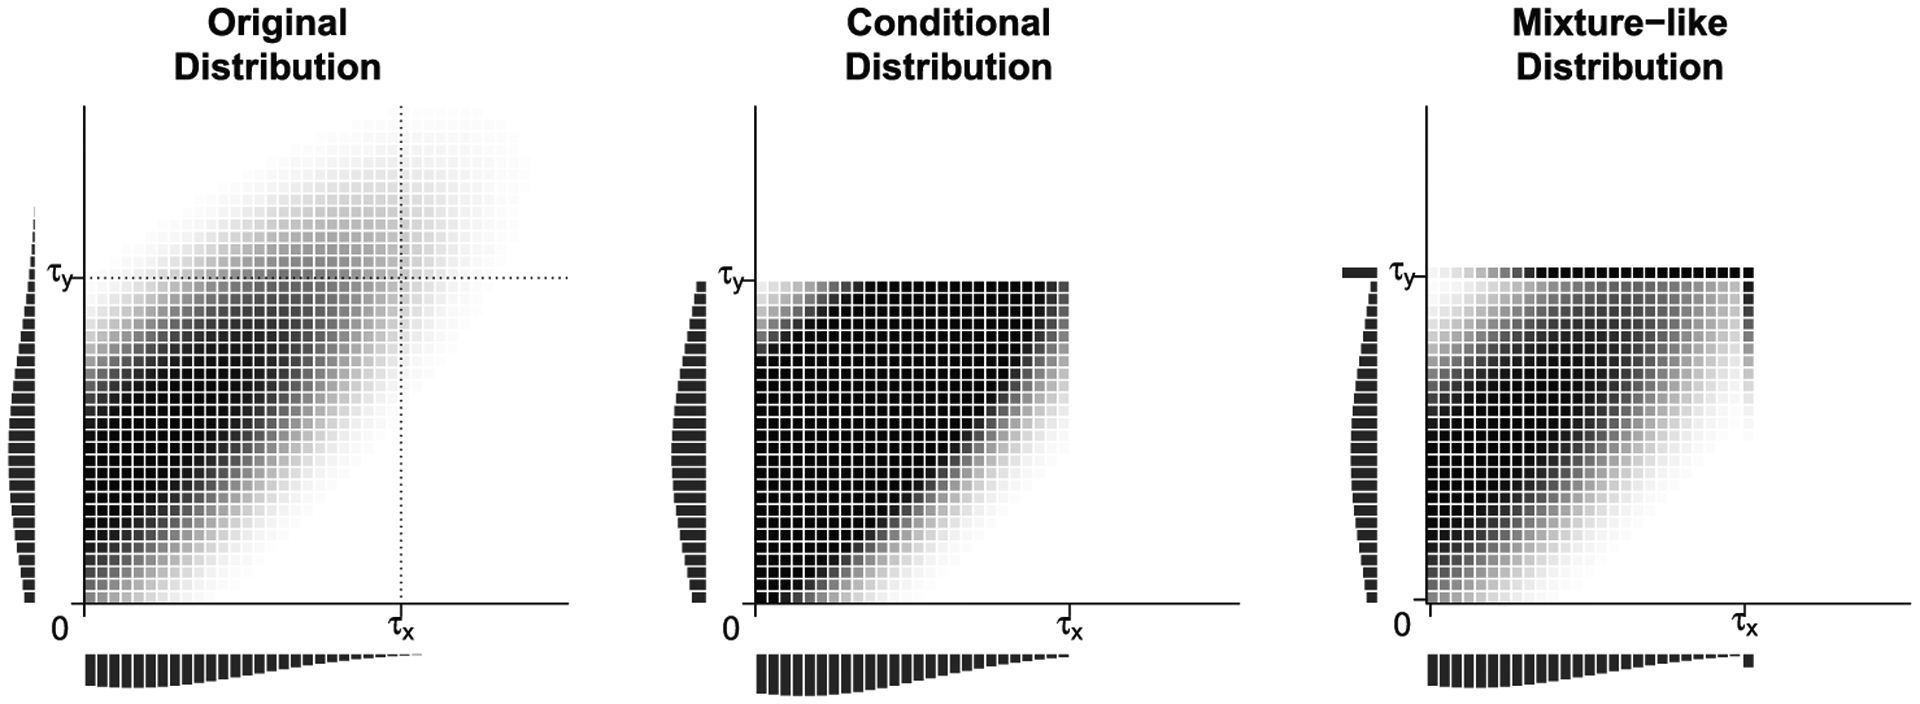
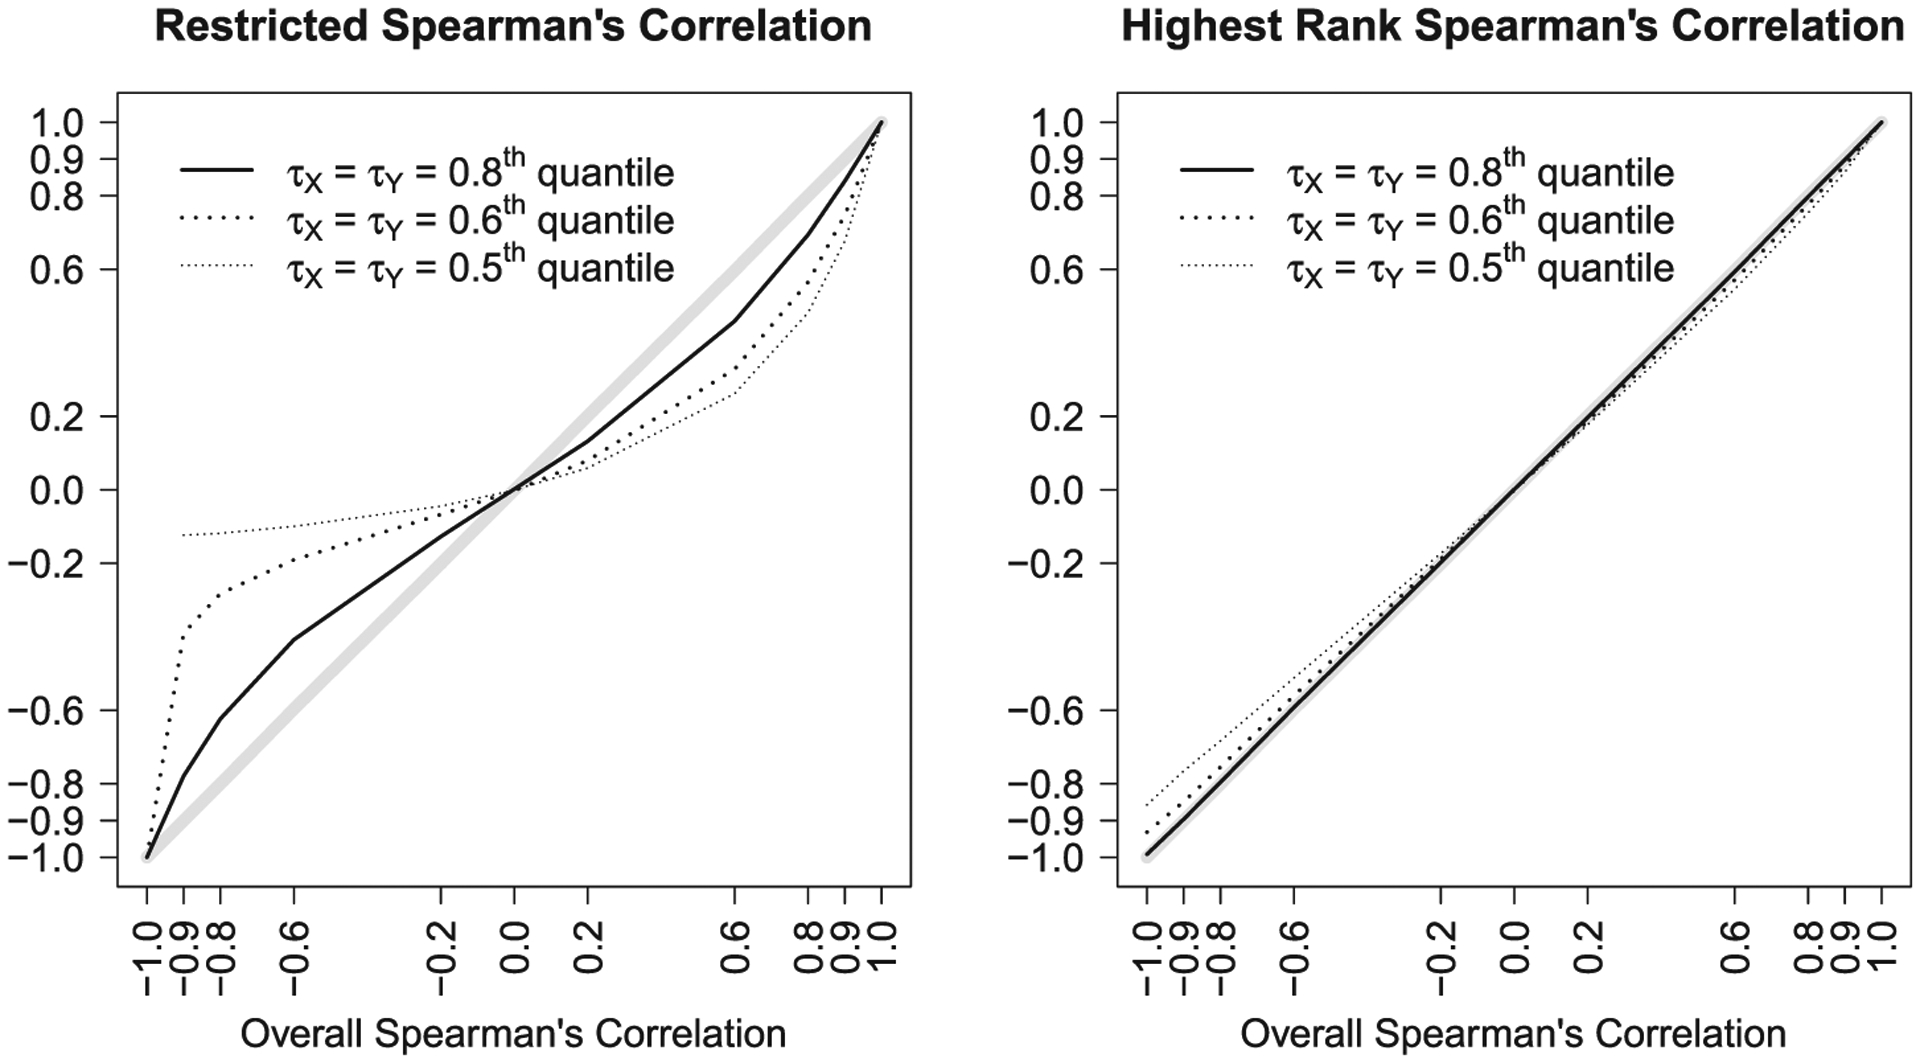
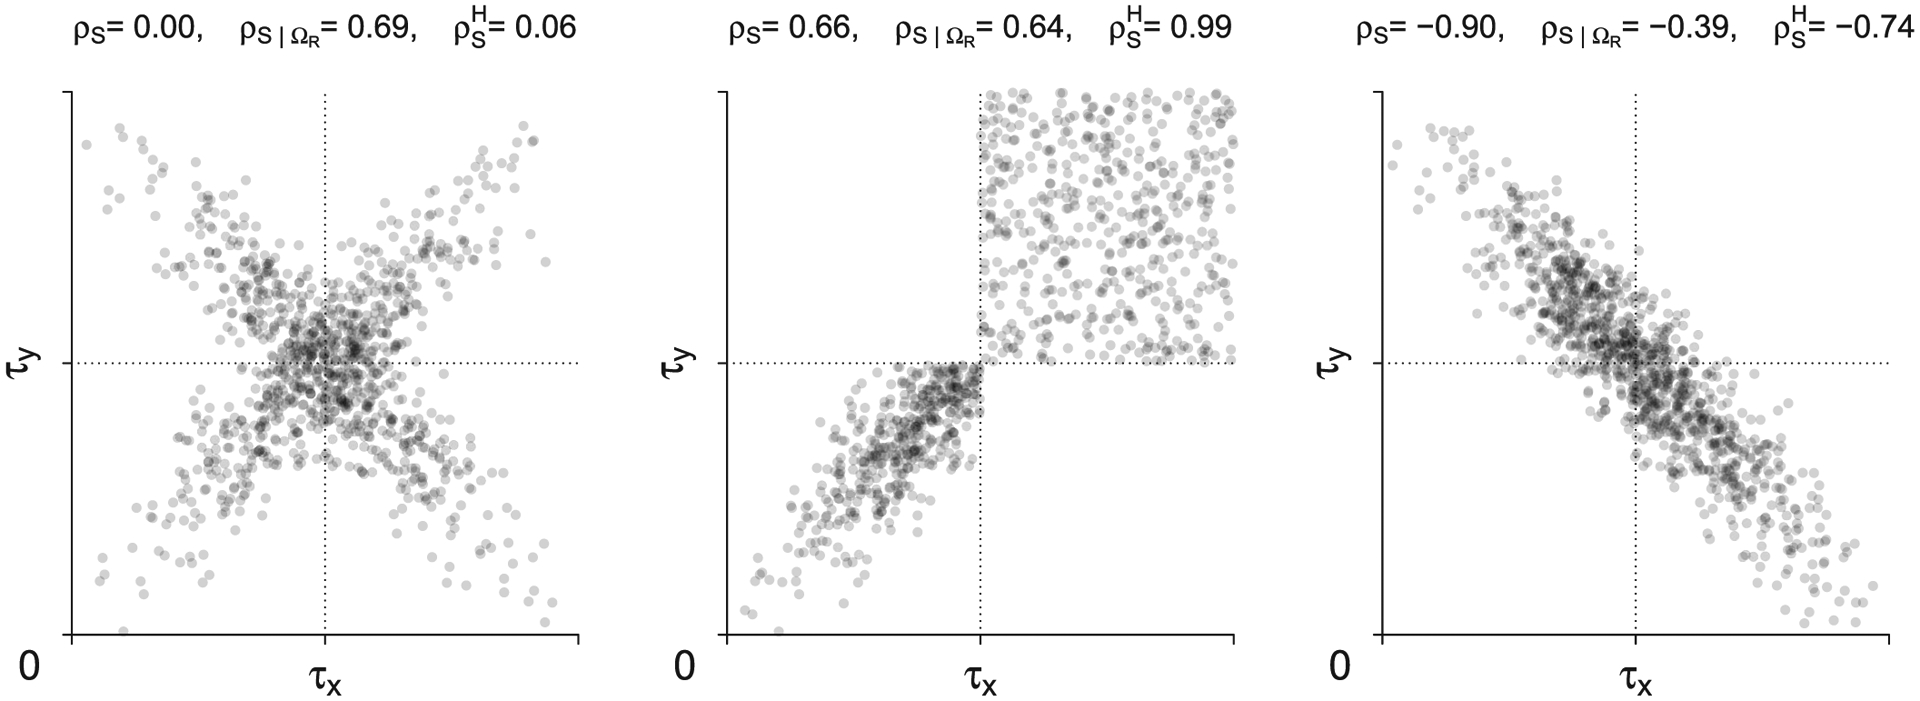
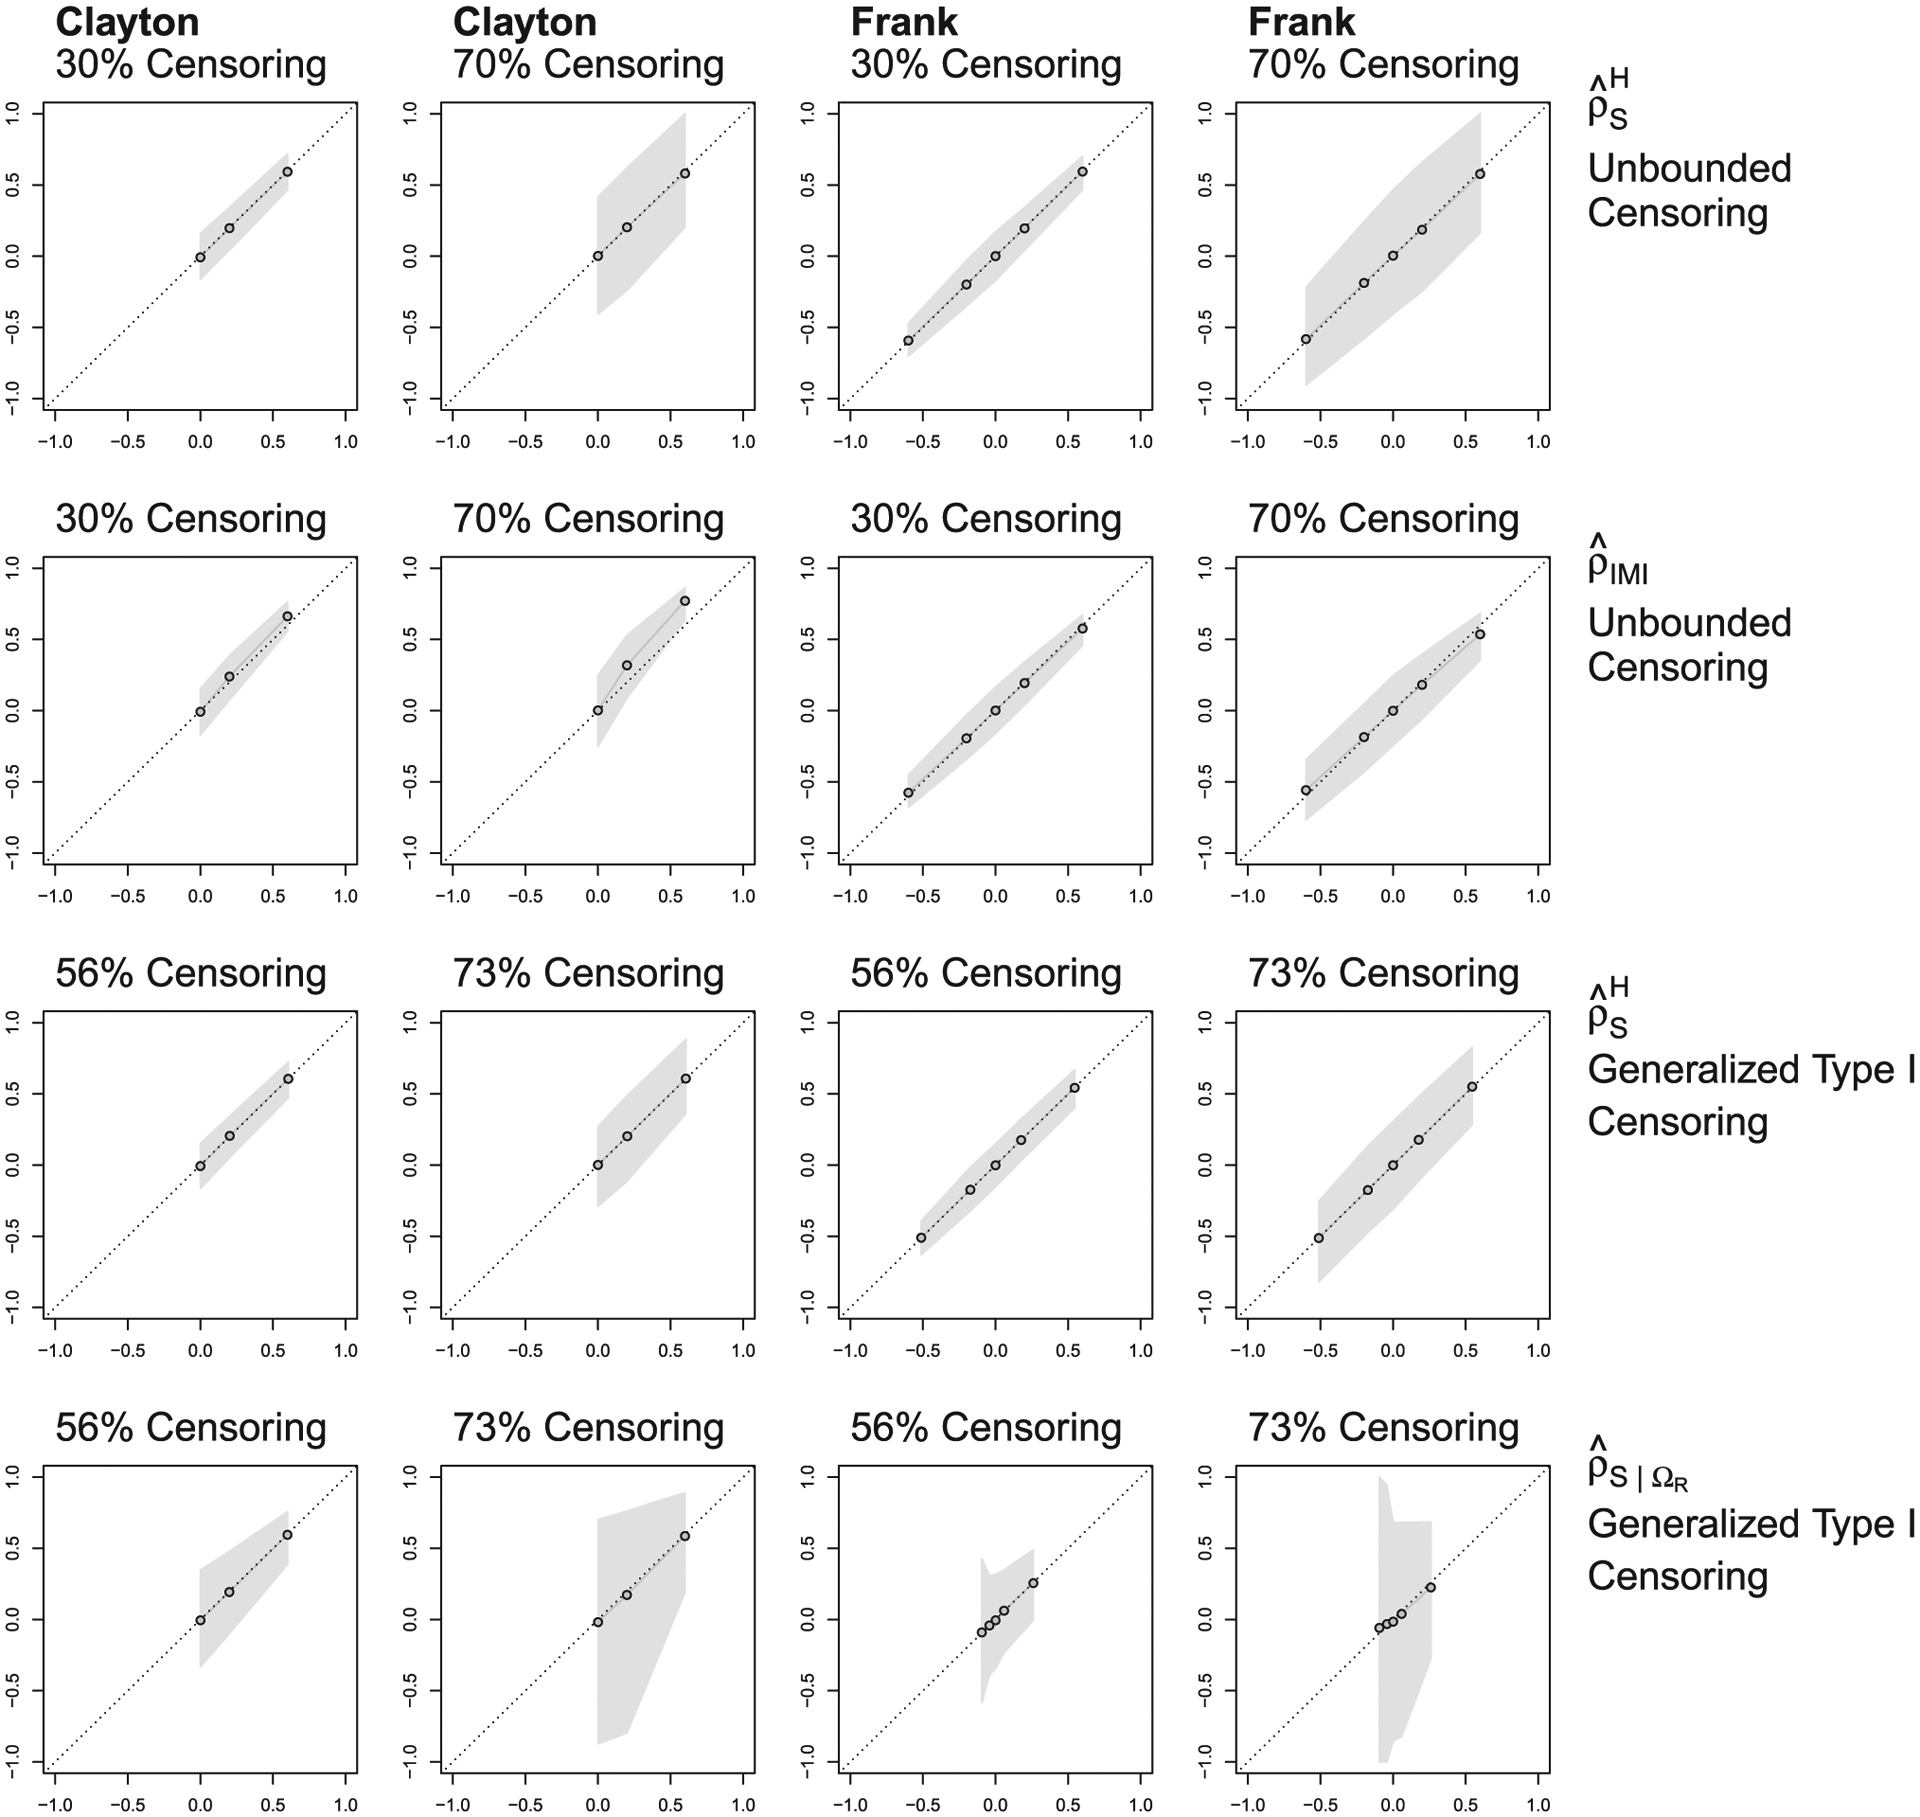
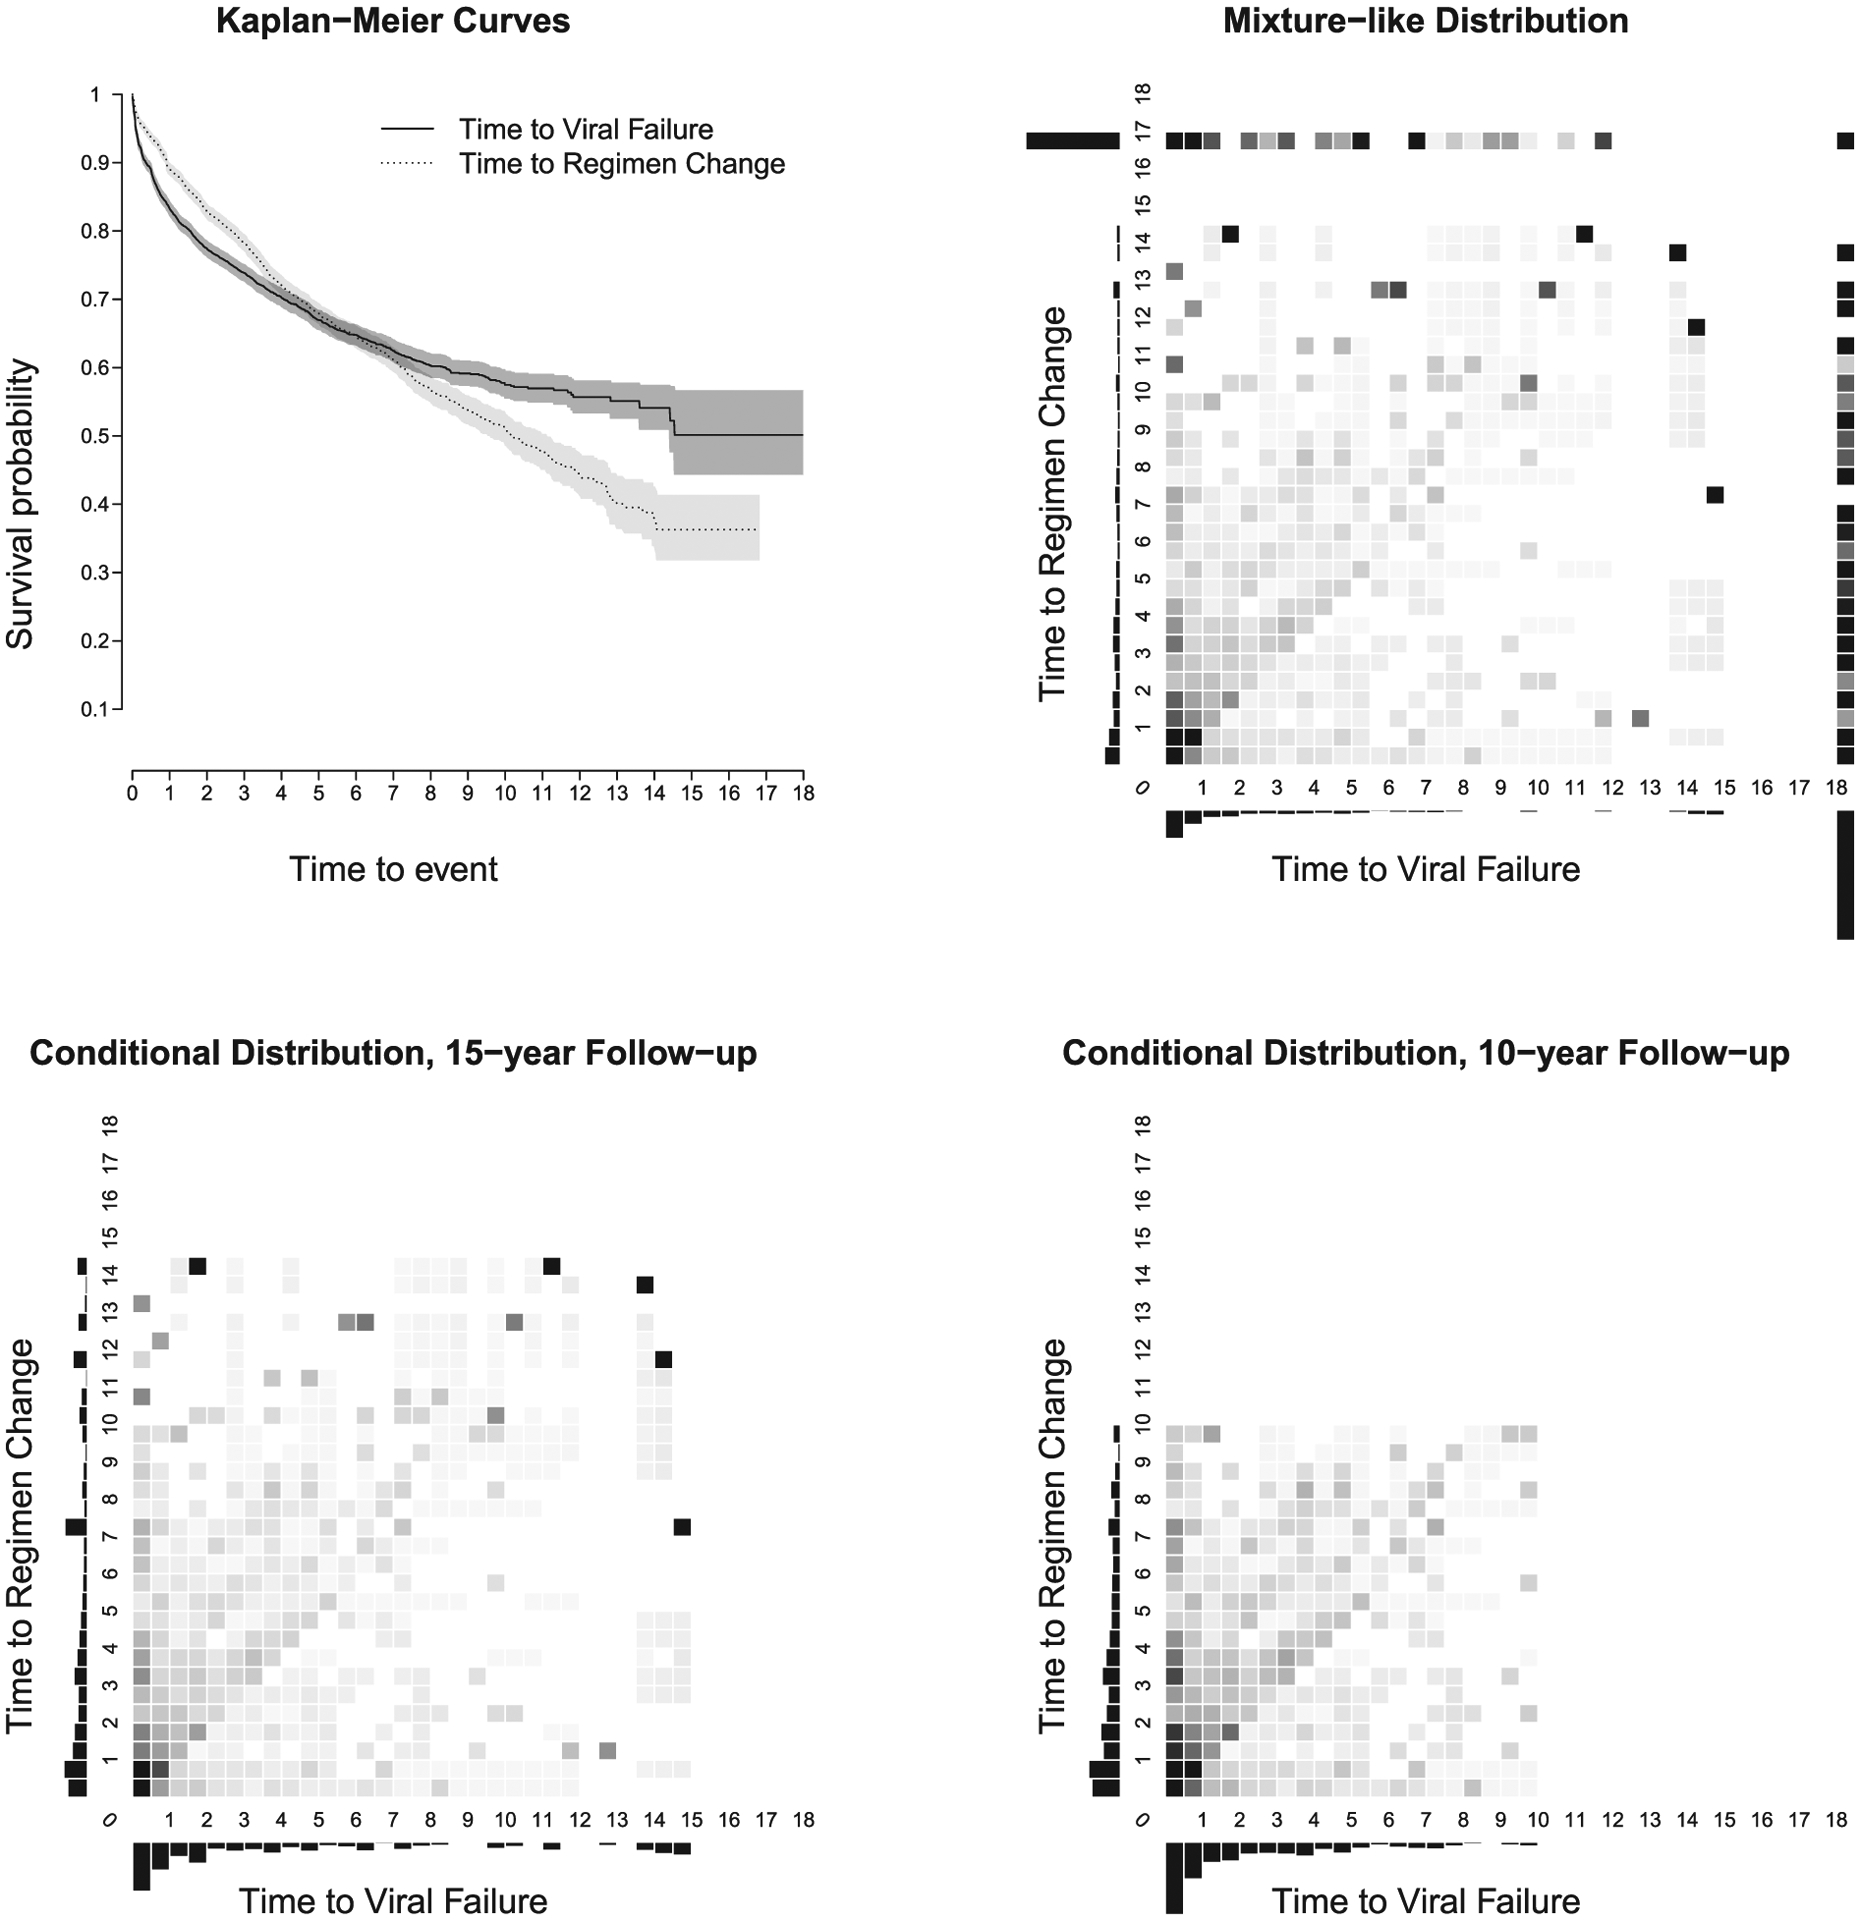
We study rank-based approaches to estimate the correlation between two right-censored variables. With end-of-study censoring, it is often impossible to nonparametrically identify the complete bivariate survival distribution, and therefore it is impossible to nonparametrically compute Spearman's rank correlation. As a solution, we propose two measures that can be nonparametrically estimated. The first measure is Spearman's correlation in a restricted region. The second measure is Spearman's correlation for an altered but estimable joint distribution. We describe population parameters for these measures and illustrate how they are similar to and different from the overall Spearman's correlation. We propose consistent estimators of these measures and study their performance through simulations. We illustrate our methods with a study assessing the correlation between the time to viral failure and the time to regimen change among persons living with HIV in Latin America who start antiretroviral therapy.

Keywords: HIV; Spearman's correlation; bivariate survival; nonparametric; viral failure.


Figures

FIGURE 1
FIGURE 1
Illustration of bivariate distributions underlying the three population parameters. Left: Original distribution over [0, ∞) × [0, ∞), which has Spearman’s correlation ρS. Middle: Conditional distribution over ΩR = Ω, which has Spearman’s correlation ρSΩR. Right: Mixture-like distribution SH over region Ω ∪ [0, τX] × τYτX × [0, τY], which has Spearman’s correlation ρSH
FIGURE 2
FIGURE 2
Restricted Spearman’s correlation, ρSΩR (left panel), and highest rank Spearman’s correlation, ρSH (right panel), for Frank’s copula family for different restricted regions defined by τX and τY (τX = τY): 0.5th (50% censored), 0.6th (40% censored), 0.8th (20% censored) quantiles. A diagonal gray line is added for reference. Although the plots are generated based on data under strict type I censoring, the population parameters are the same for generalized type I censoring and are invariant to the rate of censoring within the restricted region
FIGURE 3
FIGURE 3
Example of bivariate distributions and their population parameters ρS with no censoring, and ρSH and ρSΩR with strict type I censoring with ΩR = [0, τX) × [0, τY). The proportions of observed double events in the left, middle, and right panels are 25%, 43%, and 7%, respectively. Drawn are 1000 points randomly selected from the underlying distributions. Although the plots are based on strict type I censoring, the population parameters are the same for generalized type I censoring and are invariant to the rate of censoring within ΩR
FIGURE 4
FIGURE 4
Point estimates (X-axis) vs population parameters (Y-axis) under different bivariate censoring scenarios. The top and second rows are ρ^SH and ρ^IMI as estimators of the overall Spearman’s correlation, ρS. The third row is ρ^SH as an estimator of ρSH. The bottom row is ρ^SΩR as an estimator of ρSΩR. The columns represent Clayton’s and Frank’s copulas. The population parameters for Clayton’s family are 0, 0.2, and 0.6 for all estimates. For Frank’s family, the population parameters of ρS are −0.6, −0.2, 0.2, and 0.6; the population parameters of ρSH are −0.512, −0.173, 0.180, and 0.545; the population parameters of ρSΩR are −0.098, −0.042, 0.058, and 0.261. The dots are the mean point estimates based on 1000 simulations. The shaded areas represent the 0.025th and 0.975th quantiles. For generalized type I censoring, the restricted region, ΩR, was defined by the median survival times
FIGURE 5
FIGURE 5
Upper left: Kaplan–Meier curves for time to viral failure and time to regimen change, where time is measured in years. Upper right: bivariate probability mass function for the mixture-like distribution, S^H(dx,dy). Lower left: conditional bivariate probability mass function for 15-year follow-up. Lower right: conditional bivariate probability mass function for 10-year follow-up. For probability mass functions, the bars on the left and on the bottom represent histograms of the univariate survival mass for each event. The probability mass function was computed from the Dabrowska’s survival surface and then aggregated over half-year bivariate time periods. After aggregation, any negative values were set to 0. Lighter shade represents smaller values

References

    1. Campbell G (1981) Nonparametric bivariate estimation with randomly censored data. Biometrika, 68, 417–422.
    1. Carriere JF (2000) Bivariate survival models for coupled lives. Scandinavian Actuarial Journal, 2000, 17–32.
    1. CCASAnet (2020). Times to viral failure and regimen change data. Anonymized for presentation, https://biostat.app.vumc.org/ArchivedAnalyses accessed March 17, 2021.
    1. Cesar C, Jenkins CA, Shepherd BE, Padgett D, Mejía F, Ribeiro SR, et al. (2015) Incidence of virological failure and major regimen change of initial combination antiretroviral therapy in the Latin America and the Caribbean: an observational cohort study. The Lancet HIV, 2, e492–e500. - PMC - PubMed
    1. Clayton DG (1978) A model for association in bivariate life tables and its application in epidemiological studies of familial tendency in chronic disease incidence. Biometrika, 65, 141–151.

Publication types