Review
. 2021 Sep 6;60(37):20120-20143.
doi: 10.1002/anie.202100274. Epub 2021 Apr 7.

Chemically Fueled Self-Assembly in Biology and Chemistry

Affiliations
Review

Chemically Fueled Self-Assembly in Biology and Chemistry

Krishnendu Das et al. Angew Chem Int Ed Engl. .

Abstract

Life is a non-equilibrium state of matter maintained at the expense of energy. Nature uses predominantly chemical energy stored in thermodynamically activated, but kinetically stable, molecules. These high-energy molecules are exploited for the synthesis of other biomolecules, for the activation of biological machinery such as pumps and motors, and for the maintenance of structural order. Knowledge of how chemical energy is transferred to biochemical processes is essential for the development of artificial systems with life-like processes. Here, we discuss how chemical energy can be used to control the structural organization of organic molecules. Four different strategies have been identified according to a distinguishable physical-organic basis. For each class, one example from biology and one from chemistry are discussed in detail to illustrate the practical implementation of each concept and the distinct opportunities they offer. Specific attention is paid to the discussion of chemically fueled non-equilibrium self-assembly. We discuss the meaning of non-equilibrium self-assembly, its kinetic origin, and strategies to develop synthetic non-equilibrium systems.

Keywords: chemical fuel; non-equilibrium systems; origin of life; self-assembly; systems chemistry.


Conflict of interest statement

The authors declare no conflict of interest.

Figures

Figure 1
Figure 1
The equilibrium between M and M2 that is used as a reference throughout the Review. The composition at equilibrium is defined by the equilibrium constant K 4 (m −1). The notation for the equilibrium constant (K 4) is used to facilitate the comparison of the discussion in this Review with a previous publication.
Figure 2
Figure 2
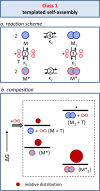
Class 1: Templated self‐assembly. a) The reaction scheme describes the chemical connectivity between the components of the system. b) Energy diagram in which the dark red circles indicate the composition of the system in the presence of template T.
Figure 3
Figure 3
Schematic representation of the templated self‐assembly of a virion following a nucleation‐growth model. Figure inspired by Ref. .
Figure 4
Figure 4
a) Schematic representation of the formation of a dynamic combinatorial library from a mixture of building blocks and the spontaneous adaptation to the addition of a template. b) Mixing building blocks 13 results in the formation of a dynamic library of macrocycles containing at least 45 distinct structures. The addition of templates causes selective amplification of library members.
Figure 5
Figure 5
Class 2: Templated self‐assembly under dissipative conditions. a) The reaction scheme describes the chemical connectivity between the components of the system and the energy dissipation process. b) Energy diagram illustrating the composition of the system under stationary conditions, that is, at constant fuel and waste concentrations in an open system. The green arrows indicate the energy dissipation steps. The size of the dark red circles indicates the relative populations of the respective states reported in previous simulations.
Figure 6
Figure 6
Schematic representation of a synaptic cleft at a neuromascular junction. Acetylcholine is released from vesicles in the axon terminus and causes opening of ligand‐gated ion channels in the muscle cell. At the same time, acetylcholine is rapidly cleared from the synaptic cleft by the enzyme acetylcholinesterase.
Figure 7
Figure 7
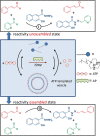
ATP‐templated self‐assembly of vesicles under dissipative conditions generated by the presence of the enzyme alkaline phosphatase. The assembly state affects the chemical reactivity in the system: reaction I dominates in the unassembled state, whereas reaction II dominates in the assembled state. Transient inversion of reaction selectivity is observed upon the addition of ATP.
Figure 8
Figure 8
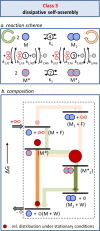
Class 3: Dissipative self‐assembly. a) Class 3 is characterized by the presence of two chemical connectivities between the non‐activated and activated building blocks involving either fuel or waste. b) Energy diagram illustrating the composition of the system under stationary conditions, that is, at constant fuel and waste concentrations in an open system. The orange and green trajectories represent the clockwise (orange) and counterclockwise (green) directions of the cycle depicted in Figure 8 a. The dark colored arrows correspond to the processes during which waste molecules are generated. The size of the dark red circles indicates the relative populations of the respective states reported in previous simulations.
Figure 9
Figure 9
Schematic representation of the enzyme‐regulated activation and deactivation of myosin II. Figure inspired by Ref. .
Figure 10
Figure 10
Transient self‐assembly of a hydrogel caused by the enzyme‐mediated activation and deactivation of C‐terminal‐amidated l‐tyrosine (Y‐NH2).
Figure 11
Figure 11
Class 4: Driven self‐assembly. a) Kinetic asymmetry arises from the presence of different energy barriers for the fuel and waste reactions with respect to the unassembled (M) and assembled (M2) states. b) Energy diagram illustrating how kinetic asymmetry creates the conditions required for the permanent population of the high‐energy assembly M2 under stationary conditions. The green trajectory represents the counterclockwise (green) direction of the cycle depicted in Figure 11 a. The dark green arrow corresponds to the process during which waste molecules are generated. The size of the dark red circles indicate the relative population of the respective state reported in previous simulations.
Figure 12
Figure 12
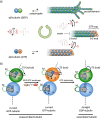
a) GTP‐fueled self‐assembly of microtubules. b) Structural changes in the αβ‐tubulin dimer as a function of the occupancy of the E‐site with GDP or GTP. Conversion of GTP into GDP in assembled tubulin leads to strain in the microtubule lattice. Figure inspired by Ref. .
Figure 13
Figure 13
Chemically fueled driven self‐assembly of fibers that show features reminiscent of the catastrophic collapse of microtubules.
Figure 14
Figure 14
Chemically fueled unidirectional motion. a) Model used to illustrate how kinetic asymmetry leads to unidirectional motion. b) Energy diagram to explain how energy dissipation leads to motion in the forward direction. The green trajectory represents the preferential energy dissipation pathway leading to motion in the forward direction. The dark green arrow represents the step in which waste molecules are generated.
Figure 15
Figure 15
Schematic representation of kinesin 1. b) Structural changes in the motor domain as a function of binding site occupancy by ADP and ATP. c) ATP‐fueled directional motion of kinesin towards the (+)‐end of a microtubule. Figures (b) and (c) are inspired by Ref. .
Figure 16
Figure 16
a) Chemical structure of a [2]catenane used for Fmoc‐Cl‐fueled directional rotation of the small ring (blue) around the large ring. b) Illustration of how a single removal–attachment cycle leads to net rotation of the blue ring in a clockwise direction.
Figure 17
Figure 17
Exploitation of cooperativity and multivalency for the installation of kinetic asymmetry.

References

    1. Schrödinger E., What Is Life? The Physical Aspect of the Living Cell, Cambridge Univ Press, Cambridge, 1944.
    1. Onsager L., Phys. Rev. 1931, 37, 405–426.
    1. Nicolis G., Prigogine I., Self-Organization in Nonequilibrium Systems: From Dissipative Structures to Order through Fluctuations, Wiley, New York, 1977.
    1. Adamski P., Eleveld M., Sood A., Kun Á., Szilágyi A., Czárán T., Szathmáry E., Otto S., Nat. Rev. Chem. 2020, 4, 386–403. - PubMed
    1. Pascal R., Pross A., Sutherland J. D., Open Biol. 2013, 3, 130156. - PMC - PubMed

Publication types

LinkOut - more resources