Clinical Trial
. 2021 Aug;99(8):832-843.
doi: 10.1002/cyto.a.24334. Epub 2021 Mar 18.

A human receptor occupancy assay to measure anti-PD-1 binding in patients with prior anti-PD-1

Affiliations
Clinical Trial

A human receptor occupancy assay to measure anti-PD-1 binding in patients with prior anti-PD-1

Fabian Junker et al. Cytometry A. 2021 Aug.

Abstract

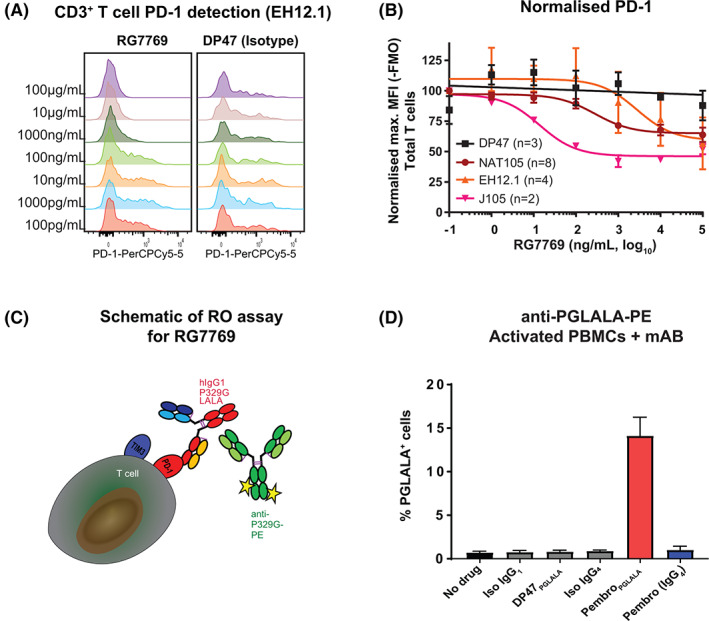
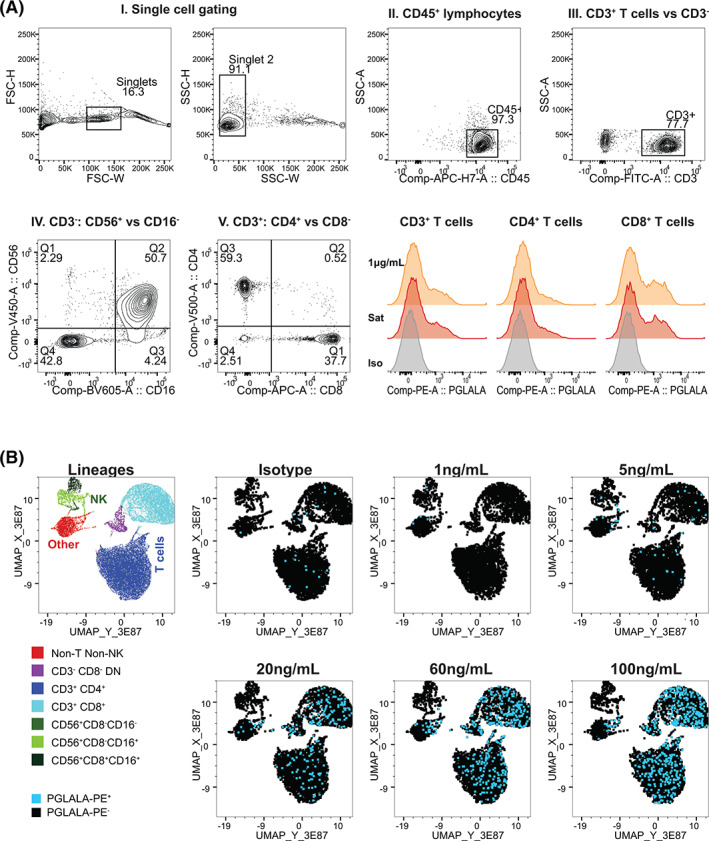
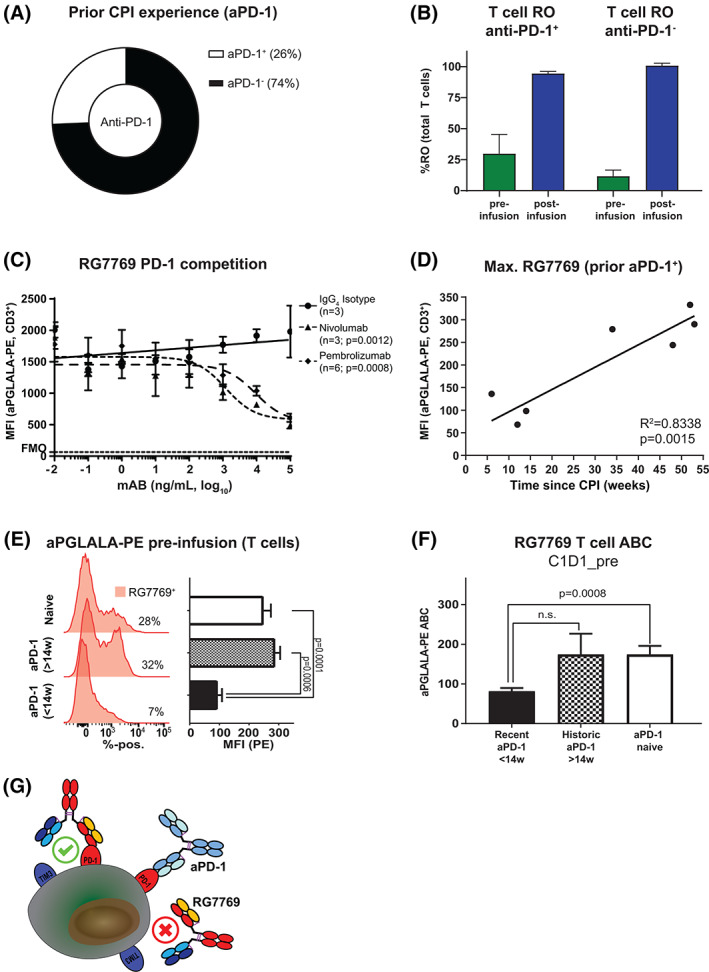
Receptor occupancy (RO) assessment by flow cytometry is an important pharmacodynamic (PD) biomarker in the clinical development of large molecules such as monoclonal therapeutic antibodies (mAbs). The total-drug-bound RO assay format directly assesses mAb binding to cell surface targets using anti-drug detection antibodies. Here, we generated a flow cytometry detection antibody specifically binding to mAbs of the IgG1 P329GLALA backbone. Using this reagent, we developed a total-drug-bound RO assay format for RG7769, a bi-specific P329GLALA containing mAb targeting PD-1 and TIM3 on T cells. In its fit-for-purpose validated version, this RO assay has been used in the Phase-I dose escalation study of RG7769, informing on peripheral T cell RO and RG7769 antibody binding capacity (ABC). We assessed RG7769 RO in checkpoint-inhibitor (CPI) naïve patients and anti-PD-1 CPI experienced patients using our novel assay. Here, we show that in both groups, complete T cell RO can be achieved (~100%). However, we found that the maximum number of T cell binding sites for RG7769 pre-dosing was roughly twofold lower in patients recently having undergone anti-PD-1 treatment. We show that this is due to steric hindrance exerted by competing mAbs masking the available drug binding sites. Our findings highlight the importance of quantitative mAb assessment in addition to relative RO especially in the context of patients who have previously received anti-PD-1 treatment.

Keywords: PD biomarkers; PD-1; assay validation; checkpoint inhibitors; fit-for-purpose; flow cytometry; receptor occupancy; steric hindrance.


Conflict of interest statement

All authors are current or former employees of F. Hoffmann‐La Roche Ltd and may own company stock. CK in addition discloses ownership of F. Hoffmann‐La Roche Ltd patents and stock.

Figures

FIGURE 1
FIGURE 1
Development of total‐drug‐bound receptor occupancy (RO) assay to detect RG7769 on peripheral blood derived immune cells. (A) CD3‐CD28 activated peripheral blood mononuclear cells (PBMCs) were incubated with increasing concentrations of RG7769 (100 pg/ml➔100 μg/ml). PD‐1 expression on CD3+ T cells was analyzed using anti‐PD‐1, clone EH12.1, by flow cytometry in a representative donor. (B) Pooled normalized relative CD3+ T cell PD‐1 expression from two independent experiments assessing anti‐PD‐1 clones EH12.1, NAT105 and J105. (C) Schematic depicting RG7769 engaging T cells via high‐affinity anti‐PD‐1 and low‐affinity anti‐TIM3 binding on target cells. RG7769 Fc harbors the P329 IgG1 mutation (“PGLALA”) which can be specifically detected via anti‐PGLALA‐PE (M‐1.7.24). (D) PBMCs from n = 3 different donors incubated with pembrolizumab (IgG4 or PGLALA), rituximab (IgG1) or respective isotype controls (Iso IgG1, Iso IgG4, DP47‐PGLALA), and detected via anti‐PGLALA‐PE. Pembrolizumab staining is shown for CD3+ T cells [Color figure can be viewed at wileyonlinelibrary.com]
FIGURE 2
FIGURE 2
Validation of RG7769 receptor occupancy (RO) assay for whole‐blood T cell RO analysis. (A) Gating strategy for RO calculation. I. In all conditions, single lymphocytes were identified by excluding cell doublets via FSC‐H versus FSC‐W followed by SSC‐H versus SSC‐W. II. Total lymphocytes were gated on via CD45 staining versus SSC‐A. III. Within the CD45+ compartment, T cells were identified via CD3 expression. A non‐T cell gate (NOT‐CD3+) was set. IV. Within total CD3+ T cells, CD4+ (Q3) and CD8+ single‐positive (Q1) T cells were identified. V. In the non‐T cell population, NK cells were identified via CD56 versus CD16 (QI‐III). Total NK cells were defined as CD56+CD16+/−. Lower right: Comparing the anti‐PGLALA‐PE staining intensity of CD3+ T cells, CD4+ and CD8+ T cells pulsed with RG7769. Orange: 1 μg/ml, red: Saturation (100 μg/ml); gray: Negative control (1000 ng/ml + mIgG2b‐isotype‐PE). (B) Dose–response of RG7769 binding to healthy donor lymphocytes. Using the gating strategy in A, CD45+ lymphocyte single cells from blood pulsed ex vivo with RG7769 (0 ng/ml➔100 ng/ml), were identified. The control group (0 ng/ml) was stained with mIgG2b‐PE isotype, cells with RG7769 with anti‐PGLALA‐PE. Five thousand concatenated CD45+ events were clustered according to CD3, CD4, CD8, CD56 and CD16 by UMAP. Left: Cell lineages identified using FlowSOM include CD4+ T cells, CD8+ T cells, CD4CD8 unconventional T cells as well as NK cell subsets. Right: PE+ (RG7769+) T cells (blue) [Color figure can be viewed at wileyonlinelibrary.com]
FIGURE 3
FIGURE 3
Assessing RG7769 binding to T cells in anti‐PD‐1 experienced patients. (A) Comparison of the frequency of NP40435 patients with prior aPD‐1 experience with aPD‐1 naïve patients. (B) Comparison of RG7769 CD3+ T cell receptor occupancy (RO) pre‐ and post‐infusion in NP40435 patients. (C) Control in vitro experiment assessing the effect of PD‐1 competition on RG7769 binding to CD3+ T cells. Activated peripheral blood mononuclear cells (PBMCs) were incubated with IgG4 isotype, nivolumab or pembrolizumab (100 pg/ml➔100 μg/ml), then pulsed with RG7769 (10 μg/ml), and analyzed for T cell anti‐PGLALA‐PE binding. The pooled MFI for PE is shown (data from two independent experiments). (D) Linear regression of max. RG7769 (MFI) to CD3+ T cells in NP40435 anti‐PD‐1+ patients prior to RG7769 infusion (C1D1_pre) as a function of the last reported prior anti‐PD‐1 administration. R 2 = .8338, p = 0.0015. (E) anti‐PGLALA‐PE staining on CD3+ T cells of representative NP40435 patients. Maximum anti‐PGLALA‐PE assessed post ex vivo blood saturation with RG7769, in recently (up to 14 weeks) or historically experienced (>14 weeks) patients versus naïve patients prior to RG7769 (C1D1_pre). Anti‐PGLALA–PE intensities are shown for ex‐vivo saturation and neg. control. (F) CD3+ T cell RG7769 mean ABC in recently (<14 weeks) or historically (>14 weeks) aPD‐1+ patients versus naïve. Data are pooled from (E). ABCs were compared to aPD‐1 naïve (Welch ANOVA test). (G) Schematic of RG7769 binding to T cells in aPD‐1+ patients. Left: RG7769 engages T cells via high‐affinity anti‐PD‐1 engagement if PD‐1 is freely available. Right: In situations where prior aPD‐1 is engaging PD‐1, RG7769 has to displace prior bound aPD‐1 antibodies. Steric hindrance may occur if competing mAbs target an epitope in the PD‐L1 interaction side of PD‐1 [Color figure can be viewed at wileyonlinelibrary.com]

Similar articles

Cited by

References

    1. Green CL, Stewart JJ, Hogerkorp CM, Lackey A, Jones N, Liang M, et al. Recommendations for the development and validation of flow cytometry‐based receptor occupancy assays. Cytometry B Clin Cytom. 2016;90:141–9. - PubMed
    1. Liang M, Schwickart M, Schneider AK, Vainshtein I, Del Nagro C, Standifer N, et al. Receptor occupancy assessment by flow cytometry as a pharmacodynamic biomarker in biopharmaceutical development. Cytometry B Clin Cytom. 2016;90:117–27. - PMC - PubMed
    1. Stevenson L, Richards S, Pillutla R, Torri A, Kamerud J, Mehta D, et al. 2018 White Paper on Recent Issues in Bioanalysis: focus on flow cytometry, gene therapy, cut points and key clarifications on BAV (part 3—LBA/cell‐based assays: immunogenicity, biomarkers and PK assays). Bioanalysis. 2018;10:1973–2001. - PubMed
    1. Stewart JJ, Green CL, Jones N, Liang M, Xu Y, Wilkins DE, et al. Role of receptor occupancy assays by flow cytometry in drug development. Cytometry B Clin Cytom. 2016;90:110–6. - PubMed
    1. Gunn GR, Evans C, Yang E. Immunogenicity and biomarkers: bioanalytical challenges and considerations. Bioanalysis. 2017;9:1729–32. - PubMed

Publication types

Grants and funding

LinkOut - more resources