. 2021 Mar 11;19(3):e3001020.
doi: 10.1371/journal.pbio.3001020. eCollection 2021 Mar.

Expansion microscopy provides new insights into the cytoskeleton of malaria parasites including the conservation of a conoid

Affiliations

Expansion microscopy provides new insights into the cytoskeleton of malaria parasites including the conservation of a conoid

Eloïse Bertiaux et al. PLoS Biol. .

Erratum in

Abstract

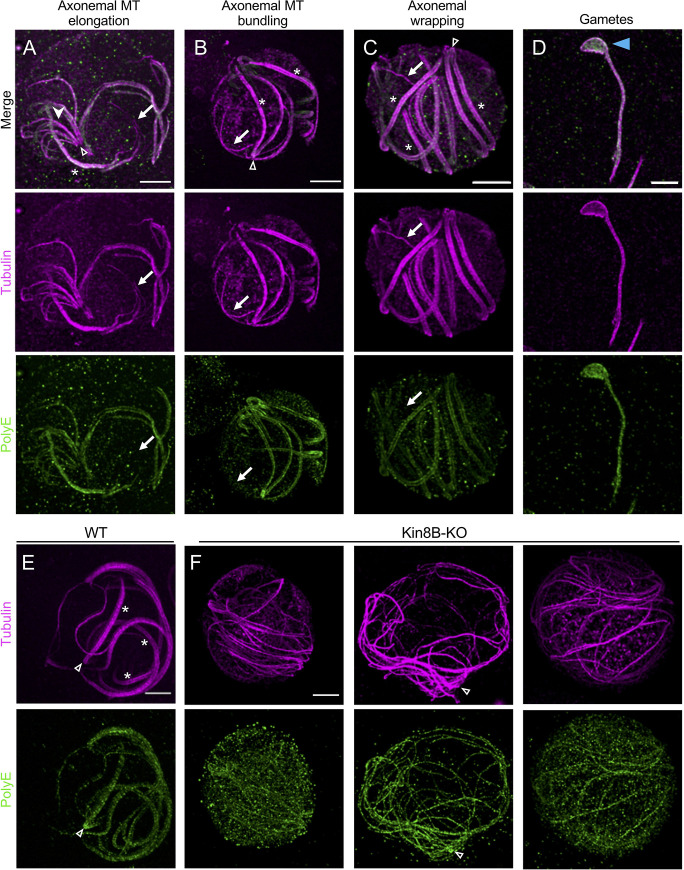
Malaria is caused by unicellular Plasmodium parasites. Plasmodium relies on diverse microtubule cytoskeletal structures for its reproduction, multiplication, and dissemination. Due to the small size of this parasite, its cytoskeleton has been primarily observable by electron microscopy (EM). Here, we demonstrate that the nanoscale cytoskeleton organisation is within reach using ultrastructure expansion microscopy (U-ExM). In developing microgametocytes, U-ExM allows monitoring the dynamic assembly of axonemes and concomitant tubulin polyglutamylation in whole cells. In the invasive merozoite and ookinete forms, U-ExM unveils the diversity across Plasmodium stages and species of the subpellicular microtubule arrays that confer cell rigidity. In ookinetes, we additionally identify an apical tubulin ring (ATR) that colocalises with markers of the conoid in related apicomplexan parasites. This tubulin-containing structure was presumed to be lost in Plasmodium despite its crucial role in motility and invasion in other apicomplexans. Here, U-ExM reveals that a divergent and considerably reduced form of the conoid is actually conserved in Plasmodium species.


Conflict of interest statement

The authors have declared that no competing interests exist.

Figures

Fig 1
Fig 1. U-ExM applied to Plasmodium.
(A) Schematic illustration of U-ExM protocol applied to Plasmodium samples. (B, D, F) Epifluorescence images of a P. berghei gametocyte (B), a P. berghei ookinete (D), and a P. falciparum schizont (F) stained for α- and β-tubulin (magenta, Alexa 568) and DNA (cyan). Scale bar: 5 μm. (C, E, G) Same stages as above expanded using U-ExM and stained for α/β-tubulin (magenta, Alexa 568). Scale bar: 5 μm. (H) Average size of the different studied stages before (IFA) and after expansion (U-ExM). Numbers of Gametocytes: IFA, 25; U-ExM, 28; Ookinetes (length): IFA, 11; U-ExM, 18; Ookinetes (width): IFA, 11; U-ExM, 17; Schizonts: IFA, 30; U-ExM, 47. Orange: ratio between the size before and after expansion are indicated. Blue: gel expansion factor. The raw data can be found in S1 Data. IFA, immunofluorescence assay; U-ExM, ultrastructure expansion microscopy.
Fig 2
Fig 2. Axonemes formation in microgametocytes visualised by U-ExM.
(A–D) Gallery of representative confocal images in microgametocytes and microgametes 15 minutes post-activation based on morphological features. Gametocytes were expanded and stained for α- and β-tubulin (magenta, Alexa 568) and PolyE (green, Alexa 488). Arrows show apparent differences between tubulin and PolyE staining. White arrowhead indicates the fan-shaped arrays of microtubules. Blue arrowhead points to the remnant body. Open arrowhead indicates a clearly identifiable basal body position. White asterisk denotes fully formed axonemes. Scale bar: 5 μm. (E, F) Expanded WT (E) and Kin8B-KO (F) gametocytes stained for α/β-tubulin (magenta, Alexa 568) and PolyE (green, Alexa 488). Complete axonemes are visible 15 minutes after activation for the WT, while individual unassembled singlets or doublets microtubules are seen in the mutant. Open arrowhead indicates a clearly identifiable basal body position. Scale bar: 5 μm. MT, microtubule; U-ExM, ultrastructure expansion microscopy; WT, wild-type.
Fig 3
Fig 3. U-ExM resolves mitotic hemispindles and subpellicular microtubules in P. falciparum schizonts.
(A) Epifluorescence image of an expanded schizont presenting mitotic spindles stained for α/β-tubulin (magenta, Alexa 568) and centrin (green, Alexa 488). White arrowheads point to centrin staining at spindle poles. Note that some extra dots are visible in the centrin staining. Scale bar: 5 μm. (B) Zoom in of an hemispindle stained for α/β-tubulin (magenta, Alexa 568) and centrin (green, Alexa 488). Scale bar: 2 μm. (C) Dot plot representing the mitotic spindle length. Average length +/− standard deviation: 873 nm +/− 427, n = 101. (D) Epifluorescence image of an expanded schizont presenting mitotic spindles stained for α/β-tubulin (magenta, Alexa 568) and PolyE (green, Alexa 488). Scale bar: 5 μm. Note that the mitotic spindle is not polyglutamylated. (E) Zoom in of an hemispindle stained for α/β-tubulin (magenta, Alexa 568) and PolyE (green, Alexa 488). Scale bar: 2 μm. (F) Histogram representing the number of hemispindles displaying 1, 2, 3, 4, 5, 6, 7, or 8 tubulin structures, n = 58. (G) Representative epifluorescence images of expanded P. falciparum schizonts presenting subpellicular microtubules stained for ⍺/β tubulin (magenta, Alexa 568) and PolyE (green, Alexa 488). Note that the subpellicular microtubules are polyglutamylated in contrast to the mitotic spindle. Scale bar: 4 μm. Below are shown 2 examples of representative subpellicular microtubules (dotted white box regions) stained for ⍺/β tubulin (magenta, Alexa 568) and PolyE (green, Alexa 488). Scale bar: 5 μm. (H) Representative epifluorescence images of expanded P. berghei schizonts presenting subpellicular microtubules stained for ⍺/β tubulin (magenta, Alexa 568) and PolyE (green, Alexa 488). Below are shown 2 examples of representative subpellicular microtubules (dotted white box regions). Scale bar: 5 μm. (I) Plot profile along a subpellicular microtubule displaying tubulin and PolyE signals with a schematic representation of a subpellicular microtubule on top. Magenta: tubulin, green: PolyE. Note that PolyE is not uniformly distributed along the subpellicular microtubules. (J) Dot plots representing the length of subpellicular microtubules in P. falciparum and P. berghei. Average length+/− standard deviation: 672 +/− 194 nm, n = 48 and 697 +/− 160 nm, n = 48 and 51, respectively. From 3 independent experiments. (K) Number of subpellicular microtubules in P. falciparum and P. berghei. Averages are 7.7 +/− 0.9 (n = 45) and 1.3 +/− 0.5 (n = 68), respectively. The raw data for C, F, I, J, and K can be found in S1 Data. U-ExM, ultrastructure expansion microscopy.
Fig 4
Fig 4. Identification and characterisation of a conoid-like structure in P. berghei ookinetes.
(A) Representative confocal image of expanded ookinete stained for α/β-tubulin (magenta, Alexa 568) and PolyE (green, Alexa 488) highlighting 3 subregions boxed in white. 1: distal, 2: centre and 3: apical regions, respectively. Note that the tubulin ring or ATR in 3 is not polyglutamylated. Scale bar: 5 μm. (B) Gallery of the apical region of expanded ookinetes stained for α/β-tubulin (magenta, Alexa 568) and SAS6L (cyan, Alexa 488). Scale bar: 1 μm. (C) Gallery of the apical region of expanded ookinetes stained for α- and β-tubulin (magenta, Alexa 568) and MyoB (yellow, Alexa 488). Scale bar: 1 μm. (D) Measure of the diameter of the ATR (Tubulin), SAS6L (cyan), and MyoB (yellow) rings. Averages and standard deviations in nm are as follows: Tubulin: 268 +/− 41 (n = 37), SAS6L: 243 +/− 30 (n = 22), MyoB: 323 +/− 57 (n = 15). Data from 2 independent experiments. Student t test: p = 0.0186 (SAS6L versus Tubulin) and p = 0.0003 (MyoB versus Tubulin). (E) Distance between the tubulin rings and SAS6L (cyan) or MyoB (yellow). Averages and standard deviations in nm are as follows: SAS6L-Tub: 2 +/− 8 (n = 21) and MyoB-Tub: 9 +/− 26 (n = 16). Data from 2 independent experiments. (F, G) Gallery of the apical region of expanded WT (F) and GCβ mutant (G) ookinetes stained for α/β-tubulin (magenta, Alexa 568) and PolyE (green, Alexa 488). Scale bar: 1 μm. (H) Percentage of WT (n = 56) and GCβ mutant ookinetes (n = 47) displaying a visible or collapsed ATR from 3 independent experiments. (I) Measurement of the ATR diameter in WT and GCβ expanded ookinetes. Averages and standard deviations in nm are as follows: WT = 254 +/− 56 (n = 30) and GCβ = 262 +/− 63 (n = 21). From 3 independent experiments. We observed no difference in the measured diameters in the 2 conditions. Student t test: p = 0.6534. ns = not significant. (J) Distance between the apical pole to the ATR in WT and GCβ mutant expanded ookinetes. Averages and standard deviations in nm are as follows: WT = 192 +/− 54 (n = 61) and GCβ = 145 +/− 63 (n = 79). From 3 independent experiments. Student t test: p < 0.0001. The raw data for D, E, H, I, and J can be found in S1 Data. ATR, apical tubulin ring; GCβ, guanylyl cyclase beta; SAS6L, SAS-6-like; WT, wild-type.
Fig 5
Fig 5. U-ExM coupled with NHS-ester/Tubulin staining reveals the position of the ATR.
(A) Merged representative confocal image of an expanded ookinete stained for α/β-tubulin (magenta) and NHS-ester (grey). The magenta arrow indicates the position of the ATR. Scale bar: 1 μm. (B) Insets of the apical region from (A) highlighting the position of the ATR relative to the general ookinete structural features. (C) EM image of the apical region of an ookinete. Black arrowhead points to the apical protrusion. Scale bar: 250 nm. (D, E) Section (D) or maximum intensity projection (E) of the apical region of an expanded ookinete stained for NHS-ester from an entire image stack. Black arrowhead points to the apical protrusion. Scale bar: 250 nm. (F) Schematic representation of the apical region highlighting the apical protrusion, the collar, and subpellicular microtubules. (G) Section of a stack of an expanded ookinete stained with NHS-ester (grey) and α/β-tubulin (magenta). Dotted square indicates the position of the zoom shown in H. Scale bar: 500 nm. (H) Zoom in from image in G. Dotted line with the open arrowhead indicates the position of the ATR, the black arrowhead shows the apical protrusion, the magenta arrowhead points to the ATR, and the black arrow to the position of the plot profile (I). Scale bar: 250 nm. (I) Plot profile intensity over length in nm showing the position of the ATR relative to the apical protrusion. Note that the ATR position is in line with the end of the collar and/or the IMC, below the apical protrusion. The underlying data can be found in S1 Data. (J) Three-dimensional rendering of an NHS-ester/tubulin overlay (grey and magenta, respectively) of an expanded ookinete. Black and magenta arrowheads indicate the apical protrusion and ATR, respectively. ATR, apical tubulin ring; EM, electron microscopy; IMC, inner membrane complex; NHS, N-hydroxysuccinimide; U-ExM, ultrastructure expansion microscopy.
Fig 6
Fig 6. Current models.
(A) Proposed model of axonemal assembly in microgametocytes featuring the coexistence of short fan-shaped or basket-like microtubules with partly assembled and fully assembled axonemes. Basal bodies are represented at the base of axonemes. Microtubules: magenta and PolyE: green. (B) Proposed models of the apical complex organisation in P. falciparum and P. berghei merozoites illustrating the diversity of the subpellicular microtubules organisation. The orientation of the polyglutamylation profile of the subpellicular microtubules in the P. berghei merozoite is based on Fig 3H. Grey denotes the presence of additional electron dense rings observed by EM whose molecular composition remains unknown. The relative position of MyoB (dotted yellow) in merozoite is currently unknown. (C) Model of the apical complex organisation in P. berghei ookinete superimposed on an NHS-ester stained expanded ookinete. This model highlights a conoid-like structure present in ookinete, composed of an ATR (magenta) and SAS6L (cyan) above the APR (grey). An additional MyoB ring is also detected in ookinete (yellow). The complex made of the ATR and SAS6L/MyoB rings is in line with the collar and/or the IMC, below the apical protrusion and above the APR. APR, apical polar ring; ATR, apical tubulin ring; IMC, inner membrane complex; SAS6L, SAS-6-like.

Comment in

  • Apicomplexans: A conoid ring unites them all.
    Guizetti J, Frischknecht F. Guizetti J, et al. PLoS Biol. 2021 Mar 11;19(3):e3001105. doi: 10.1371/journal.pbio.3001105. eCollection 2021 Mar. PLoS Biol. 2021. PMID: 33705378 Free PMC article.

References

    1. Adl SM, Leander BS, Simpson AGB, Archibald JM, Anderson OR, Bass D, et al.. Diversity, Nomenclature, and Taxonomy of Protists. Syst Biol. 2007;56(4):684–9. 10.1080/10635150701494127 - DOI - PubMed
    1. Morrissette NS, Sibley LD. Cytoskeleton of apicomplexan parasites. Microbiol Mol Biol Rev. 2002;66(1):21–38. 10.1128/mmbr.66.1.21-38.2002 - DOI - PMC - PubMed
    1. Frénal K, Dubremetz JF, Lebrun M, Soldati-Favre D. Gliding motility powers invasion and egress in Apicomplexa. Nat Rev Microbiol. 2017;15(11):645–60. 10.1038/nrmicro.2017.86 - DOI - PubMed
    1. Bannister LH, Hopkins JM, Fowler RE, Krishna S, Mitchell GH. Ultrastructure of rhoptry development in Plasmodium falciparum erythrocytic schizonts. Parasitology. 2000;121(3):273–87. 10.1017/s0031182099006320 - DOI - PubMed
    1. Hanssen E, Dekiwadia C, Riglar DT, Rug M, Lemgruber L, Cowman AF, et al.. Electron tomography of Plasmodium falciparum merozoites reveals core cellular events that underpin erythrocyte invasion. Cell Microbiol. 2013;15(9):1457–72. 10.1111/cmi.12132 - DOI - PubMed

Publication types