

Comment
doi: 10.1371/journal.pbio.3001092.
eCollection 2021 Mar.
Response to Hulman and colleagues regarding "Glucotypes reveal new patterns of glucose dysregulation"
Affiliations
- PMID: 33705379
- PMCID: PMC7951842
- DOI: 10.1371/journal.pbio.3001092
Item in Clipboard
Comment
Response to Hulman and colleagues regarding "Glucotypes reveal new patterns of glucose dysregulation"
PLoS Biol.
.
Abstract
In a response to a Formal Comment critiquing their model for classifying individualized glucose patterns into glucotypes, these authors stand by their results and conclusions, which can be reproduced using their publicly available data, and maintain that improved algorithms for analyzing CGM data will continue to emerge and enrich the field.
Conflict of interest statement
The authors have declared that no competing interests exist.
Figures
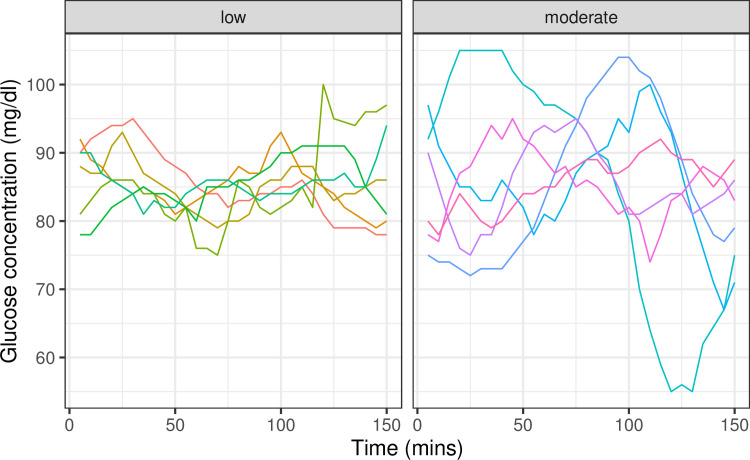
While there is a correlation between mean glucose concentration and standard deviation, such that glycemic profiles with higher glucose concentration are also more variable, we show examples of time windows where the mean glucose concentration is comparable, but with different glycemic variation. In such cases, the glucotype algorithm by Hall and colleagues, which uses the overall shape of the time window, captures both mean glucose concentration and variation. The windows are selected from S3 Data from our study [1]. All selected windows have mean glucose concentration between 85 and 86 mg/dl. While this concentration is too low for a severe glucotype classification, the windows are classified as low or moderate reflecting their glycemic variability.
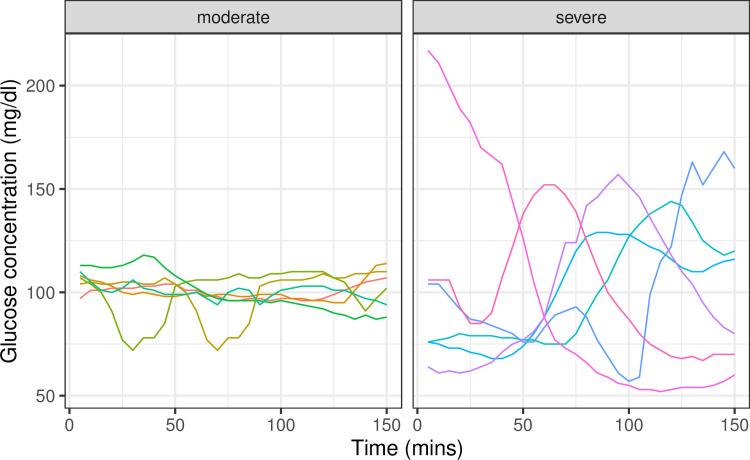
All selected windows have mean glucose concentration between 100 and 101 mg/dl. While this concentration is too high for a low glucotype classification, the windows are classified as moderate or severe reflecting their glycemic variability.
Comment on
-
Glucotypes reveal new patterns of glucose dysregulation.PLoS Biol. 2018 Jul 24;16(7):e2005143. doi: 10.1371/journal.pbio.2005143. eCollection 2018 Jul. PLoS Biol. 2018. PMID: 30040822 Free PMC article.
-
Towards precision medicine in diabetes? A critical review of glucotypes.PLoS Biol. 2021 Mar 11;19(3):e3000890. doi: 10.1371/journal.pbio.3000890. eCollection 2021 Mar. PLoS Biol. 2021. PMID: 33705389 Free PMC article.
References
Publication types
MeSH terms
Substances
LinkOut - more resources
Full Text Sources
Other Literature Sources
Medical
