. 2021 Mar 11;17(3):e1008642.
doi: 10.1371/journal.pcbi.1008642. eCollection 2021 Mar.

Health inequities in influenza transmission and surveillance

Affiliations

Health inequities in influenza transmission and surveillance

Casey M Zipfel et al. PLoS Comput Biol. .

Abstract

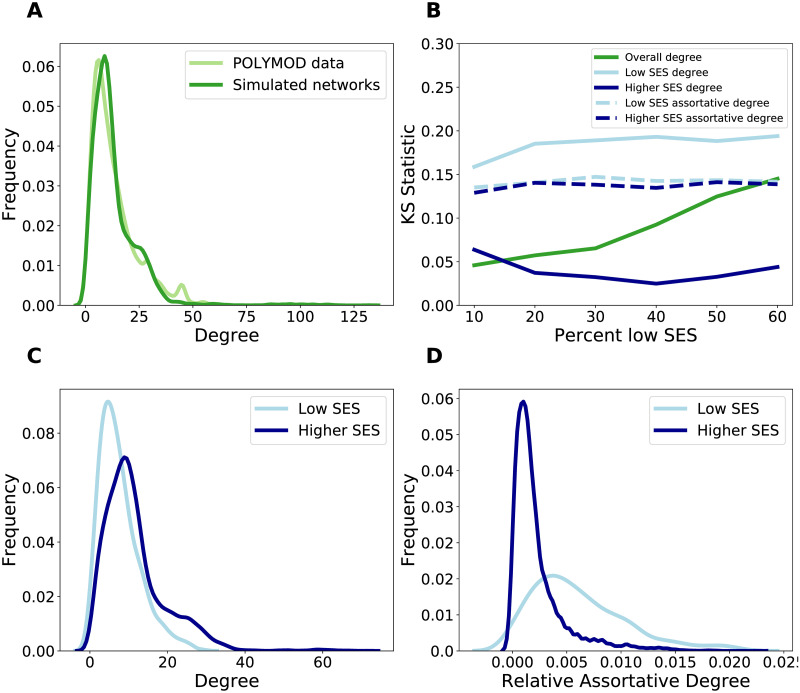
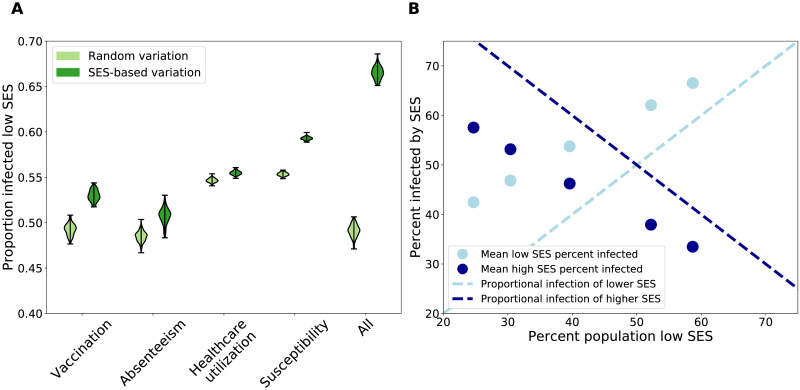
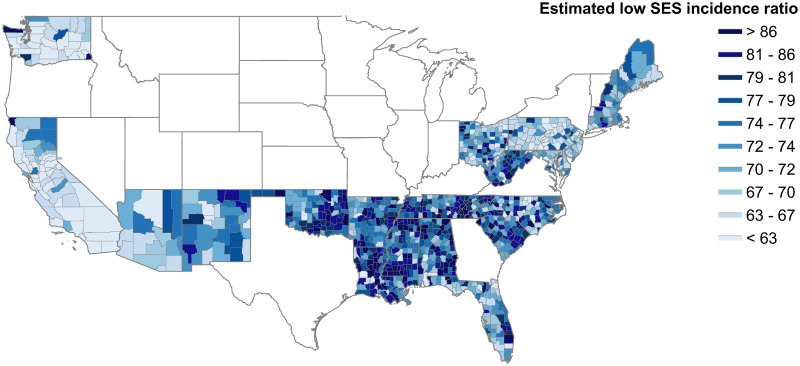
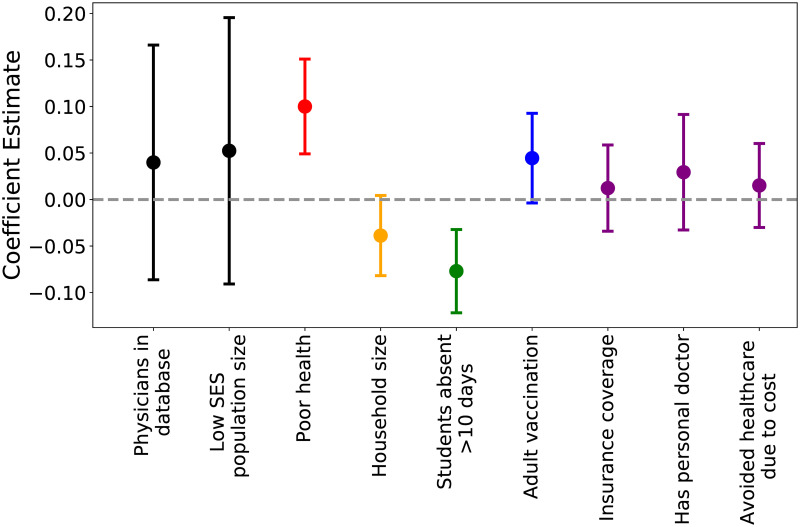
The lower an individual's socioeconomic position, the higher their risk of poor health in low-, middle-, and high-income settings alike. As health inequities grow, it is imperative that we develop an empirically-driven mechanistic understanding of the determinants of health disparities, and capture disease burden in at-risk populations to prevent exacerbation of disparities. Past work has been limited in data or scope and has thus fallen short of generalizable insights. Here, we integrate empirical data from observational studies and large-scale healthcare data with models to characterize the dynamics and spatial heterogeneity of health disparities in an infectious disease case study: influenza. We find that variation in social and healthcare-based determinants exacerbates influenza epidemics, and that low socioeconomic status (SES) individuals disproportionately bear the burden of infection. We also identify geographical hotspots of influenza burden in low SES populations, much of which is overlooked in traditional influenza surveillance, and find that these differences are most predicted by variation in susceptibility and access to sickness absenteeism. Our results highlight that the effect of overlapping factors is synergistic and that reducing this intersectionality can significantly reduce inequities. Additionally, health disparities are expressed geographically, and targeting public health efforts spatially may be an efficient use of resources to abate inequities. The association between health and socioeconomic prosperity has a long history in the epidemiological literature; addressing health inequities in respiratory-transmitted infectious disease burden is an important step towards social justice in public health, and ignoring them promises to pose a serious threat.


Conflict of interest statement

The authors have declared that no competing interests exist.

Figures

Fig 1
Fig 1. The characteristics of the networks generated from the ERGM model based on POLYMOD data.
A: The degree distribution of the POLYMOD data (light green) compared to 10 simulated networks (dark green). B: The Kolmogorov-Smirnov (KS) statistic to evaluate the dissimilarity of the ERGM-simulated networks to the POLYMOD data as additional low education individuals are added to the network. KS statistics compare the dissimilarity of the overall degree distribution (dark green), the degree distribution of low SES nodes (light blue, solid), the degree distribution of high SES nodes (dark blue solid), the assortative degree (e.g. the low SES contacts of low SES nodes) for low SES nodes (light blue, dashed), and the assortative degree for high SES nodes (dark blue, dashed). Low KS values indicate similar distributions. C: The degree distribution of low SES nodes (light blue) and high SES nodes (dark blue) in 10 simulated networks. D: The relative assortative degree distribution (e.g. number of low SES contacts of low SES nodes/number of low SES nodes) of low SES nodes (light blue) and high SES nodes (dark blue) in 10 simulated networks.
Fig 2
Fig 2. Results of epidemiological simulations on ERGM networks with SES-driven social and healthcare-based differences.
A) All of the proposed SES-driven differences result in an increase in infection of low SES individuals (dark green, right of paired violin plots), compared to simulations where the differences are randomly distributed throughout the population (light green, left of paired violin plots). This difference is most pronounced when all of the mechanisms occur together. These simulations were performed on a network composed of 60% low SES, but the results are consistent across networks with different SES compositions. B) In all networks, when all SES-driven differences are present, low SES individuals (mean percent of infected population that is low SES shown in light blue dots) are disproportionately infected, relative to the expectation (light blue dashed line). High SES individuals are disproportionately underinfected compared the expectation (dark blue dots compared to dark blue dashed line).
Fig 3
Fig 3. County-level map of model estimates of low SES ILI incidence ratio per 1,000 people.
Lower values are represented in light blue, and higher values are represented in darker blue. States in white were omitted due to lack of covariate data. Some county covariate data in included states was imputed based on surrounding neighbors, where missing. Unimputed findings are available in S37 Fig.
Fig 4
Fig 4. Mean model coefficient estimates and credible intervals.
Points are colored by what process each covariate represents (black: measurement bias, red: susceptibility, orange: social contact differences, green: sickness absenteeism, blue: vaccination, purple: healthcare utilization). Each process covariate is specific to low SES populations (e.g.“adult vaccination” is only vaccination rates of low SES adults).

References

    1. Penman-Aguilar A, Talih M, Huang D, Moonesinghe R, Bouye K, Beckles G. Measurement of Health Disparities, Health Inequities, and Social Determinants of Health to Support the Advancement of Health Equity. J Public Helath Manag Pract. 2016;22(Suppl1):S33–S42. 10.1097/PHH.0000000000000373 - DOI - PMC - PubMed
    1. Adler NE, Newman K. Socioeconomic disparities in health: Pathways and policies. Health Affairs. 2002;21(2):60–76. 10.1377/hlthaff.21.2.60 - DOI - PubMed
    1. Murray CJ, Kulkarni SC, Michaud C, Tomijima N, Bulzacchelli MT, Iandiorio TJ, et al.. Eight Americas: investigating mortality disparities across races, counties, and race-counties in the United States. PLoS medicine. 2006;3(9). 10.1371/journal.pmed.0030260 - DOI - PMC - PubMed
    1. Bosworth B. Increasing Disparities in Mortality by Socioeconomic Status. Annual Review of Public Health. 2018;39(1):237–251. 10.1146/annurev-publhealth-040617-014615 - DOI - PubMed
    1. Centers for Disease Control and Prevention. Influenza; 2019.

Publication types