

Clinical decision support tool for diagnosis of COVID-19 in hospitals
- PMID: 33705435
- PMCID: PMC7951867
- DOI: 10.1371/journal.pone.0247773
Clinical decision support tool for diagnosis of COVID-19 in hospitals
Abstract
Background: The coronavirus infectious disease 19 (COVID-19) pandemic has resulted in significant morbidities, severe acute respiratory failures and subsequently emergency departments' (EDs) overcrowding in a context of insufficient laboratory testing capacities. The development of decision support tools for real-time clinical diagnosis of COVID-19 is of prime importance to assist patients' triage and allocate resources for patients at risk.
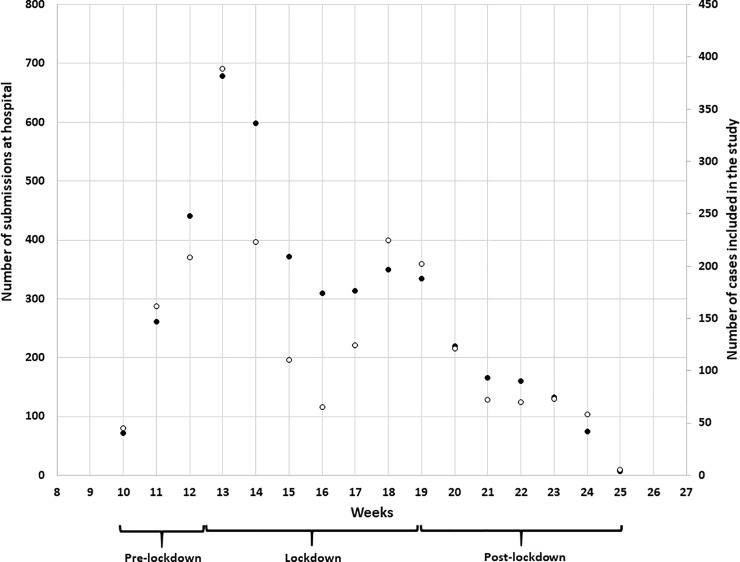
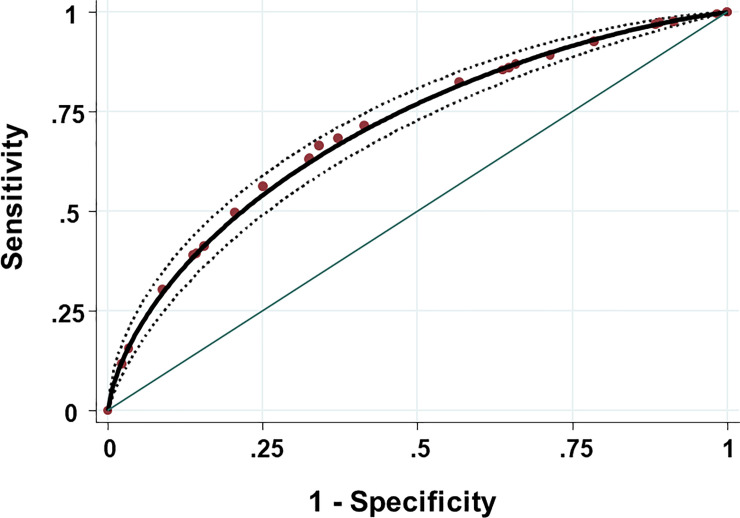
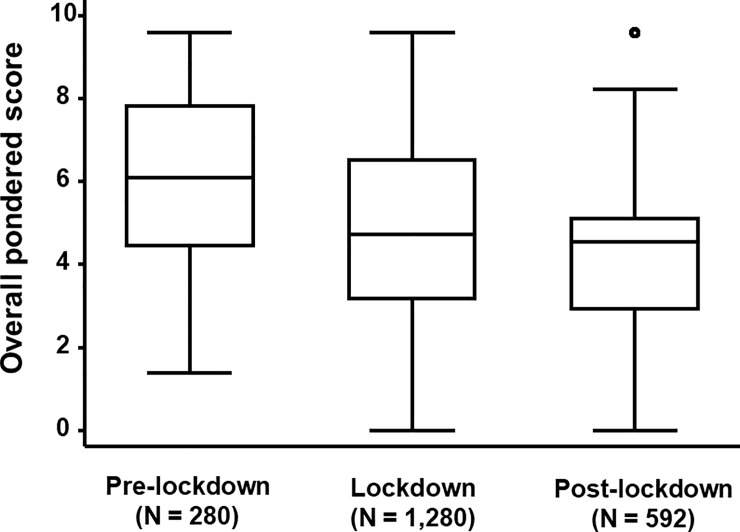
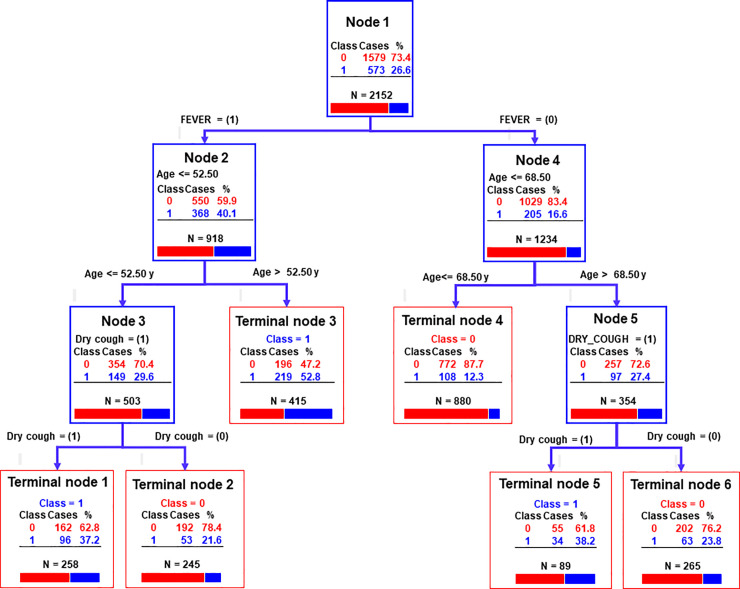
Methods and principal findings: From March 2 to June 15, 2020, clinical patterns of COVID-19 suspected patients at admission to the EDs of Liège University Hospital, consisting in the recording of eleven symptoms (i.e. dyspnoea, chest pain, rhinorrhoea, sore throat, dry cough, wet cough, diarrhoea, headache, myalgia, fever and anosmia) plus age and gender, were investigated during the first COVID-19 pandemic wave. Indeed, 573 SARS-CoV-2 cases confirmed by qRT-PCR before mid-June 2020, and 1579 suspected cases that were subsequently determined to be qRT-PCR negative for the detection of SARS-CoV-2 were enrolled in this study. Using multivariate binary logistic regression, two most relevant symptoms of COVID-19 were identified in addition of the age of the patient, i.e. fever (odds ratio [OR] = 3.66; 95% CI: 2.97-4.50), dry cough (OR = 1.71; 95% CI: 1.39-2.12), and patients older than 56.5 y (OR = 2.07; 95% CI: 1.67-2.58). Two additional symptoms (chest pain and sore throat) appeared significantly less associated to the confirmed COVID-19 cases with the same OR = 0.73 (95% CI: 0.56-0.94). An overall pondered (by OR) score (OPS) was calculated using all significant predictors. A receiver operating characteristic (ROC) curve was generated and the area under the ROC curve was 0.71 (95% CI: 0.68-0.73) rendering the use of the OPS to discriminate COVID-19 confirmed and unconfirmed patients. The main predictors were confirmed using both sensitivity analysis and classification tree analysis. Interestingly, a significant negative correlation was observed between the OPS and the cycle threshold (Ct values) of the qRT-PCR.
Conclusion and main significance: The proposed approach allows for the use of an interactive and adaptive clinical decision support tool. Using the clinical algorithm developed, a web-based user-interface was created to help nurses and clinicians from EDs with the triage of patients during the second COVID-19 wave.
Conflict of interest statement
The authors have declared that no competing interests exist.
Figures
Similar articles
-
Identifying COVID-19 cases in outpatient settings.Epidemiol Infect. 2021 Apr 5;149:e92. doi: 10.1017/S0950268821000704. Epidemiol Infect. 2021. PMID: 33814027 Free PMC article.
-
Acute Clinical Syndromes and Suspicion of SARS-CoV-2 Infection: The Experience of a Single Romanian Center in the Early Pandemic Period.Medicina (Kaunas). 2021 Jan 29;57(2):121. doi: 10.3390/medicina57020121. Medicina (Kaunas). 2021. PMID: 33572732 Free PMC article.
-
Clinical prediction rule for SARS-CoV-2 infection from 116 U.S. emergency departments 2-22-2021.PLoS One. 2021 Mar 10;16(3):e0248438. doi: 10.1371/journal.pone.0248438. eCollection 2021. PLoS One. 2021. PMID: 33690722 Free PMC article.
-
Thoracic imaging tests for the diagnosis of COVID-19.Cochrane Database Syst Rev. 2020 Sep 30;9:CD013639. doi: 10.1002/14651858.CD013639.pub2. Cochrane Database Syst Rev. 2020. Update in: Cochrane Database Syst Rev. 2020 Nov 26;11:CD013639. doi: 10.1002/14651858.CD013639.pub3. PMID: 32997361 Updated.
-
Diagnostic accuracy of clinical signs and symptoms of COVID-19: A systematic review and meta-analysis to investigate the different estimates in a different stage of the pandemic outbreak.J Glob Health. 2023 Jul 14;13:06026. doi: 10.7189/jogh.13.06026. J Glob Health. 2023. PMID: 37441773 Free PMC article.
Cited by
-
Genomic surveillance and serological profile of SARS-CoV-2 variants circulating in Macaé and nearby cities, southeastern Brazil.Front Microbiol. 2024 Apr 30;15:1386271. doi: 10.3389/fmicb.2024.1386271. eCollection 2024. Front Microbiol. 2024. PMID: 38746751 Free PMC article.
-
Clinical prediction models for diagnosis of COVID-19 among adult patients: a validation and agreement study.BMC Infect Dis. 2022 May 14;22(1):464. doi: 10.1186/s12879-022-07420-4. BMC Infect Dis. 2022. PMID: 35568825 Free PMC article.
-
Comparison of clinical, laboratory and radiological features in confirmed and unconfirmed COVID-19 patients.Future Microbiol. 2021 Dec;16:1389-1400. doi: 10.2217/fmb-2021-0162. Epub 2021 Nov 23. Future Microbiol. 2021. PMID: 34812057 Free PMC article.
-
Clinical decision support systems (CDSS) in assistance to COVID-19 diagnosis: A scoping review on types and evaluation methods.Health Sci Rep. 2024 Feb 20;7(2):e1919. doi: 10.1002/hsr2.1919. eCollection 2024 Feb. Health Sci Rep. 2024. PMID: 38384976 Free PMC article.
-
Process Improvement Approaches for Increasing the Response of Emergency Departments against the COVID-19 Pandemic: A Systematic Review.Int J Environ Res Public Health. 2021 Aug 20;18(16):8814. doi: 10.3390/ijerph18168814. Int J Environ Res Public Health. 2021. PMID: 34444561 Free PMC article.
References
-
- Bi Q, Wu Y, Mei S, Ye C, Zou X, Zhang Z, et al.. Epidemiology and transmission of COVID-19 in 391 cases and 1286 of their close contacts in Shenzhen, China: A retrospective cohort study. The Lancet Infectious Diseases 2020; S1473–3099(20): 30285–30287. 10.1016/S1473-3099(20)30287-5 - DOI - PMC - PubMed
Publication types
MeSH terms
LinkOut - more resources
Full Text Sources
Other Literature Sources
Medical
Miscellaneous
