. 2021 Apr 1;184(7):1740-1756.e16.
doi: 10.1016/j.cell.2021.02.009. Epub 2021 Mar 10.

Dissecting the contribution of host genetics and the microbiome in complex behaviors

Affiliations

Dissecting the contribution of host genetics and the microbiome in complex behaviors

Shelly A Buffington et al. Cell. .

Abstract

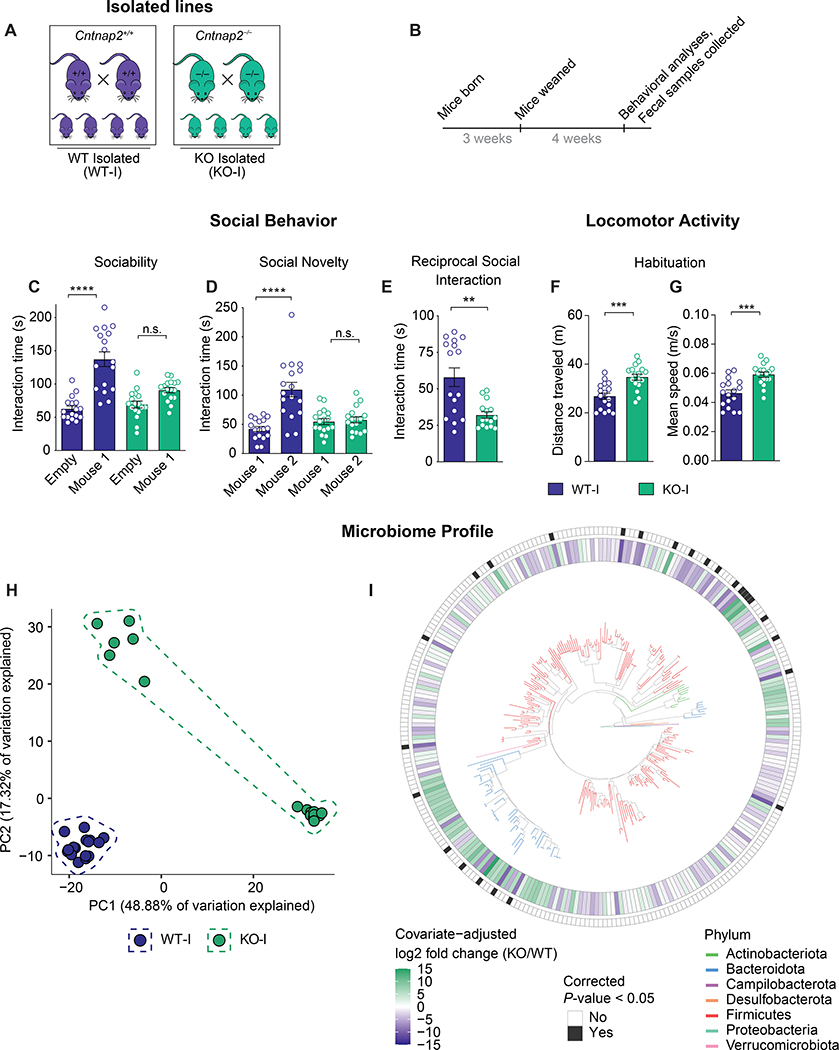
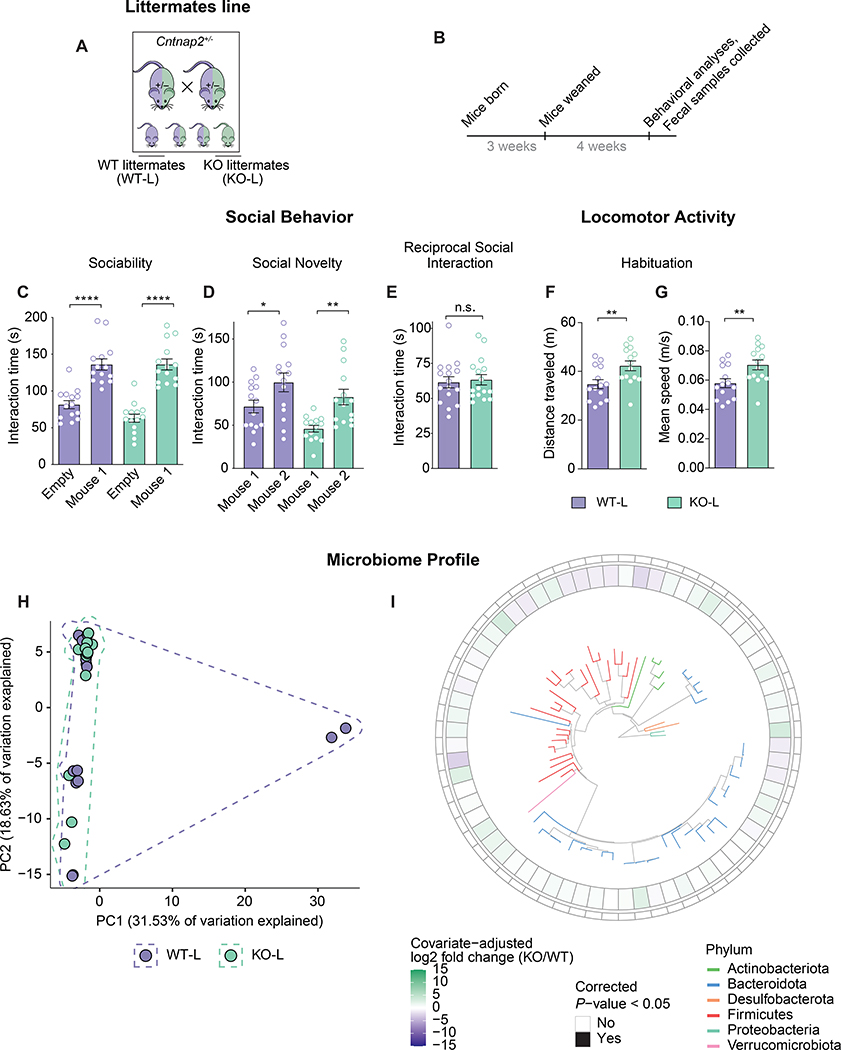
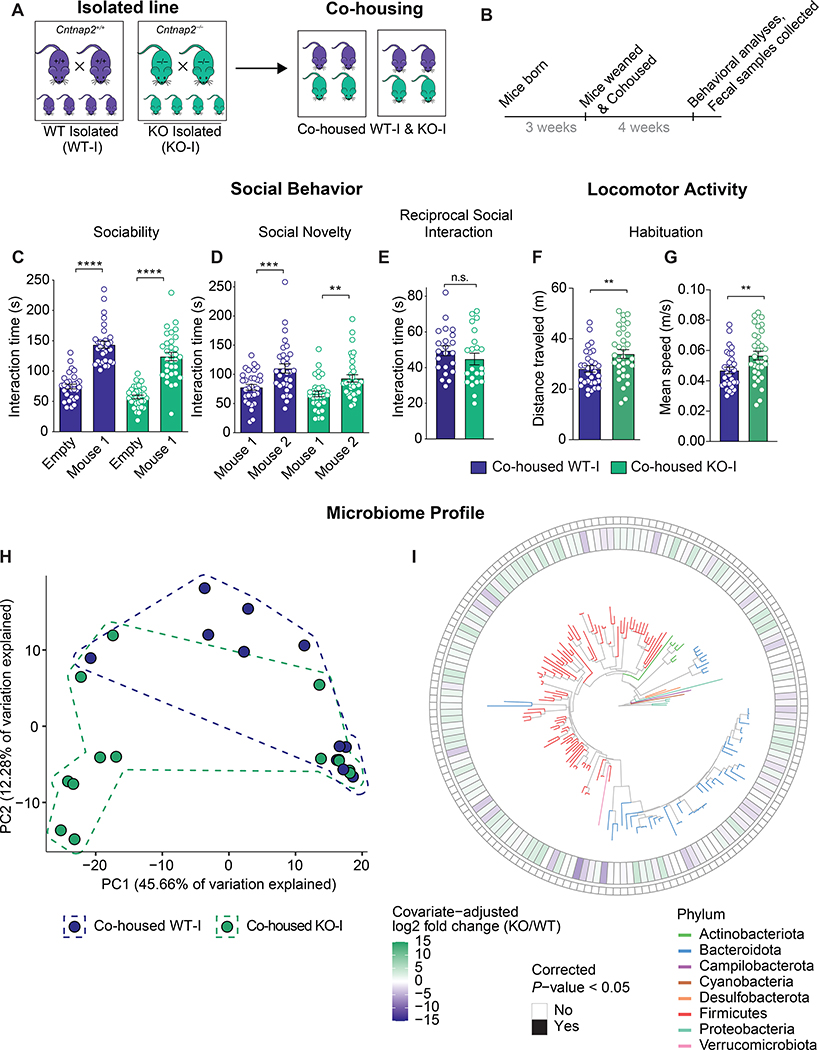
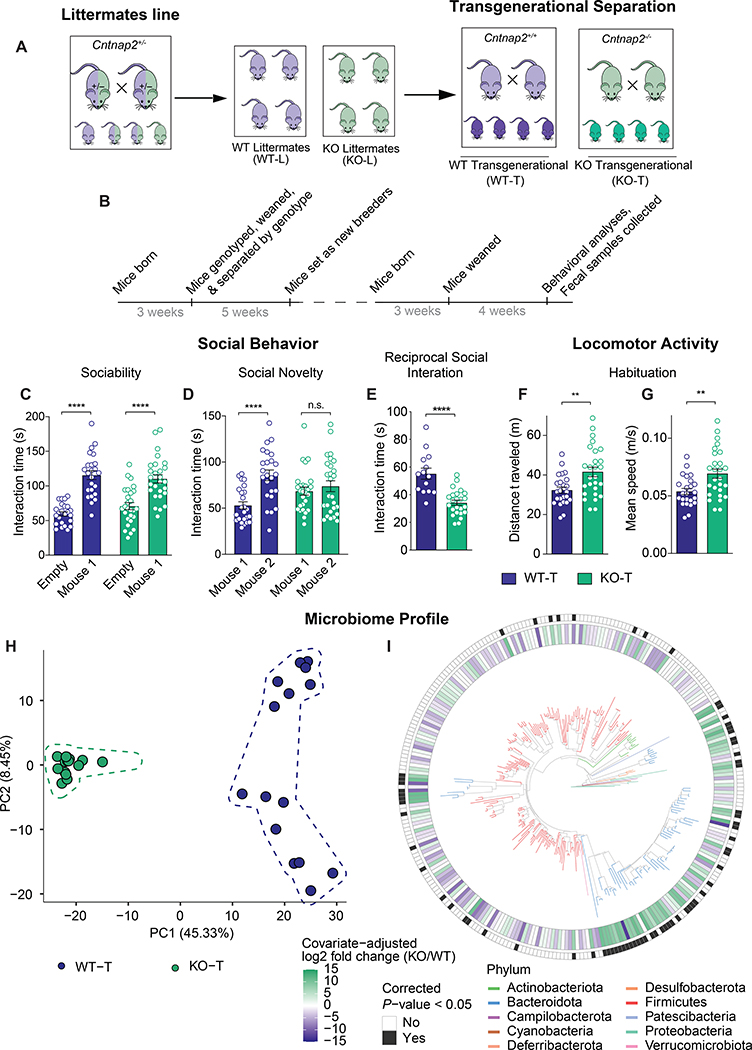
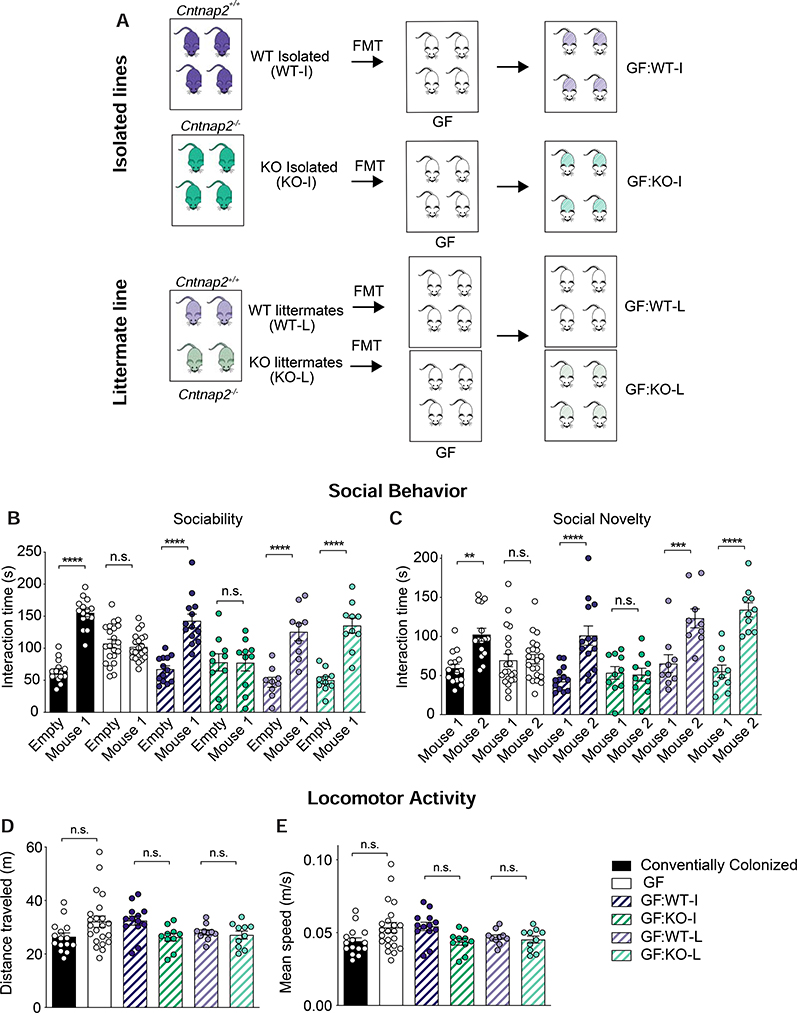
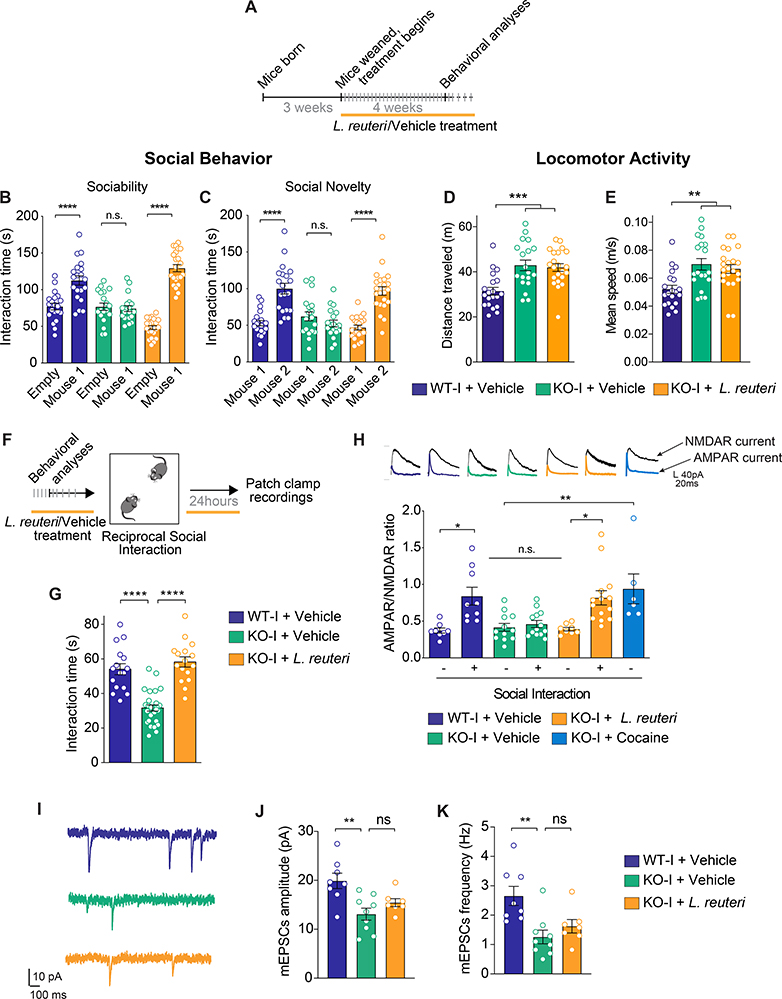
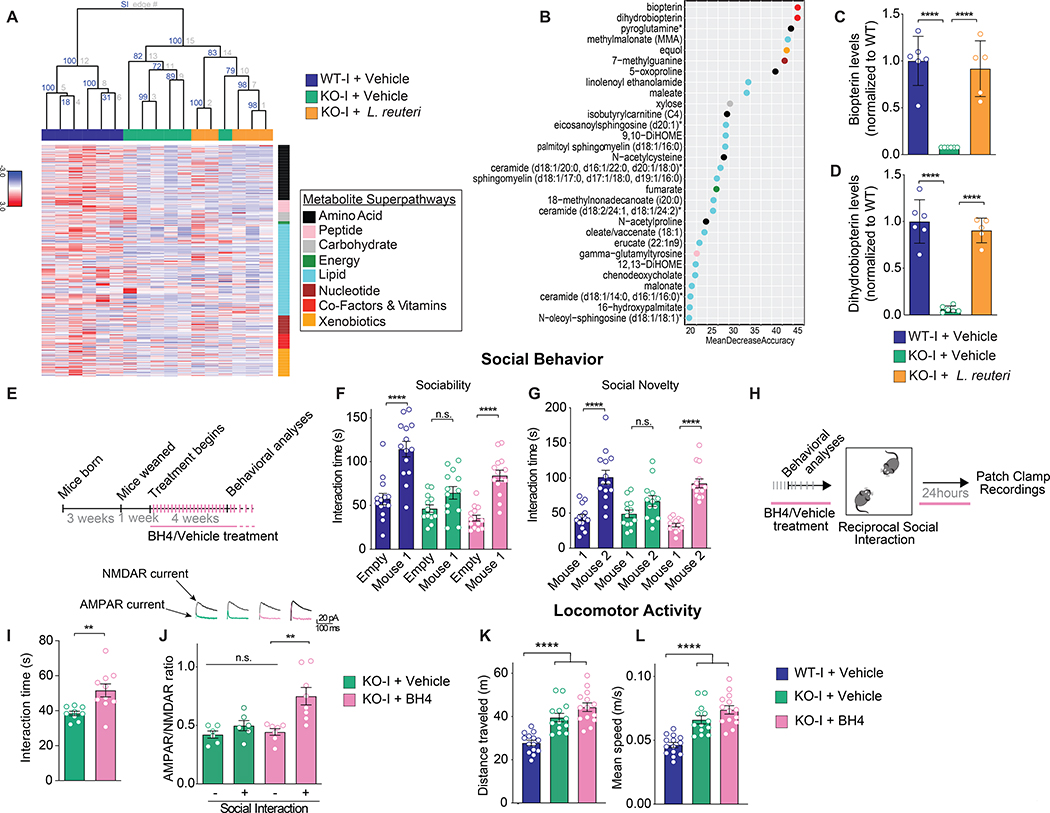
The core symptoms of many neurological disorders have traditionally been thought to be caused by genetic variants affecting brain development and function. However, the gut microbiome, another important source of variation, can also influence specific behaviors. Thus, it is critical to unravel the contributions of host genetic variation, the microbiome, and their interactions to complex behaviors. Unexpectedly, we discovered that different maladaptive behaviors are interdependently regulated by the microbiome and host genes in the Cntnap2-/- model for neurodevelopmental disorders. The hyperactivity phenotype of Cntnap2-/- mice is caused by host genetics, whereas the social-behavior phenotype is mediated by the gut microbiome. Interestingly, specific microbial intervention selectively rescued the social deficits in Cntnap2-/- mice through upregulation of metabolites in the tetrahydrobiopterin synthesis pathway. Our findings that behavioral abnormalities could have distinct origins (host genetic versus microbial) may change the way we think about neurological disorders and how to treat them.

Keywords: L. reuteri; gut-brain-axis; hologenome; hyperactivity; neurological disorders; oxytocin; social behavior; tetrahydrobiopterin.


Conflict of interest statement

Declaration of interests A patent application related to the role of L. reuteri on social behavior has been filed by BCM. Findings regarding the manipulation of endogenous biotperin levels by the microbiome are the subject of a provisional patent application owned by BCM. M.C.-M. is a scientific co-founder of Mirkrovia. The authors declare no other competing interests.

Figures

Fig. 1.
Fig. 1.. Cntnap2−/− mice generated from isolated breeding lines exhibit impaired social behavior, hyperactivity, and a distinct microbiome composition compared to WT controls.
A, Breeding scheme for the isolated lines (Cntnap2+/+: WT-I; Cntnap2−/−: KO-I). B, Experimental design for animals from isolated lines. C-D, Social behavior in WT-I and KO-I mice as assessed in the 3-chamber test (n = 17 per group; C, Sociability: WT-I: t = 7.508, P < 0.0001; KO-I: t = 1.01, P = 0.6322; two-way ANOVA: F1,64 = 21.11, P < 0.0001; D, Social Novelty: WT-I: t = 6.386, P < 0.0001; KO-I: t = 0.2782, P > 0.9999; two-way ANOVA, F1,64 = 18.65, P < 0.0001). E, Social behavior in WT-I and KO-I mice as assessed in the reciprocal social interaction test (n = 15–16 per group, Mann-Whitney U = 52.50, P = 0.0065). F-G, Locomotor activity levels in WT-I and KO-I mice as assessed in the habituation phase of the 3-chamber test (n = 17 per group; F, Distance traveled: WT-I vs KO-I: Mann-Whitney U = 42, P = 0.0002; G, Mean Speed: WT-I vs KO-I: Mann-Whitney U = 42.5, P = 0.0002). H, Beta diversity of the 16S rRNA gene sequencing dataset from feces of WT-I and KO-I mice (n = 16 per group) as determined by principal components analysis (PCA) of PhILR-transformed Euclidean distances (PERMANOVA: R2 = 0.35732, P = 0.0002). I, Phylogenetic tree of ASVs detected in the 16S rRNA gene sequencing dataset with tree branch colors associated with the phylum of the ASV, the inner circle representing differences in ASV abundance between groups (sliding scale: green = higher in KO, white = no difference, purple = higher in WT), and the outer circle representing the significance level after Benjamini-Hochberg false discovery rate correction (white: not significant, P ≥ 0.05; black: significant, P < 0.05). See also Figure S1 and Table S1, S2.
Fig 2.
Fig 2.. Cntnap2−/− mice generated from littermates breeding line exhibit normal social behavior and a microbiome composition similar to WT controls, but remain hyperactive.
A, Breeding scheme for the littermate line (Cntnap2+/+: WT-L; Cntnap2−/−: KO-L). B, Experimental design for animals from littermate line. C-D, Social behavior in WT-L and KO-L mice as assessed in the 3-chamber test (n = 14 per group; C, Sociability: WT-L: t = 5.856, P < 0.0001; KO-L: t = 7.849, P < 0.0001; two-way ANOVA: F1,52 = 1.938, P < 0.1650; D, Social Novelty: WT-L: t = 2.415, P = 0.0386; KO-L: t = 3.145, P = 0.0055; two-way ANOVA, F1,52 = 0.266, P = 0.6082). E, Social behavior in WT-L and KO-L mice as assessed in the reciprocal social interaction test (n = 16 per group, Mann-Whitney U = 124, P = 0.897). F-G, Locomotor activity levels in WT-L and KO-L mice as assessed in the habituation phase of the 3-chamber test (n = 14 per group; F, Distance traveled: WT-L vs KO-L: Mann-Whitney U = 42, P = 0.0091; G, Mean speed: WT-L vs KO-L: Mann-Whitney U = 42.5, P = 0.0095). H, Beta diversity of the 16S rRNA gene sequencing dataset from feces of WT-L and KO-L mice (n = 14 per group) as determined by principal components analysis (PCA) of PhILR-transformed Euclidean distances (PERMANOVA: R2 = 0.04440, P = 0.26975). I, Phylogenetic tree of ASVs detected in the 16S rRNA gene sequencing dataset with tree branch colors associated with the phylum of the ASV, the inner circle representing differences in ASV abundance between groups (sliding scale: green = higher in KO, white = no difference, purple = higher in WT), and the outer circle representing the significance level after Benjamini-Hochberg false discovery rate correction (white: not significant, P ≥ 0.05; black: significant, P < 0.05). See also Figure S1, and Table S1, S2.
Fig. 3.
Fig. 3.. Co-housing reverses the social deficits and leads to a more similar gut microbiome composition but fails to rescue hyperactivity of KO-I mice.
A-B, Schemes of experimental design. C-D, Social behavior in the co-housed WT-I and co-housed KO-I mice as assessed in the 3-chamber test (n = 31–32 per group; C, Sociability: co-housed WT-I: t = 9.442, P < 0.0001; co-housed KO-I: t = 9.284, P < 0.0001; two-way ANOVA: F1,122 = 0.04696, P = 0.8288; D, Social Novelty: co-housed WT-I: t = 3.666, P = 0.0007; co-housed KO-I: t =3.066, P = 0.0053; two-way ANOVA, F1,122 = 0.2135, P = 0.6448). E, Social behavior in the co-housed WT-I and co-housed KO-I mice as assessed in the reciprocal social interaction test (n = 22 per group; co-housed WT-I vs co-housed KO-I: Mann-Whitney U = 192, P = 0.2456). F-G, Locomotor activity levels of the co-housed WT-I and co-housed KO-I mice as assessed in the habituation phase of the 3-chamber test (n = 31–32 per group; F, Distance traveled: co-housed WT-I vs co-housed KO-I: Mann-Whitney U = 307, P = 0.0089; G, Mean speed: co-housed WT-I vs co-housed KO-I: Mann-Whitney U = 303, P = 0.0074). H, Beta diversity of the 16S rRNA gene sequencing dataset from feces of co-housed WT-I and KO-I mice (n = 12–13 per group) as determined by principal components analysis (PCA) of PhILR-transformed Euclidean distances (PERMANOVA: R2 = 0.11351, P = 0.04459). I, Phylogenetic tree of ASVs detected in the 16S rRNA gene sequencing dataset with tree branch colors associated with the phylum of the ASV, the inner circle representing differences in ASV abundance between groups (sliding scale: green = higher in KO, white = no difference, purple = higher in WT), and the outer circle representing the significance level after Benjamini-Hochberg false discovery rate correction (white: not significant, P ≥ 0.05; black: significant, P < 0.05). See also Figure S2, and Table S1, S2.
Fig. 4.
Fig. 4.. Transgenerational separation of littermates leads to social deficits and alterations in microbiome composition but does not affect locomotor activity.
A-B, Schemes of the experimental design. C-D, Social behavior in WT-T and KO-T mice as assessed in the 3-chamber test (n = 24–27 per group; C, Sociability: WT-T: t = 7.182, P < 0.0001; KO-T: t = 5.364, P < 0.0001; two-way ANOVA: F1,98 = 0.1254, P = 0.1254; D, Social Novelty: WT-T: t = 4.398, P < 0.0001; KO-T: t = 0.7683, P = 0.8883; two-way ANOVA, F1,98 = 7.143, P = 0.0088). E, Social behavior in WT-T and KO-T mice as assessed in the reciprocal social interaction test, (n = 14–24 per group; WT-T vs KO-T: Mann-Whitney U = 30, P < 0.0001). F-G, Locomotor activity levels in WT-T and KO-T mice as assessed in the habituation phase of the 3-chamber test (n = 24–27 per group; F, Distance traveled: WT-T vs KO-T: Mann-Whitney U = 180, P = 0.0060; G, Mean speed: WT-T vs KO-T: Mann-Whitney U = 180.5, P = 0.0061). H, Beta diversity of the 16S rRNA gene sequencing dataset from feces of WT-T and KO-T mice (n = 15 per group) as determined by principal components analysis (PCA) of PhILR-transformed Euclidean (PERMANOVA: R2 = 0.44351, P = 0.0002). I, Phylogenetic tree of ASVs detected in the 16S rRNA gene sequencing dataset with tree branch colors associated with the phylum of the ASV, the inner circle representing differences in ASV abundance between groups (sliding scale: green = higher in KO, white = no difference, purple = higher in WT), and the outer circle representing the significance level after Benjamini-Hochberg false discovery rate correction (white: not significant, P ≥ 0.05; black: significant, P < 0.05). See also Figure S2, and Table S1, S2.
Fig. 5.
Fig. 5.. Microbiota transplantation confers the social behavior phenotype, but not activity phenotype, of the donor lines.
A, Scheme of experimental design for the FMT experiments. B-C, Social behavior in GF mice transplanted with microbiota from isolated and littermate lines as assessed in the 3-chamber test (n = 9–21 per group; B, Sociability: Conventionally Colonized: t = 8.51, P < 0.0001; GF: t = 0.572, P > 0.9999; GF:WT-I FMT: t = 6.557, P < 0.0001; GF:KO-I FMT: t = 0.05714, P > 0.9999; GF:WT-L FMT: t = 5.673, P < 0.0001; GF:KO-L FMT: t = 6.485, P < 0.0001; two-way ANOVA, F5,144 = 16.61, P < 0.0001; C, Social Novelty: Conventionally Colonized: t = 3.82, P = 0.0012; GF: t = 0.1557, P > 0.9999; GF:WT-I FMT: t = 4.564, P < 0.0001; GF:KO-I FMT: t = 0.1194, P > 0.9999; GF:WT-L FMT: t = 4.006, P = 0.0006; GF:KO-L FMT: t = 5.73, P < 0.0001; two-way ANOVA, F5,144 = 7.100, P < 0.0001). D-E, Locomotor activity levels in GF mice transplanted with microbiota from isolated and littermate lines as assessed in the habituation phase of the 3-chamber test (n = 10–22 per group; D, Distance traveled: Conventionally Colonized vs Non-colonized GF: t = 2.494, P = 0.2230; GF:WT-I vs GF:KO-I: t = 2.173, P = 0.4942; GF:WT-L vs GF:KO-L: t = 0.3335, P > 0.9999; one-way ANOVA: F5,74 = 2.529, p = 0.0361; E, Mean speed: Conventionally Colonized vs Non-colonized GF: t = 2.501, P = 0.2190; GF:WT-I vs GF:KO-I: t = 2.218, P = 0.4448; GF:WT-L vs GF:KO-L: t = 0.3367, P > 0.9999; one-way ANOVA: F5,74 = 2.559, P = 0.0343). See also Figure S3, and Table S1, S2.
Fig. 6.
Fig. 6.. L. reuteri rescues deficits in social behavior and related changes in synaptic transmission without altering locomotor activity levels in Cntnap2−/− mice.
A, Scheme of experimental design for the treatment with L. reuteri. B-C, Social behavior in L. reuteri treated mice as assessed in the 3-chamber test (n = 19–22 per group; B, Sociability: WT-I + Vehicle: t = 5.329, P < 0.0001; KO-I + Vehicle: t = 0.2167, P > 0.9999; KO-I + L. reuteri: t = 12.75, P < 0.0001; two-way ANOVA: F2,116 = 36.34, P < 0.0001; C, Social Novelty: WT-I + Vehicle: t = 6.228, P < 0.0001; KO-I + Vehicle: t = 1.241, P = 0.6516; KO-I + L. reuteri: t = 6.934, P < 0.0001; two-way ANOVA, F2,116 = 20.02, P < 0.0001). D-E, Locomotor activity levels in L. reuteri treated mice as assessed in the habituation phase of the 3-chamber test (n = 19–22 per group; D, Distance traveled: WT-I + Vehicle vs KO-I + Vehicle: t = 4.143, P = 0.0003; WT-I + Vehicle vs KO-I + L. reuteri: t = 3.935, P = 0.0007; KO-I + Vehicle vs KO-I + L. reuteri: t = 0.3565, P > 0.9999; one-way ANOVA, F2,58 = 10.86, P < 0.0001; E, Mean speed: WT + Vehicle vs KO-I + Vehicle: t = 3.646, P = 0.0017; WT + Vehicle vs KO-I + L. reuteri: t = 3.072, P = 0.0097; KO-I + Vehicle vs KO-I + L. reuteri: t = 0.6995, P > 0.9999; one-way ANOVA, F2,58 = 7.663, P = 0.0011). F, Scheme of experimental design for electrophysiological studies. G, Social behavior in L. reuteri treated mice as assessed in the reciprocal social interaction test (n = 16–28 pairs per group, WT-I + Vehicle vs KO-I + Vehicle: t = 6.490, P < 0.0001; WT-I + Vehicle vs KO-I + L. reuteri: t = 1.079, P = 0.8552; KO-I + Vehicle vs KO-I + L. reuteri: t = 7.707, P < 0.0001; one-way ANOVA, F2,57 = 37.53, P < 0.0001). H, Representative traces of AMPAR and NMDAR currents (top panel) and AMPAR/NMDAR ratio (bottom panel) in VTA DA neurons recorded at baseline and 24 hours after reciprocal social interaction (n = 6–14 per group; WT-I + Vehicle baseline vs WT-I + Vehicle social interaction: t = 3.462, P = 0.0203; KO-I + Vehicle baseline vs KO-I + Vehicle social interaction: t = 0.4072, p > 0.9999; KO-I + Vehicle baseline vs KO-I + L. reuteri baseline: t = 0.1927, P > 0.9999; KO-I + Vehicle baseline vs KO-I + vehicle cocaine: t = 3.773, P = 0.0075; KO-I + L. reuteri baseline vs KO-I + L. reuteri social interaction: t = 3.467, P = 0.0201; one-way ANOVA, F6,63 = 7.119, P < 0.0001). I, Representative traces of miniature excitatory post-synaptic currents (mEPSCs). J, mEPSCs amplitude (n = 7–9 per group; WT-I + vehicle vs KO-I + vehicle: t = 3.884, P = 0.0026; KO-I + vehicle vs KO-I + L. reuteri: t = 1.295, P = 0.6278; WT-I + vehicle vs KO-I + L. reuteri: t = 2.385, P = 0.0797; one-way ANOVA: F2,21 = 7.680, P = 0.0031) in WT-I, KO-I and KO-I treated with L. reuteri. K, mEPSCs frequency (n = 7–9 per group; WT-I + vehicle vs KO-I + vehicle: t = 3.802, P = 0.0031; KO-I + vehicle vs KO-I + L. reuteri: t = 0.9573, P > 0.9999; WT-I + vehicle vs KO-I + L. reuteri: t = 2.637, P = 0.0462; one-way ANOVA: F2,21 = 7.597, P = 0.0033) in WT-I, KO-I and KO-I treated with L. reuteri. See also Figure S4–S5.
Fig. 7:
Fig. 7:. L. reuteri selectively increases metabolites from the tetrahydrobiopterin (BH4) synthesis pathway and BH4 reverses the social deficits (but not locomotor activity levels) in Cntnap2−/− mice.
A, Heatmap of hierarchical clustering analysis of fecal metabolites in WT-I + Vehicle, KO-I + Vehicle and KO-I + L. reuteri-treated mice (n = 5–6 per group). Selective inference (SI) values (blue) show the stability of each edge (grey) in the tree. B, Top 30 most discriminatory fecal metabolites between social (WT-I + Vehicle and KO-I + L. reuteri) and non-social (KO-I + Vehicle) groups, identified by Random Forests classification (n = 5–6 per group). C-D, Levels of metabolites in BH4 synthesis pathway (n = 5–6 per group; C, biopterin: WT-I + Vehicle vs KO-I + Vehicle: t = 7.159, P < 0.0001; WT-I + Vehicle vs KO-I + L. reuteri: t = 0.6152, P > 0.9999; KO-I + Vehicle vs KO-I + L. reuteri: t = 6.211, P < 0.0001; one-way ANOVA, F2,14 = 30.69, P < 0.0001; D, dihydrobiopterin: WT-I + Vehicle vs KO-I + Vehicle: t = 10.34, P < 0.0001; WT-I + Vehicle vs KO-I + L. reuteri: t = 1.006, P = 0.9944; KO-I + Vehicle vs KO-I + L. reuteri: t = 8.852, P < 0.0001; one-way ANOVA, F2,14 = 63.40, P < 0.0001). E, Scheme of experimental design for BH4 treatment studies. F-G, Social behavior in BH4 treated mice as assessed in the 3-chamber test (n = 13–14 per group; F, Sociability: WT-I + Vehicle: t = 6.488, P < 0.0001; KO-I + Vehicle: t = 1.968, P = 0.1581; KO-I + BH4: t = 5.514, P < 0.0001; two-way ANOA: F2,76 = 5.205, P = 0.0076; G, Social Novelty: WT-I + Vehicle: t = 6.395, P < 0.0001; KO-I + Vehicle: t = 1.930, P = 0.1722; KO-I + BH4: t = 6.611, P < 0.0001; two-way ANOA, F2,76 = 6.434, P = 0.0026). H, Scheme of experimental design for electrophysiological studies. I, Social behavior in BH4 treated mice as assessed in the reciprocal social interaction test (n = 9–10 pairs per group, KO-I + Vehicle vs KO-I + BH4: Mann-Whitney U = 9, P = 0.0021). J, Representative traces of AMPAR and NMDAR currents (top panel) and AMPAR/NMDAR ratio (bottom panel) in VTA DA neurons recorded at baseline and 24 hours after reciprocal social interaction (n = 6–8 per group; KO-I + Vehicle baseline vs KO-I + Vehicle social interaction: t = 0.9717, P > 0.9999; KO-I + Vehicle baseline vs KO-I + BH4 baseline: t = 0.2975, P > 0.9999; KO-I + Vehicle social interaction vs KO-I + BH4 baseline: t = 0.7109, P > 0.9999; KO-I + BH4 baseline vs KO-I + BH4 social interaction: t = 4.322, P = 0.0015; one-way ANOVA, F3,23 = 9.125, P = 0.0004). K-L, Locomotor activity levels in BH4 treated mice as assessed in the habituation phase of the 3-chamber test (n = 13–14 per group; K, Distance traveled: WT-I + Vehicle vs KO-I + Vehicle: t = 4.763, P < 0.0001; WT-I + Vehicle vs KO-I + BH4: t = 6.833, P < 0.0001; KO-I + Vehicle vs KO-I + BH4: t = 1.943, P = 0.1784; one-way ANOVA, F2,38 = 24.66, P < 0.0001; L, Mean speed: WT + Vehicle vs KO-I + Vehicle: t = 4.827, P < 0.0001; WT + Vehicle vs KO-I + BH4: t = 6.853, P < 0.0001; KO-I + Vehicle vs KO-I + BH4: t = 1.898, P = 0.1961; one-way ANOVA, F2,38 = 24.90, P < 0.0001). See also Figure S6–S7.

Comment in

References

    1. American Psychiatric Association (2013). Diagnostic and statistical manual of mental disorders (DSM-5®) (American Psychiatric Pub; ).
    1. Ang QY, Alexander M, Newman JC, Tian Y, Cai J, Upadhyay V, Turnbaugh JA, Verdin E, Hall KD, Leibel RL, et al. (2020). Ketogenic Diets Alter the Gut Microbiome Resulting in Decreased Intestinal Th17 Cells. Cell 181, 1263–1275.e1216. - PMC - PubMed
    1. Bakkaloglu B, O’Roak BJ, Louvi A, Gupta AR, Abelson JF, Morgan TM, Chawarska K, Klin A, Ercan-Sencicek AG, Stillman AA, et al. (2008). Molecular Cytogenetic Analysis and Resequencing of Contactin Associated Protein-Like 2 in Autism Spectrum Disorders. The American Journal of Human Genetics 82, 165–173. - PMC - PubMed
    1. Barbera P, Kozlov AM, Czech L, Morel B, Darriba D, Flouri T, and Stamatakis A (2019). EPA-ng: Massively Parallel Evolutionary Placement of Genetic Sequences. Systematic Biology 68, 365–369. - PMC - PubMed
    1. Bariselli S, Hörnberg H, Prévost-Solié C, Musardo S, Hatstatt-Burklé L, Scheiffele P, and Bellone C (2018). Role of VTA dopamine neurons and neuroligin 3 in sociability traits related to nonfamiliar conspecific interaction. Nature Communications 9, 3173. - PMC - PubMed

Publication types

MeSH terms