. 2021 May 10;31(9):1903-1917.e6.
doi: 10.1016/j.cub.2021.02.015. Epub 2021 Mar 10.

Local accumulation of extracellular matrix regulates global morphogenetic patterning in the developing mammary gland

Affiliations

Local accumulation of extracellular matrix regulates global morphogenetic patterning in the developing mammary gland

Bryan A Nerger et al. Curr Biol. .

Abstract

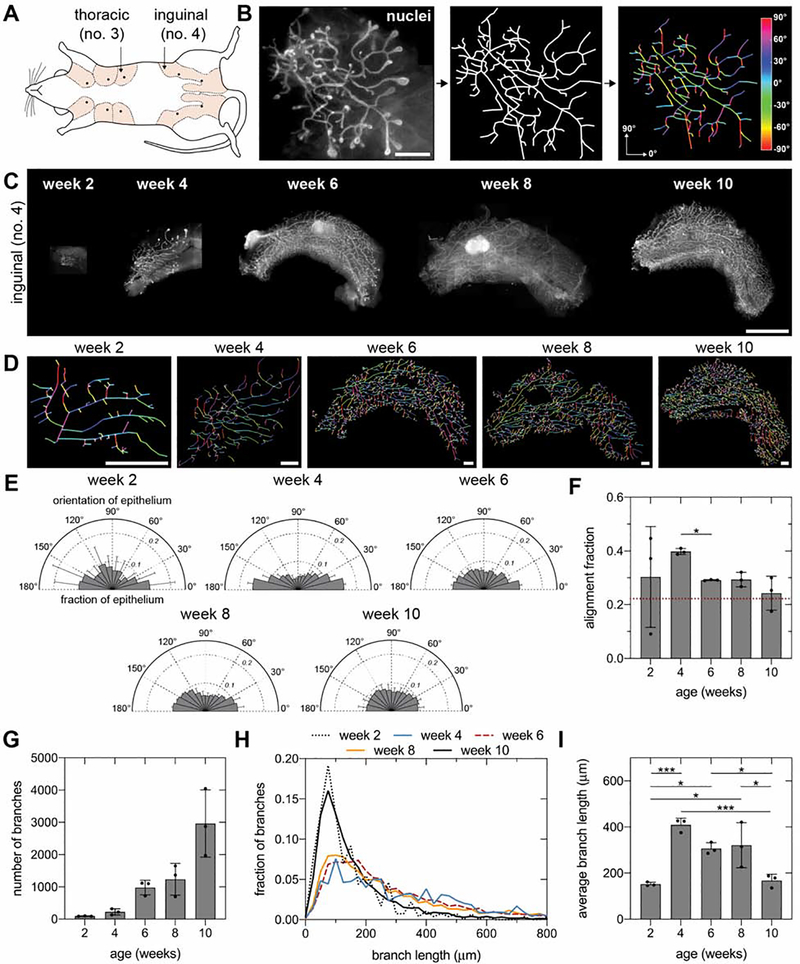
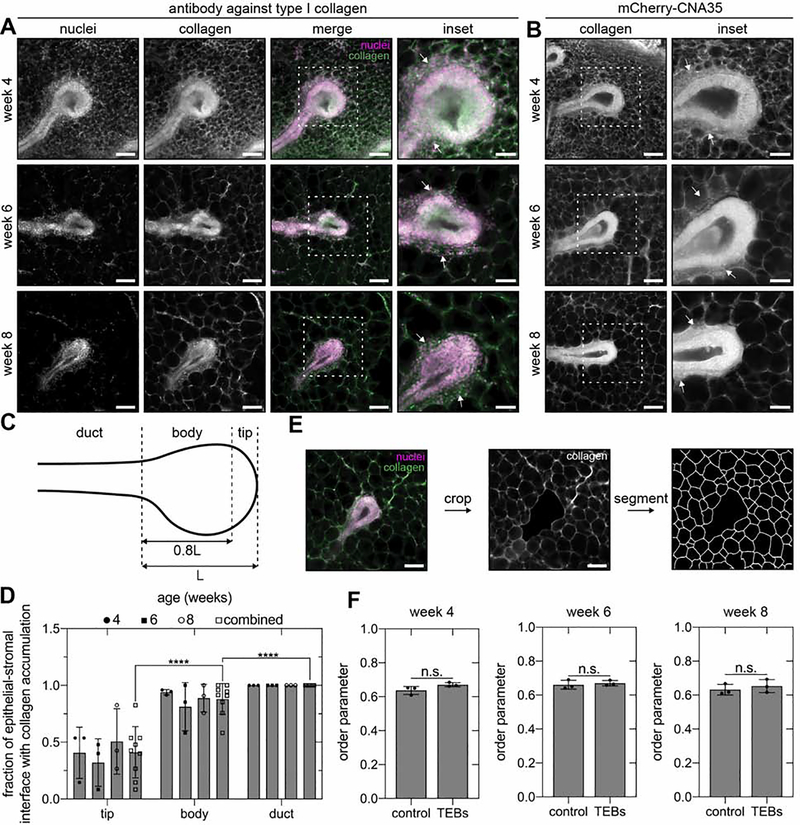
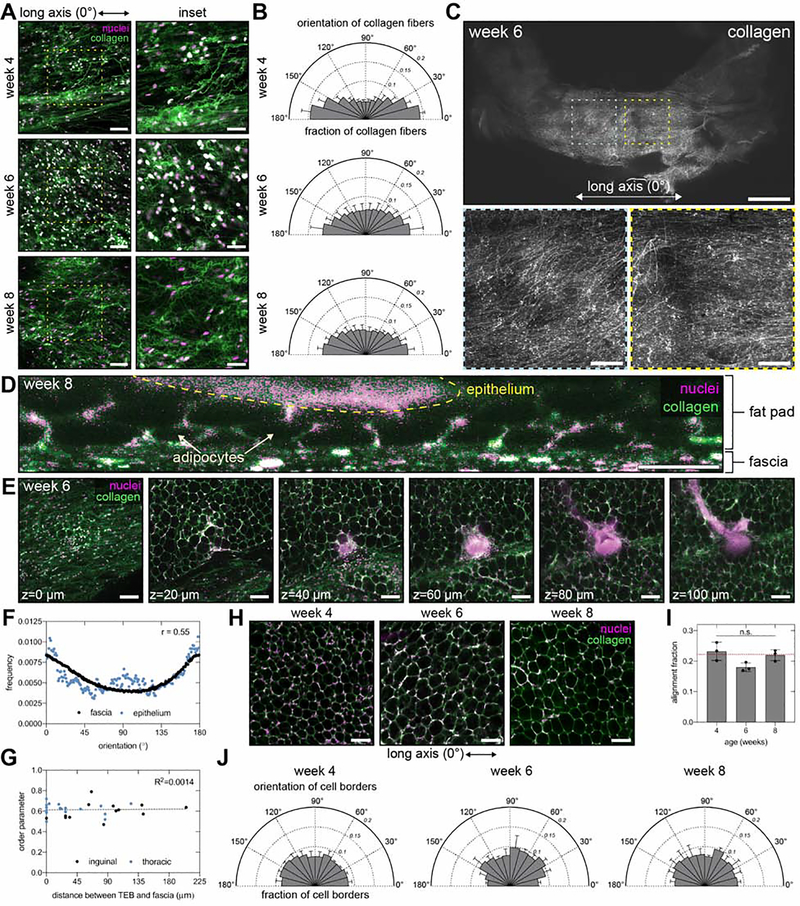
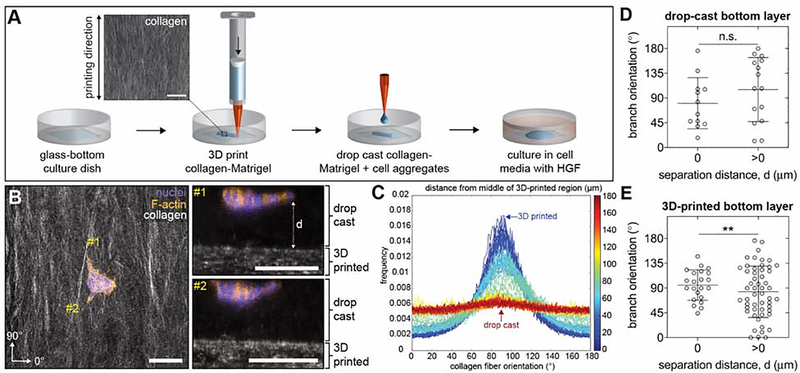
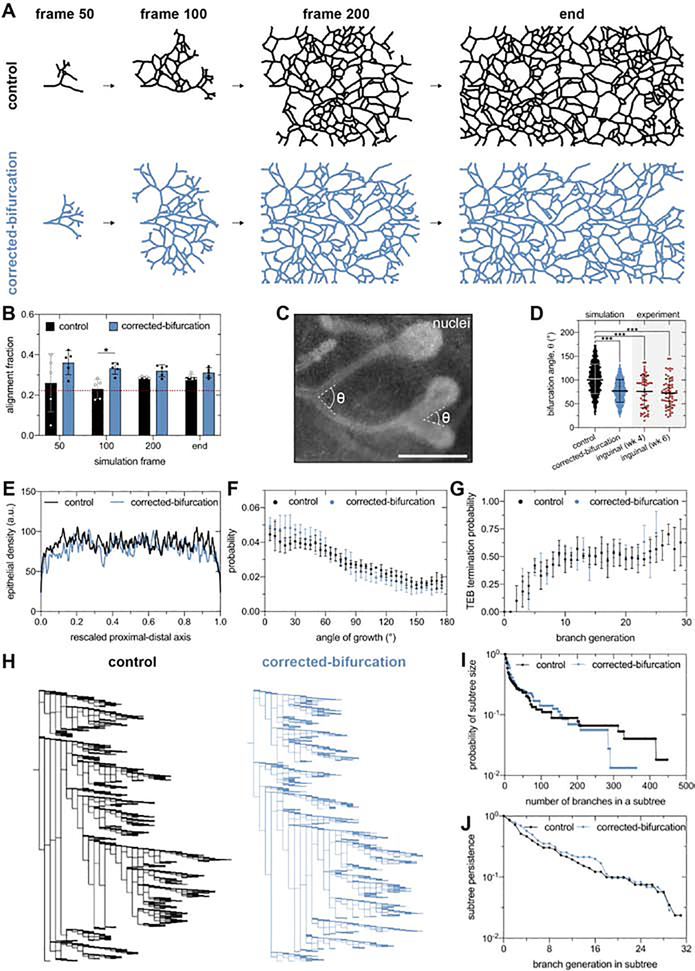
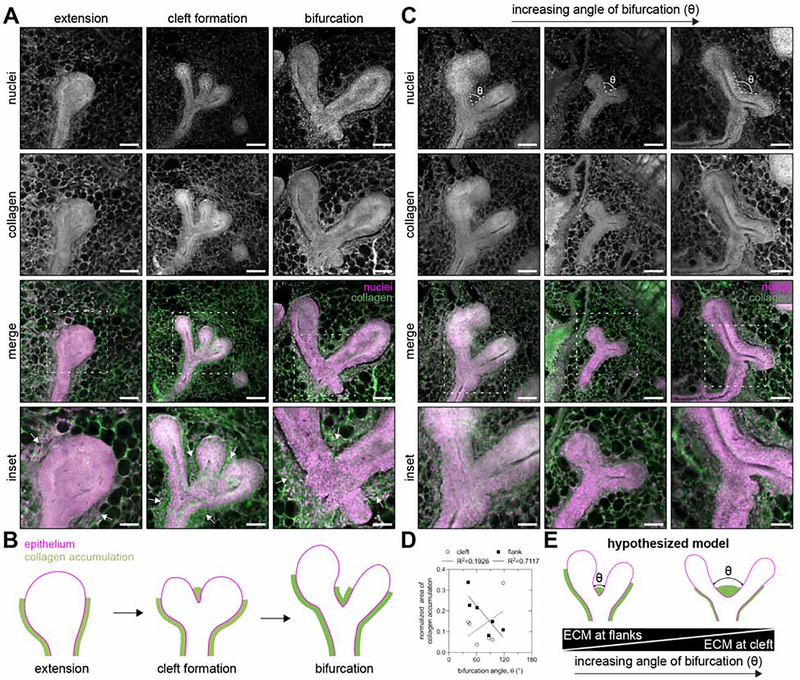
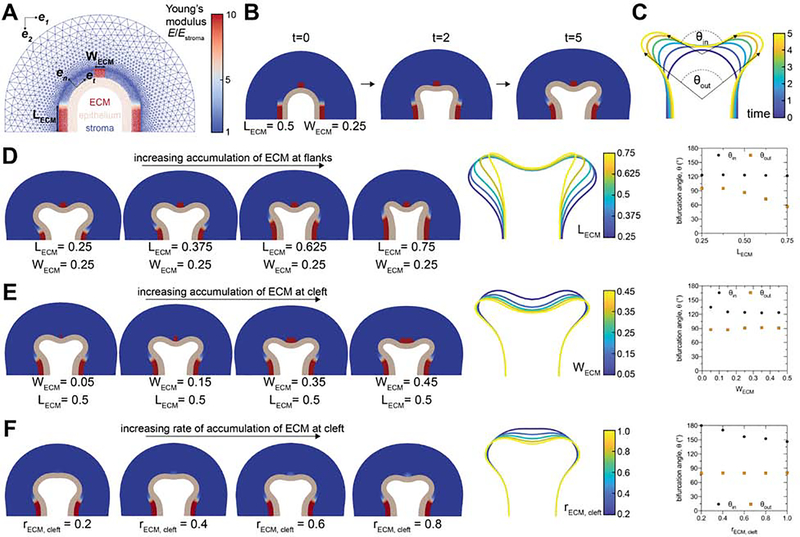
The tree-like pattern of the mammary epithelium is formed during puberty through a process known as branching morphogenesis. Although mammary epithelial branching is stochastic and generates an epithelial tree with a random pattern of branches, the global orientation of the developing epithelium is predictably biased along the long axis of the gland. Here, we combine analysis of pubertal mouse mammary glands, a three-dimensional (3D)-printed engineered tissue model, and computational models of morphogenesis to investigate the origin and the dynamics of the global bias in epithelial orientation during pubertal mammary development. Confocal microscopy analysis revealed that a global bias emerges in the absence of pre-aligned networks of type I collagen in the fat pad and is maintained throughout pubertal development until the widespread formation of lateral branches. Using branching and annihilating random walk simulations, we found that the angle of bifurcation of terminal end buds (TEBs) dictates both the dynamics and the extent of the global bias in epithelial orientation. Our experimental and computational data demonstrate that a local increase in stiffness from the accumulation of extracellular matrix, which constrains the angle of bifurcation of TEBs, is sufficient to pattern the global orientation of the developing mammary epithelium. These data reveal that local mechanical properties regulate the global pattern of mammary epithelial branching and may provide new insight into the global patterning of other branched epithelia.

Keywords: biofabrication; collective migration; finite element method; mechanical stress; mechanotransduction; morphodynamics; tissue engineering.


Conflict of interest statement

Declaration of interests The authors declare no competing interests.

Figures

Figure 1.
Figure 1.. A bias in epithelial orientation emerges along the long axis of 4-week-old inguinal mammary glands.
A) Schematic of mouse mammary glands (inspired by57). B) Representative fluorescent image of a mammary gland labeled with Hoechst 33342 (left; scale bar represents 1 mm), skeleton of epithelium (middle), and visualization of branch orientation (right). C) Representative fluorescent images of no. 4 inguinal mammary glands at different stages of pubertal development labeled with Hoechst 33342 (scale bar represents 5 mm) and D) corresponding skeletons (scale bars represent 1 mm). E) Orientation and F) alignment fraction of epithelium at different stages of pubertal development. The dashed red line represents the alignment fraction corresponding to an epithelium without an orientation bias. G) Number of epithelial branches, H) distribution of branch length, and I) average branch length at different stages of pubertal development. Data are represented as mean ± SD. *p ≤ 0.05 and ***p ≤ 0.001. See also Figure S1.
Figure 2.
Figure 2.. Type I collagen accumulates along the flanks of extending TEBs.
Representative fluorescent images of TEBs in 4-, 6-, and 8-week-old no. 4 inguinal mammary glands labeled with an A) antibody against type I collagen or B) the collagen-binding protein mCherry-CNA35. White arrows denote collagen accumulation. C) Schematic of the tip, body, and duct regions of a TEB and D) quantification of collagen accumulation in each region. E) Representative segmentation of adipocyte cell borders surrounding a TEB and F) order parameter describing the orientation of epithelial extension with respect to adipocyte packing in a randomly selected region of the fat pad (control) or around TEBs. Scale bars represent 100 μm or 50 μm for insets. Data are represented as mean ± SD. ****p ≤ 0.0001 and n.s., not significant. See also Figure S2.
Figure 3.
Figure 3.. Aligned networks of collagen are observed in the superficial fascia adjacent to the mammary gland.
A) Representative fluorescent images of fascia and B) orientation of collagen fibers in the fascia in 4-, 6-, and 8-week-old no. 4 inguinal mammary glands; n=5 replicates. Scale bars represent 100 μm or 50 μm for insets. C) Low-magnification fluorescent images of collagen in the fascia of a 6-week-old no. 4 inguinal mammary gland. Scale bars represent 2 mm (top) or 500 μm (insets). Representative fluorescent images of a D) cross-section (scale bar 50 μm) and E) different z slices (scale bar 100 μm) through a no. 4 inguinal mammary gland. F) Spearman correlation between global orientation of collagen fibers in the fascia and the mammary epithelium for the same gland; n=1 gland. G) Pearson correlation between the order parameter describing the local orientation of TEBs with respect to collagen fiber orientation in the fascia and the distance of separation between the fascia and the TEB; n=18 and 13 TEBs from thoracic and inguinal glands, respectively. H) Representative fluorescent images of adipocytes in the fat pad of no. 4 inguinal mammary glands. Scale bars represent 100 μm. I) Alignment fraction and J) orientation of adipocyte cell borders. For all fluorescent images in the figure, tissues are stained with Hoechst 33342 to label nuclei (magenta) and an antibody against type I collagen (green). Data are represented as mean ± SD. n.s., not significant. See also Figure S3.
Figure 4.
Figure 4.. Aligned networks of collagen fibers only influence branch orientation when in direct contact with mammary epithelial cell aggregates in culture.
A) Schematic depicting fabrication of the multilayered engineered tissue model using sequential 3D printing and drop casting. Scale bar represents 100 μm. B) Representative confocal microscopy images showing a mammary epithelial cell aggregate seeded within drop-cast collagen-Matrigel on top of 3D-printed collagen-Matrigel. Left image represents a maximum-intensity z-projection (scale bar represents 100 μm) and right images represent optical cross-sections along lines labeled #1 and #2 (scale bars represent 100 μm). C) Representative distribution of collagen fiber orientation throughout the z-axis of the engineered tissue model starting in the 3D-printed region and ending in the drop-cast region; n=1. D) Branch orientation in control engineered tissues that consist of mammary epithelial cell aggregates cultured within drop-cast collagen-Matrigel on top of a layer of drop-cast collagen-Matrigel; n=12 and 15 cell aggregates with a separation distance of 0 and >0, respectively. E) Branch orientation in mammary epithelial cell aggregates cultured within drop-cast collagen-Matrigel on top of 3D-printed collagen-Matrigel; n=22 and 53 cell aggregates with a separation distance of 0 and >0, respectively. Data are represented as mean ± SD. **p ≤ 0.01 and n.s., not significant. See also Figure S4.
Figure 5.
Figure 5.. The angle of bifurcation of TEBs dictates the global alignment of simulated mammary epithelium.
A) Representative control and corrected-bifurcation BARW simulations and B) corresponding quantification of alignment fraction as a function of simulation time. The dashed red line represents the alignment fraction corresponding to an epithelium without an orientation bias. C) Representative bifurcation angles measured from a fluorescent image of a bifurcating mammary epithelium labeled with Hoechst 33342. Scale bar represents 500 μm. D) Distribution of bifurcation angles quantified in control and corrected-bifurcation simulations and 4- and 6-week-old inguinal mammary glands; n=54 and 65 measurements for 4- and 6-week-old glands, respectively. Quantification of E) epithelial density, F) angle of growth probability, and G) TEB annihilation probability for control and corrected-bifurcation BARW simulations. H) Representative lineage tree for control and corrected-bifurcation BARW simulations as well as quantification of I) subtree size and J) subtree persistence. Data are represented as mean ± SD in panels b, d, f, and g or as the mean in panels e, i, and j. *p ≤ 0.05 and ***p ≤ 0.001. See also Figure S5.
Figure 6.
Figure 6.. Collagen-rich ECM is deposited along the flanks and at the cleft site of bifurcating TEBs.
A) Representative fluorescent images of 150-μm-thick sections of TEBs during extension, cleft formation, and bifurcation and B) corresponding schematic of the pattern of collagen accumulation. C) Representative fluorescent images of 150-μm-thick sections of bifurcating TEBs with different angles of bifurcation. D) Area of collagen accumulation along the flanks and at the cleft site as a function of the angle of bifurcation; n=6 bifurcations. E) Schematic of hypothesized model in which the local extent of collagen accumulation regulates the angle of TEB bifurcation. Tissues are stained with Hoechst 33342 to label nuclei (magenta) and an antibody against type I collagen (green). Scale bars represent 100 μm or 50 μm for insets.
Figure 7.
Figure 7.. Local accumulation of stiff ECM constrains the angle of bifurcation of simulated TEBs.
A) Geometry and mesh of FEM-based model of bifurcating TEB. B) Different time steps during a simulated bifurcation of a TEB. C) Traces of the epithelial geometry as a function of simulation time. The final time point of simulations, traces of the final epithelial geometry, and bifurcation angles for simulations with D) varying ECM accumulation on the flanks of the TEB, E) varying ECM accumulation at the leading edge of the TEB, and F) varying rates of ECM accumulation at the leading edge of the TEB. See also Figure S6 and Videos S1–S8.

References

    1. Sternlicht MD (2005). Key stages in mammary gland development: The cues that regulate ductal branching morphogenesis. Breast Cancer Res 8, 201. - PMC - PubMed
    1. Metzger RJ, Klein OD, Martin GR, and Krasnow MA (2008). The branching programme of mouse lung development. Nature 453, 745–750. - PMC - PubMed
    1. Daniel CW, Robinson S, and Silberstein GB (1996). The role of TGF-β in patterning and growth of the mammary ductal tree. J. Mammary Gland Biol. Neoplasia 1, 331–341. - PubMed
    1. Brownfield DG, Venugopalan G, Lo A, Mori H, Tanner K, Fletcher DA, and Bissell MJ (2013). Patterned Collagen Fibers Orient Branching Mammary Epithelium through Distinct Signaling Modules. Curr. Biol 23, 703–709. - PMC - PubMed
    1. Gjorevski N, and Nelson CM (2011). Integrated morphodynamic signalling of the mammary gland. Nat. Rev. Mol. Cell Biol 12, 581–593. - PubMed

Publication types

LinkOut - more resources