. 2021 Jun;99(6):1392-1407.
doi: 10.1016/j.kint.2021.01.028. Epub 2021 Mar 9.

The genetic background significantly impacts the severity of kidney cystic disease in the Pkd1RC/RC mouse model of autosomal dominant polycystic kidney disease

Affiliations

The genetic background significantly impacts the severity of kidney cystic disease in the Pkd1RC/RC mouse model of autosomal dominant polycystic kidney disease

Jennifer Arroyo et al. Kidney Int. 2021 Jun.

Abstract

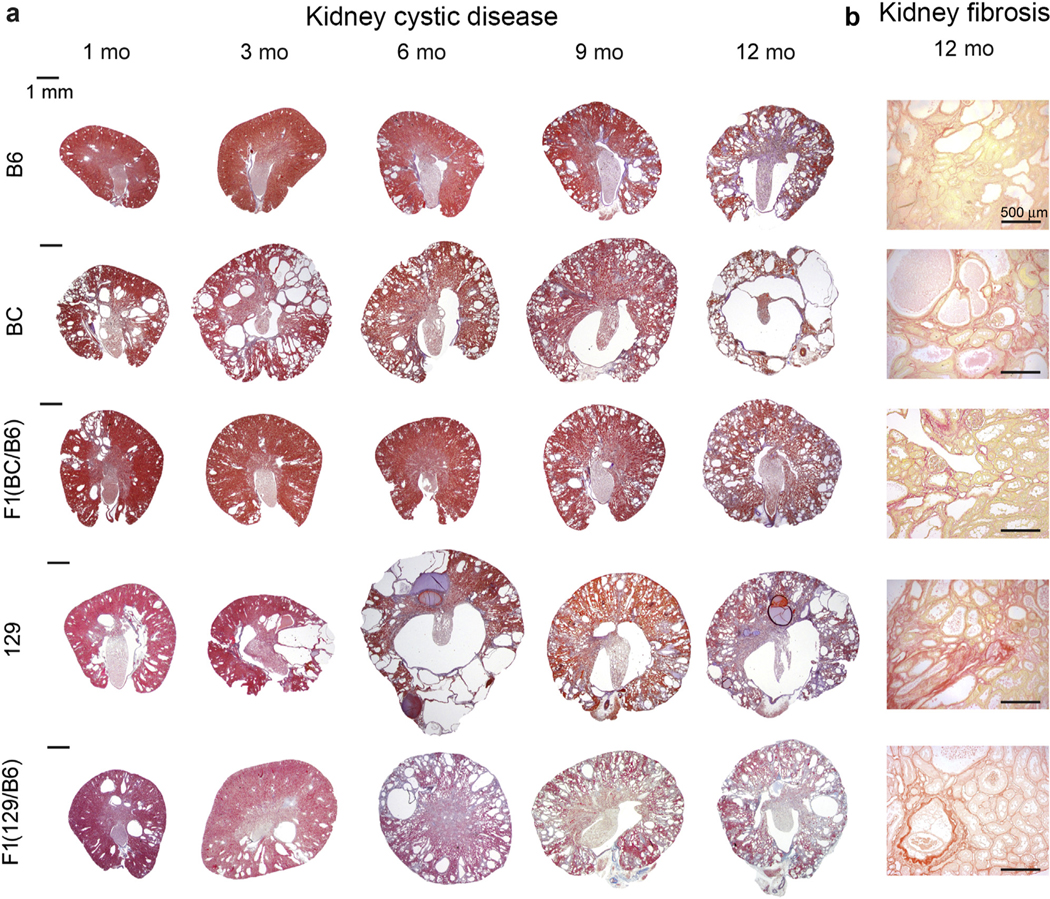
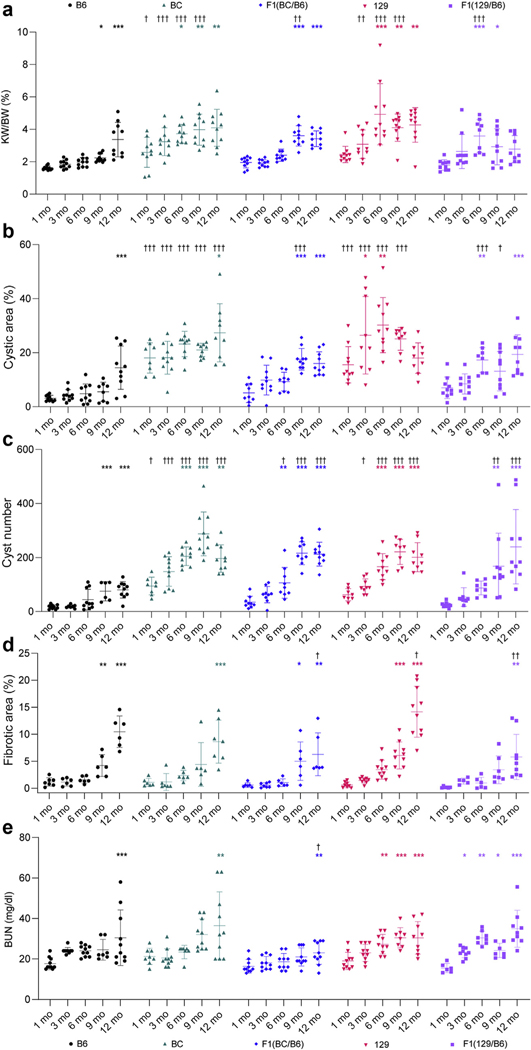
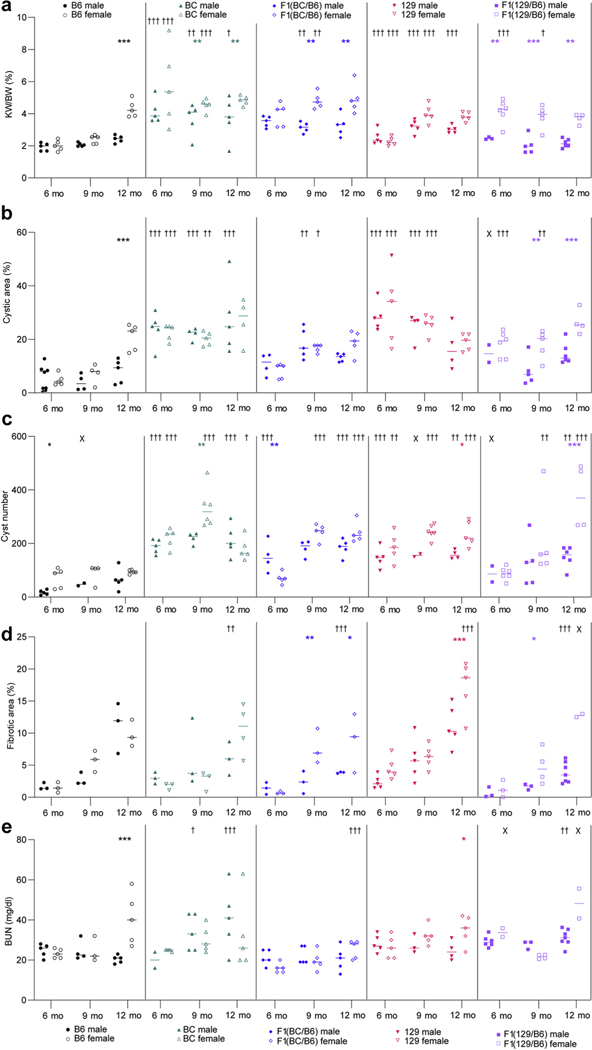
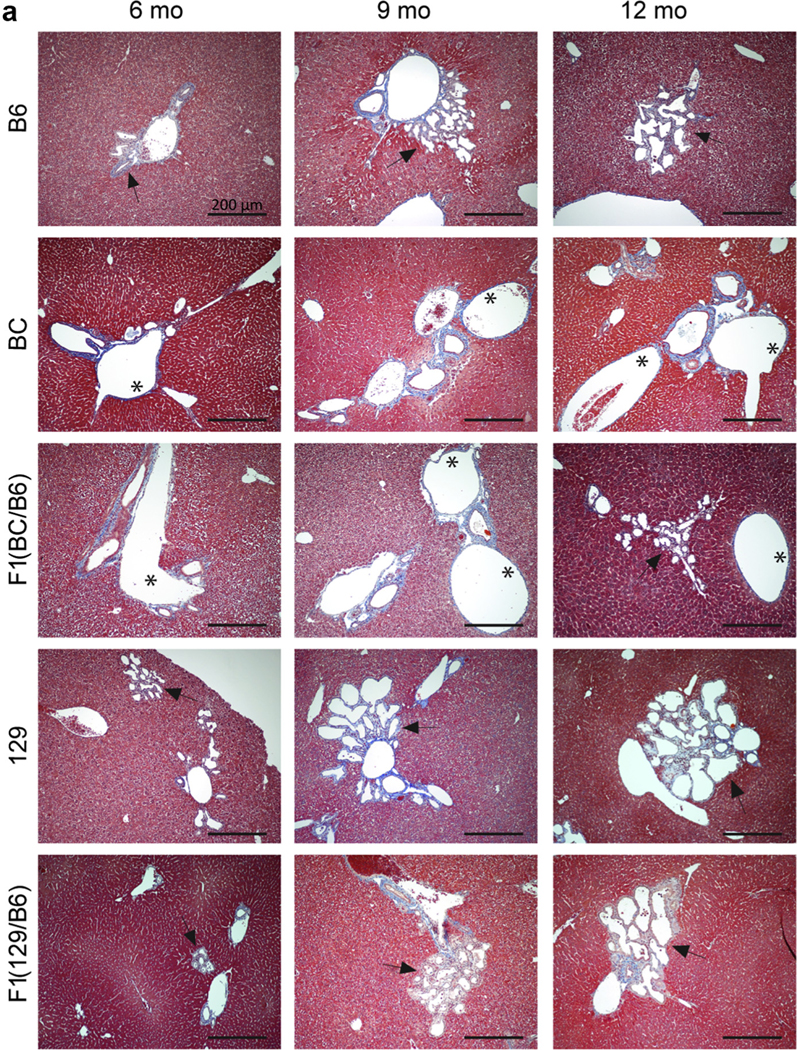
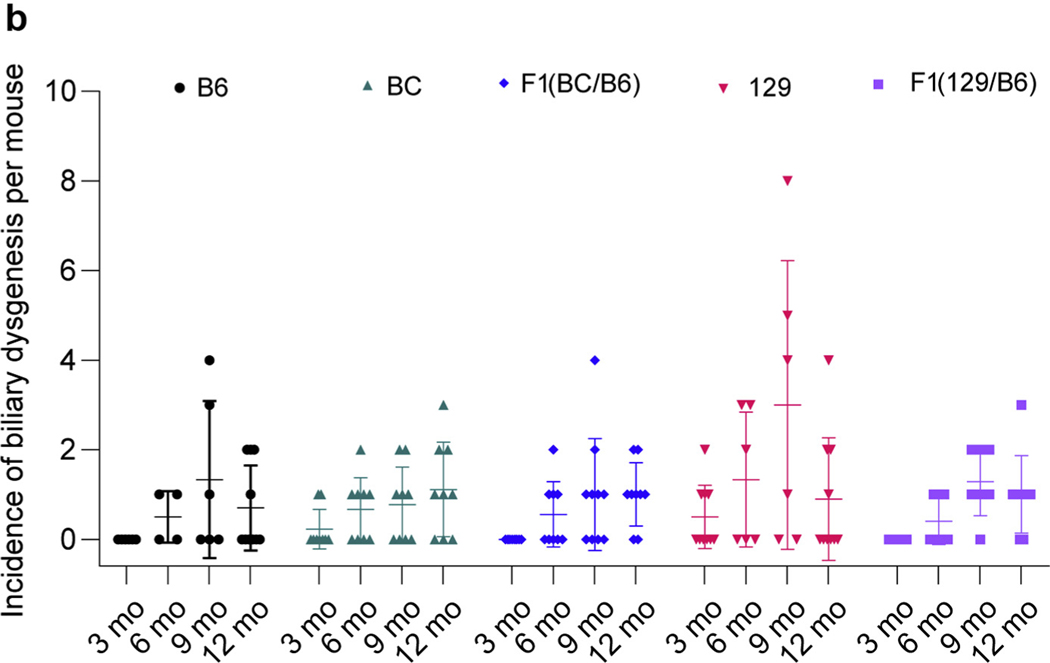
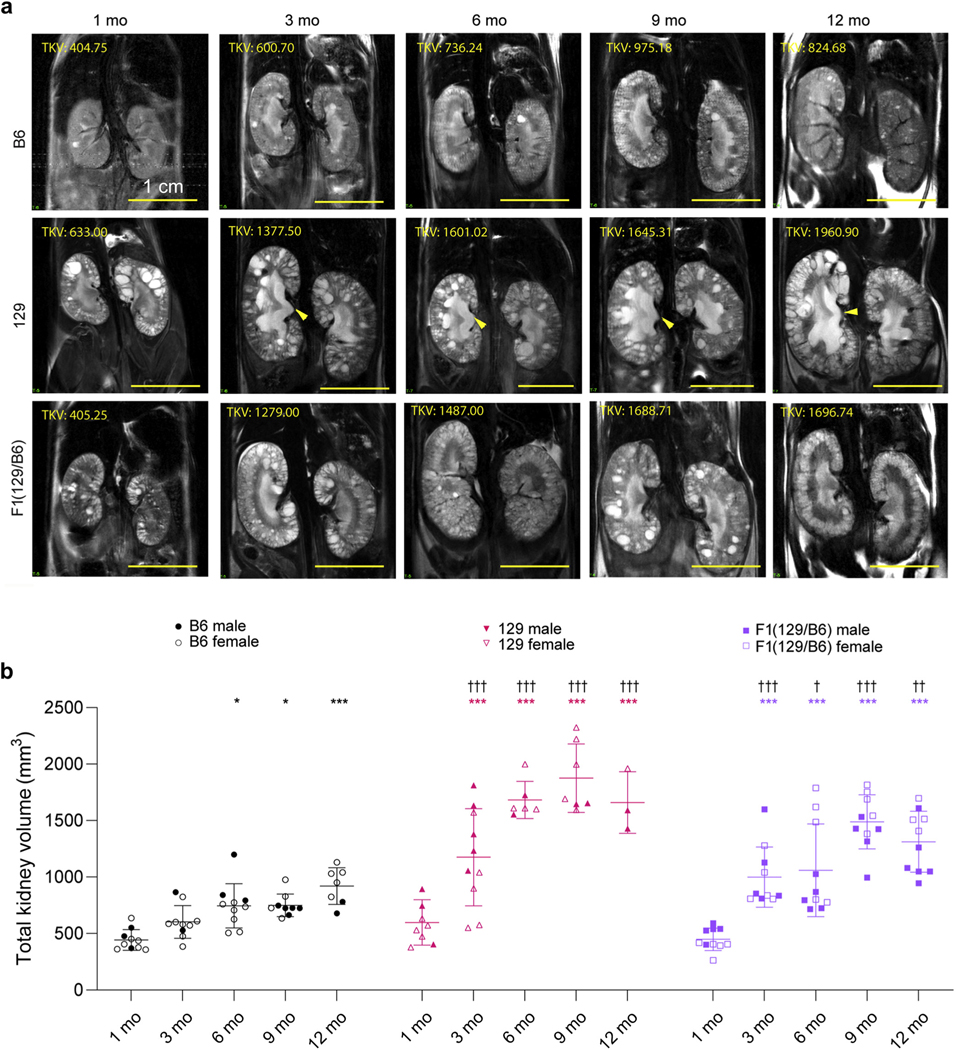
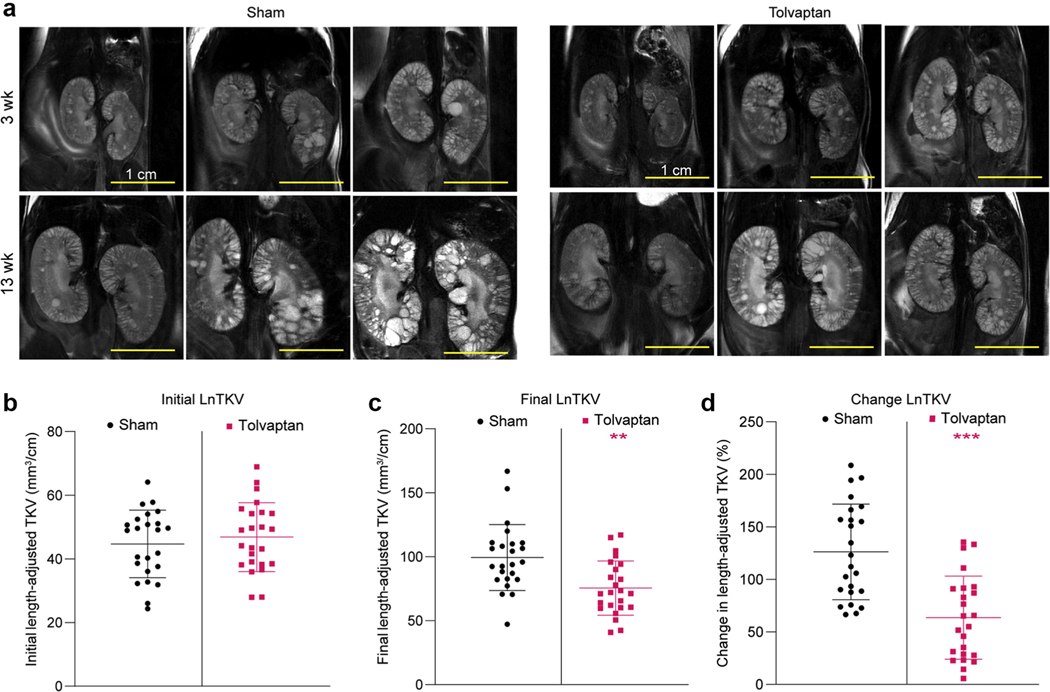
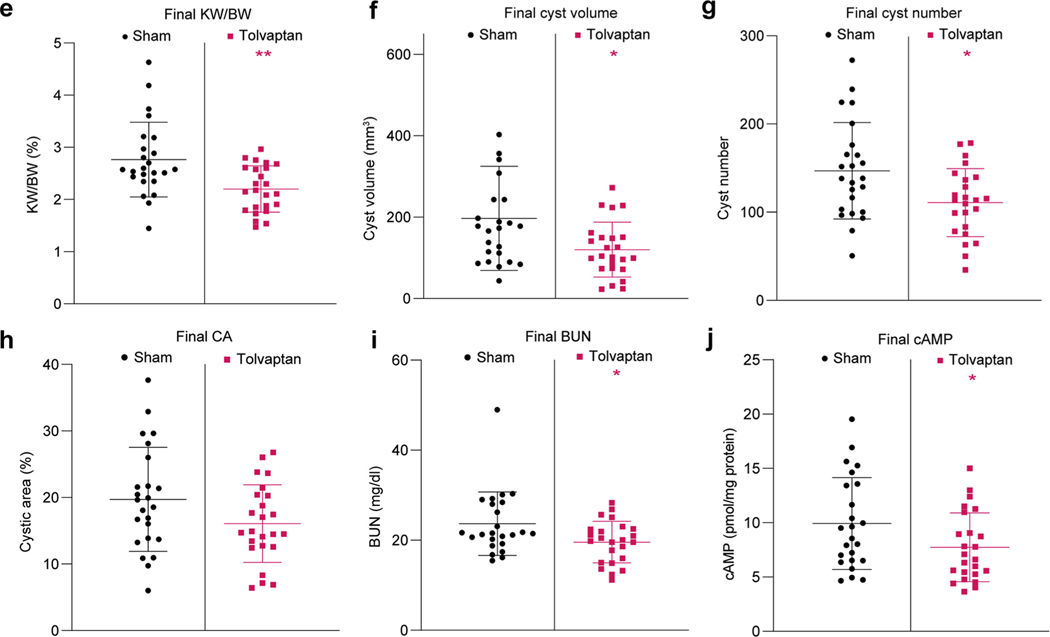
Autosomal dominant polycystic kidney disease (ADPKD), primarily due to PKD1 or PKD2 mutations, causes progressive kidney cyst development and kidney failure. There is significant intrafamilial variability likely due to the genetic background and environmental/lifestyle factors; variability that can be modeled in PKD mice. Here, we characterized mice homozygous for the PKD1 hypomorphic allele, p.Arg3277Cys (Pkd1RC/RC), inbred into the BALB/cJ (BC) or the 129S6/SvEvTac (129) strains, plus F1 progeny bred with the previously characterized C57BL/6J (B6) model; F1(BC/B6) or F1(129/B6). By one-month cystic disease in both the BC and 129 Pkd1RC/RC mice was more severe than in B6 and continued with more rapid progression to six to nine months. Thereafter, the expansive disease stage plateaued/declined, coinciding with increased fibrosis and a clear decline in kidney function. Greater severity correlated with more inter-animal and inter-kidney disease variability, especially in the 129-line. Both F1 combinations had intermediate disease severity, more similar to B6 but progressive from one-month of age. Mild biliary dysgenesis, and an early switch from proximal tubule to collecting duct cysts, was seen in all backgrounds. Preclinical testing with a positive control, tolvaptan, employed the F1(129/B6)-Pkd1RC/RC line, which has moderately progressive disease and limited isogenic variability. Magnetic resonance imaging was utilized to randomize animals and provide total kidney volume endpoints; complementing more traditional data. Thus, we show how genetic background can tailor the Pkd1RC/RC model to address different aspects of pathogenesis and disease modification, and describe a possible standardized protocol for preclinical testing.

Keywords: ADPKD; PKD1; animal models; disease modifiers; preclinical testing.


Figures

Figure 1|
Figure 1|. Cystic kidney disease progression differs in Pkd1RC/RC mice in various genetic backgrounds.
(a) Masson’s trichrome–stained kidney sections of mice at 1, 3, 6, 9, and 12 months of age showing the varying cystic disease progression between the lines. Bars = 1 mm. (b) Kidney sections of 12-month mice stained with picrosirius red illustrating fibrosis in the different lines. Bars = 500 μm. B6, C57BL/6J; BC, BALB/cJ; 129, 129S6/SvEvTac. To optimize viewing of this image, please see the online version of this article at www.kidney-international.org.
Figure 2 |
Figure 2 |. Characterization of the different rates of cystic kidney disease progression in Pkd1RC/RC mice in various genetic backgrounds.
(a) Percent kidney weight/body weight (KW/BW), (b) percent cystic area, (c) cyst number, (d) percent fibrotic area, and (e) blood urea nitrogen (BUN) were determined in mice from each background that were killed at 1, 3, 6, 9, and 12 months (see Table 1 for group sizes). The mean ± SD are shown on each scatter plot. Change in cystic disease within each background compared to the 1-month baseline was performed using a 1-way analysis of variance (ANOVA) followed by Dunnett’s multiple comparison test within each genetic background: *P < 0.05, **P < 0.01, ***P < 0.001. In addition, each time point in each background was compared to corresponding B6 mice to determine differences in cystic disease by using a 2-way ANOVA followed by Dunnett’s multiple comparison test: P < 0.05, ††P < 0.01, †††P < 0.001. Where possible, the same animals were measured for each endpoint but not all groups had equal numbers of male and female mice (Table 1; see Figure 3 and Supplementary Tables S1 and S2 for sex-specific data). B6, C57BL/6J; BC, BALB/cJ; 129, 129S6/SvEvTac.
Figure 3 |
Figure 3 |. Background contributes to sex effects on cystic kidney disease progression.
(a) Percent kidney weight/body weight (KW/BW), (b) percent cystic area, (c) cyst number, (d) percent fibrotic area, and (e) blood urea nitrogen (BUN) were determined for male and female mice from each background that were killed at 6, 9, and 12 months (see Table 1 for numbers of male and female mice for each endpoint). Two-way analysis of variance (ANOVA) followed by Bonferroni’s multiple comparison test was performed between male and female groups for age-matched mice of each genetic background: *P < 0.05, **P < 0.01, ***P < 0.001. Each time point in each background was also compared to corresponding B6 mice to determine differences per sex in cystic disease by using a 2-way ANOVA followed by Dunnett’s multiple comparison test: P < 0.05, ††P < 0.01, †††P < 0.001 (see Supplementary Table S1 for details of younger animals). Statistical analysis was performed only on groups that contained N ≥ 3, and groups not analyzed are marked with X. B6, C57BL/6J; BC, BALB/cJ; 129, 129S6/SvEvTac.
Figure 4 |
Figure 4 |. Characterization of the liver phenotypes in Pkd1RC/RC mice observed in different backgrounds.
(a) Masson’s trichrome–stained liver sections of mice at 6, 9, and 12 months of age showing the biliary abnormalities in various lines. Asterisks indicate dilated bile ducts, and arrows indicate bile duct proliferation. Bar = 200 μm. (b) Incidence of biliary dysgenesis per animal in each background at 3, 6, 9, and 12 months. There was no evidence of biliary dysgenesis in any background at 1 month. Liver dysgenesis at each time point and background was compared to corresponding B6 mice by using a 2-way analysis of variance followed by Dunnett’s multiple comparison test, but no statistical significance was evident. B6, C57BL/6J; BC, BalbC/cJ; 129, 129S6/SvEvTac. To optimize viewing of this image, please see the online version of this article at www.kidney-international.org.
Figure 5 |
Figure 5 |. Magnetic resonance (MR) imaging of the kidney from live Pkd1RC/RC mice in different backgrounds from 1 to 12 months.
(a) Representative kidney coronal sections in C57BL/6J (B6), 129S6/SvEvTac (129), and F1(129/B6) Pkd1RC/RC mice at 1, 3, 6, 9, and 12 months. Note that different animals were imaged at each time point. The arrow indicates urine retention, and total kidney volume (TKV, in cubic millimeters) is shown. Bars = 1 cm. (b) Quantification of TKVs from MR images. Significance of the difference within each background compared to 1 month baseline was determined using a 1-way analysis of variance (ANOVA) followed by Dunnett’s multiple comparison test: *P < 0.05, **P < 0.01, ***P < 0.001. Significance of the TKV difference from age-matched B6 mice was determined using a 2-way ANOVA followed by Dunnett’s multiple comparison test: P < 0.05, ††P < 0.01, †††P < 0.001. Statistical analysis was performed only on groups that contained N ≥ 3. To optimize viewing of this image, please see the online version of this article at www.kidney-international.org.
Figure 6 |
Figure 6 |. Preclinical testing of tolvaptan in F1(129/B6) Pkd1RC/RC mice.
(a) Magnetic resonance images at the start (3 weeks) and end (13 weeks) of the study in the sham and tolvaptan-treated groups (same animals at both time points). Bars = 1 cm. (b) Initial total kidney volume (TKV) adjusted for animal length (LnTKV) (3 weeks) in the sham and tolvaptan-treated groups. Corresponding final data (13 weeks) for the endpoints: (c) LnTKV, (d) percent change in LnTKV, (e) percent kidney weight/body weight (KW/BW), (f) cyst volume, (g) cyst number, (h) percent cystic area, (i) blood urea nitrogen (BUN), and (j) cyclic adenosine monophosphate (cAMP) for the sham and tolvaptan-treated groups (see also Supplementary Table S3). Significant difference between the sham and tolvaptan-treated groups was determined using an unpaired t test: *P < 0.05, **P < 0.01, ***P < 0.001. B6, C57BL/6J; 129, 129S6/SvEvTac. To optimize viewing of this image, please see the online version of this article at www.kidney-international.org.

References

    1. Iglesias CG, Torres VE, Offord KP, et al. Epidemiology of adult polycystic kidney disease, Olmsted County, Minnesota. Am J Kidney Dis. 1983;2:630–639. - PubMed
    1. Dalgaard OZ. Bilateral polycystic disease of the kidneys: a follow-up of two hundred and eighty-four patients and their families. Acta Med Scand. 1957;328(suppl):1–255. - PubMed
    1. Suwabe T, Shukoor S, Chamberlain AM, et al. Epidemiology of autosomal dominant polycystic kidney disease in Olmsted County. Clin J Am Soc Nephrol. 2020;15:69–79. - PMC - PubMed
    1. Reule S, Sexton DJ, Solid CA, et al. ESRD from autosomal dominant polycystic kidney disease in the United States, 2001–2010. Am J Kidney Dis. 2014;64:592–599. - PMC - PubMed
    1. United States Renal Data System. 2018 USRDS Annual Data Report: Epidemiology of kidney disease in the United States. Bethesda, MD: National Institutes of Health, National Institute of Diabetes and Digestive and Kidney Diseases; 2018. Available at: https://adr.usrds.org/. Accessed September 1, 2020.

Publication types

Substances

LinkOut - more resources