

Cardiovascular magnetic resonance stress and rest T1-mapping using regadenoson for detection of ischemic heart disease compared to healthy controls
- PMID: 33705843
- PMCID: PMC8117972
- DOI: 10.1016/j.ijcard.2021.03.010
Cardiovascular magnetic resonance stress and rest T1-mapping using regadenoson for detection of ischemic heart disease compared to healthy controls
Abstract
Background: Adenosine stress T1-mapping on cardiovascular magnetic resonance (CMR) can differentiate between normal, ischemic, infarcted, and remote myocardial tissue classes without the need for contrast agents. Regadenoson, a selective coronary vasodilator, is often used in stress perfusion imaging when adenosine is contra-indicated, and has advantages in ease of administration, safety profile, and clinical workflow. We aimed to characterize the regadenoson stress T1-mapping response in healthy individuals, and to investigate its ability to differentiate between myocardial tissue classes in patients with coronary artery disease (CAD).
Methods: Eleven healthy controls and 25 patients with CAD underwent regadenoson stress perfusion CMR, as well as rest and stress ShMOLLI T1-mapping. Native T1 values and stress T1 reactivity were derived for normal myocardium in healthy controls and for different myocardial tissue classes in patients with CAD.
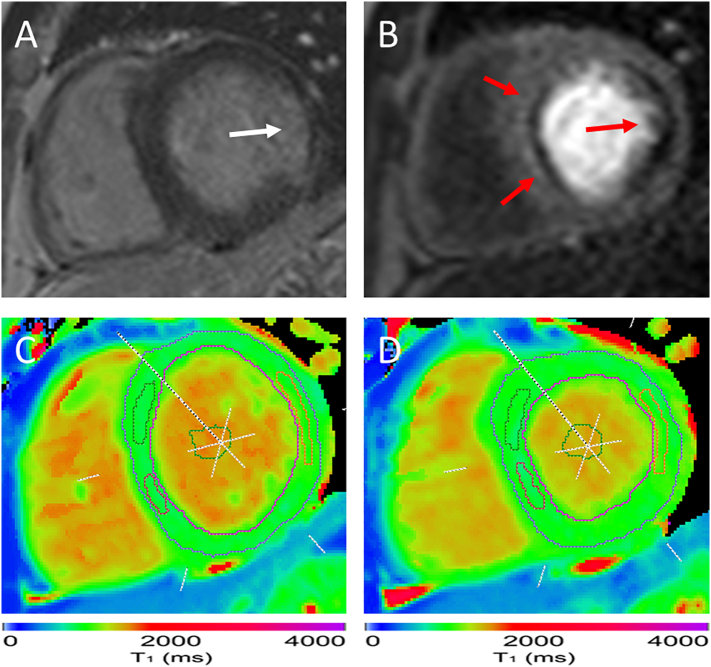
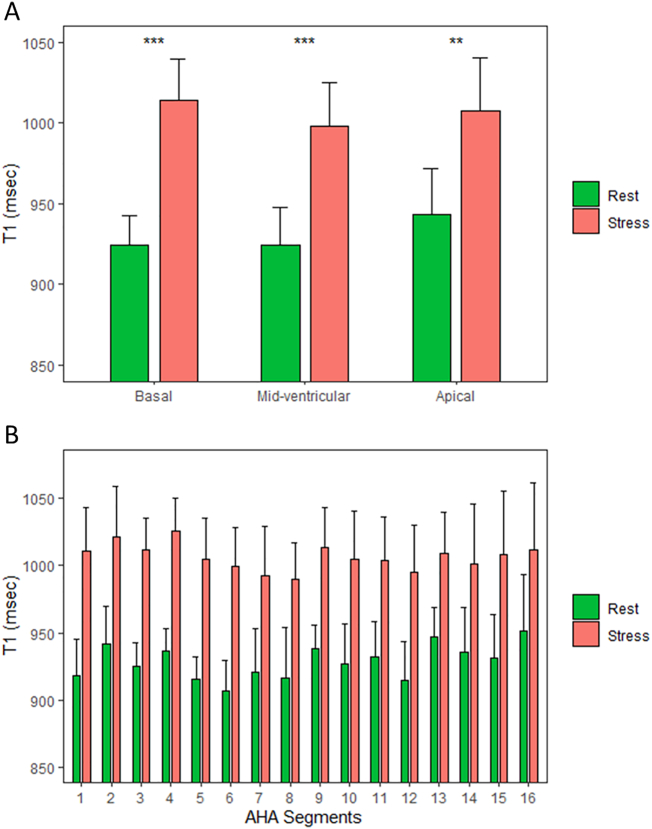
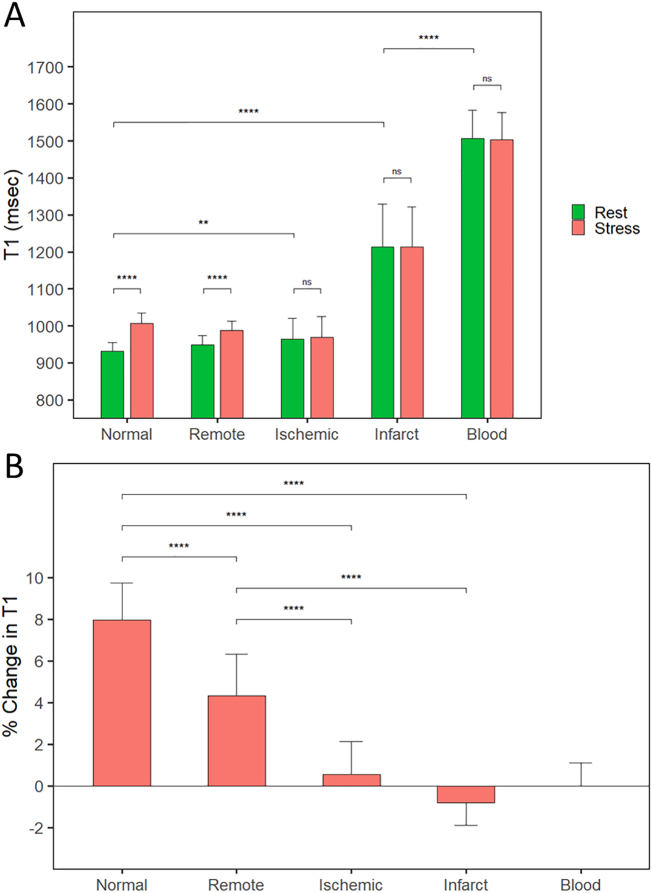
Results: Healthy controls had normal myocardial native T1 values at rest (931 ± 22 ms) with significant global regadenoson stress T1 reactivity (δT1 = 8.2 ± 0.8% relative to baseline; p < 0.0001). Infarcted myocardium had significantly higher resting T1 (1215 ± 115 ms) than ischemic, remote, and normal myocardium (all p < 0.0001) with an abolished stress T1 response (δT1 = -0.8% [IQR: -1.9-0.5]). Ischemic myocardium had elevated resting T1 compared to normal (964 ± 57 ms; p < 0.01) with an abolished stress T1 response (δT1 = 0.5 ± 1.6%). Remote myocardium in patients had comparable resting T1 to normal (949 ms [IQR: 915-973]; p = 0.06) with blunted stress reactivity (δT1 = 4.3% [IQR: 3.1-6.3]; p < 0.0001).
Conclusions: Healthy controls demonstrate significant stress T1 reactivity during regadenoson stress. Regadenoson stress and rest T1-mapping is a viable alternative to adenosine and exercise for the assessment of CAD and can distinguish between normal, ischemic, infarcted, and remote myocardium.
Keywords: Cardiovascular magnetic resonance; Coronary artery disease; Regadenoson; ShMOLLI; T1-mapping.
Copyright © 2021 The Authors. Published by Elsevier B.V. All rights reserved.
Figures
Comment in
-
Cardiac magnetic resonance stress and rest perfusion with T1 mapping: Is it ready to assess for ischaemic heart disease?Int J Cardiol. 2021 Jul 15;335:137-138. doi: 10.1016/j.ijcard.2021.04.014. Epub 2021 Apr 13. Int J Cardiol. 2021. PMID: 33845080 No abstract available.
References
-
- Rieber J., Huber A., Erhard I. Cardiac magnetic resonance perfusion imaging for the functional assessment of coronary artery disease: a comparison with coronary angiography and fractional flow reserve. Eur. Heart J. 2006;27(12):1465–1471. - PubMed
-
- Nagel E., Greenwood J.P., McCann G.P. Magnetic resonance perfusion or fractional flow reserve in coronary disease. N. Engl. J. Med. 2019;380(25):2418–2428. - PubMed
-
- Le D.E., Bin J.P., Coggins M.P. Relation between myocardial oxygen consumption and myocardial blood volume: a study using myocardial contrast echocardiography. J. Am. Soc. Echocardiogr. 2002;15(9):857–863. - PubMed
MeSH terms
Substances
Grants and funding
LinkOut - more resources
Full Text Sources
Other Literature Sources
Miscellaneous
