

Evaluation of a Next-Generation Sequencing Metagenomics Assay to Detect and Quantify DNA Viruses in Plasma from Transplant Recipients
- PMID: 33706010
- PMCID: PMC8279015
- DOI: 10.1016/j.jmoldx.2021.02.008
Evaluation of a Next-Generation Sequencing Metagenomics Assay to Detect and Quantify DNA Viruses in Plasma from Transplant Recipients
Abstract
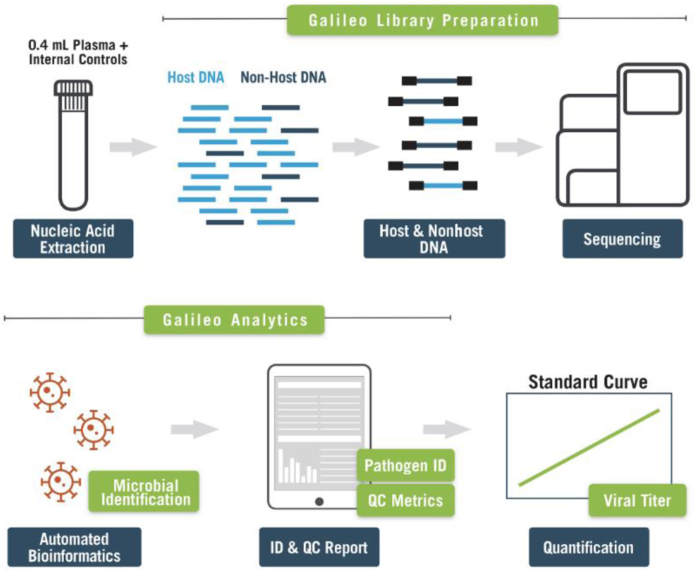
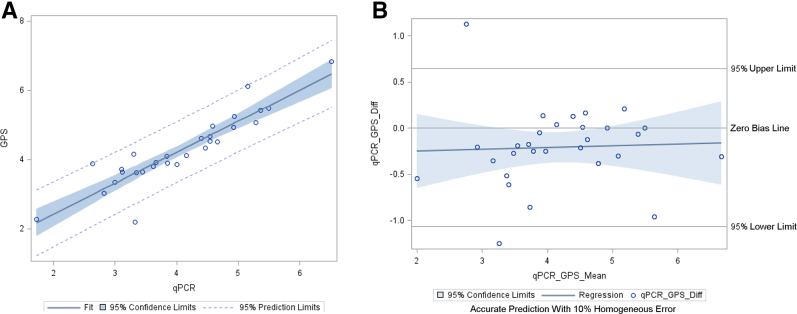
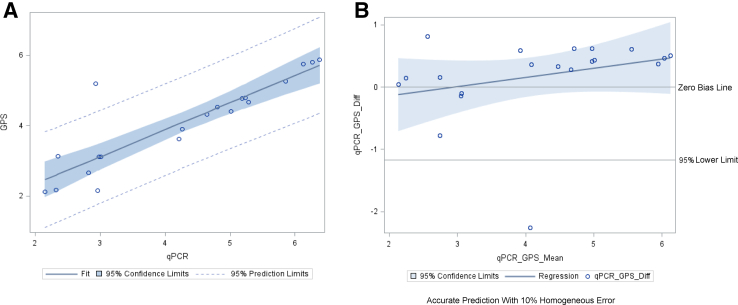
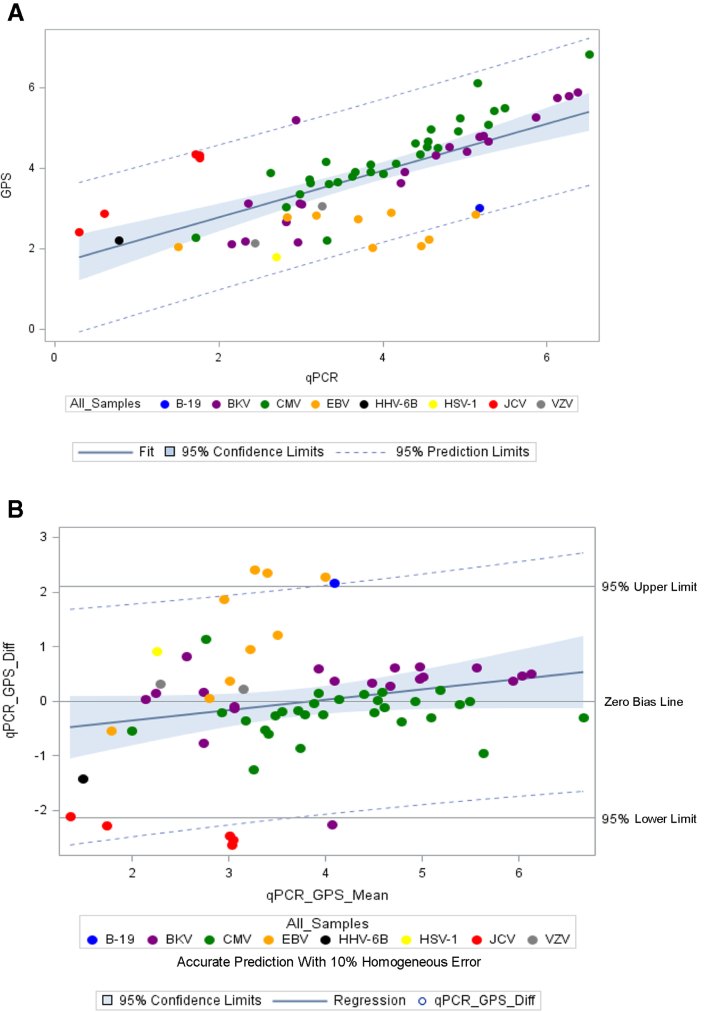
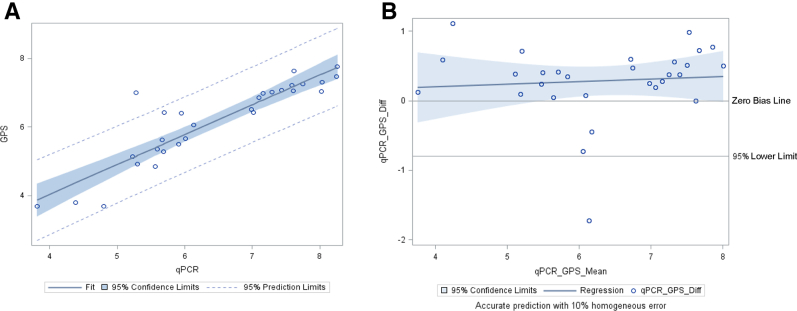
Viral infections are major causes of morbidity and mortality in solid-organ and hematopoietic stem cell transplant recipients. This study evaluated the performance of the Galileo Pathogen Solution metagenomics Next-Generation sequencing assay to detect and quantify 11 DNA viruses (cytomegalovirus, Epstein-Barr virus, BK virus, human adenovirus, JC virus, herpes simplex virus 1 and 2, varicella zoster virus, human herpesvirus 6A and 6B, and parvovirus B19) and to qualitatively detect torque teno virus. DNA extracted from 47 plasma samples of viremic transplant recipients were subjected to DNA library preparation with pathogen enrichment/human background depletion, sequencing, and automated data analysis. The viral loads were determined with the Galileo assay using a standard curve generated from a calibration panel. All of the samples tested had a 100% agreement with the real-time quantitative PCR (qPCR) assays in detecting the primary virus targets and the majority of the quantified samples had a viral load difference within 0.46 log10 IU/mL or copies/mL. The mean difference for cytomegalovirus between the Galileo and qPCR assays was 0.21 log10 IU/mL (SD, ±0.43 log10 IU/mL). The mean difference for BK virus between the Galileo and qPCR assays was 0.17 log10 cp/mL (SD, ±0.67 log10 cp/mL). Additionally, 75 co-infections were detected in 31 samples by the Galileo assay. The study findings show that the Galileo assay can simultaneously detect and quantify multiple viruses in transplant recipients with results that are comparable with standard-of-care qPCR assays.
Copyright © 2021 Association for Molecular Pathology and American Society for Investigative Pathology. Published by Elsevier Inc. All rights reserved.
Figures
References
-
- Kumar R., Ison M.G. Opportunistic infections in transplant patients. Infect Dis Clin North Am. 2019;33:1143–1157. - PubMed
-
- Camargo J.F., Komanduri K.V. Emerging concepts in cytomegalovirus infection following hematopoietic stem cell transplantation. Hematol Oncol Stem Cell Ther. 2017;10:233–238. - PubMed
-
- Haidar G., Singh N. Viral infections in solid organ transplant recipients: novel updates and a review of the classics. Curr Opin Infect Dis. 2017;30:579–588. - PubMed
-
- Lau J.S.Y., Low Z.M., Abbott I., Shochet L., Kanellis J., Kitching A.R., Korman T.M. Epstein-Barr virus encephalitis in solid organ transplantation. New Microbiol. 2017;40:212–217. - PubMed
-
- Hirsch H.H., Randhawa P., AST Infectious Diseases Community of Practice BK polyomavirus in solid organ transplantation. Am J Transplant. 2013;13(Suppl 4):179–188. - PubMed
Publication types
MeSH terms
Grants and funding
LinkOut - more resources
Full Text Sources
Other Literature Sources
Miscellaneous
