. 2021 May 7;49(8):4203-4219.
doi: 10.1093/nar/gkab161.

SIRT3 consolidates heterochromatin and counteracts senescence

Affiliations

SIRT3 consolidates heterochromatin and counteracts senescence

Zhiqing Diao et al. Nucleic Acids Res. .

Erratum in

Abstract

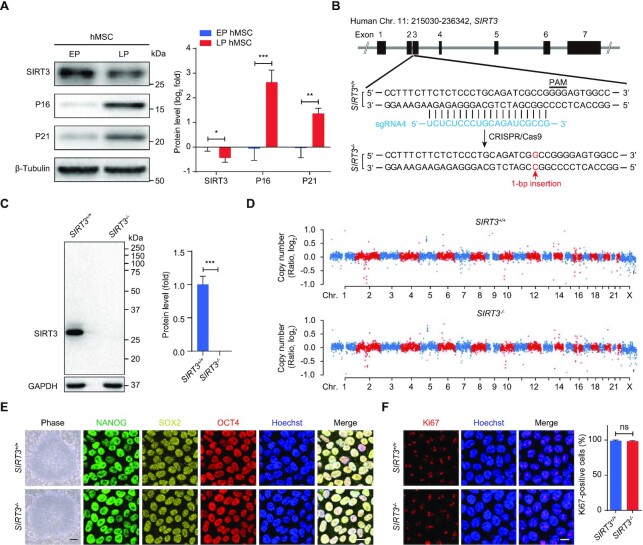
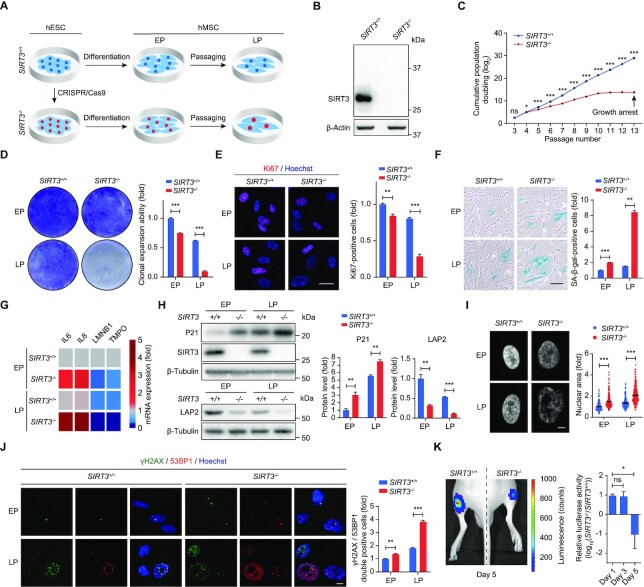
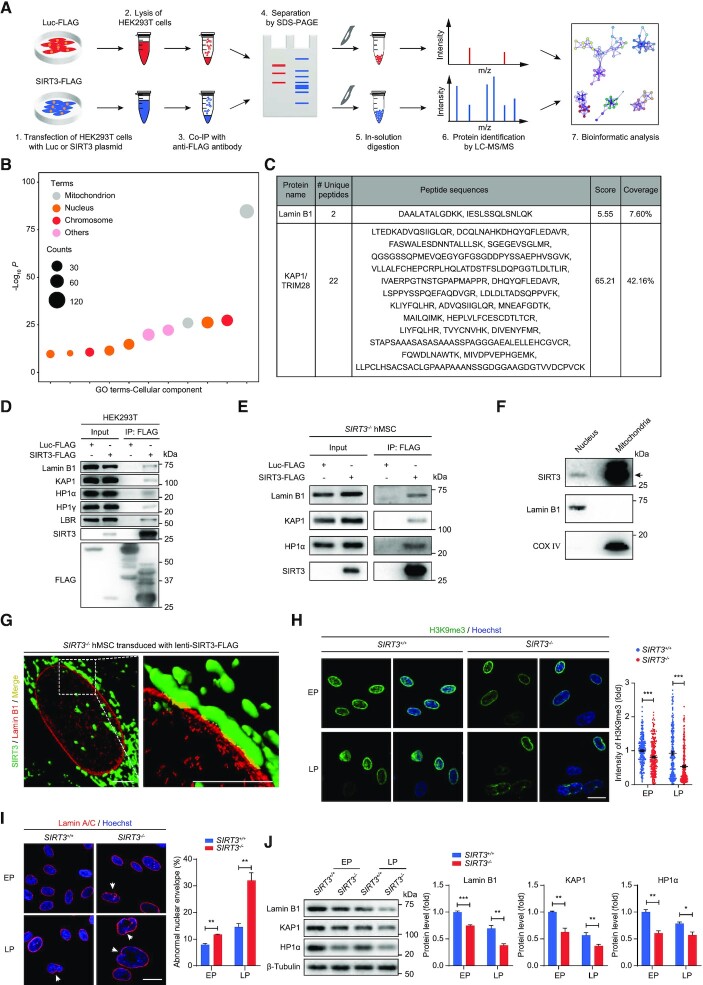
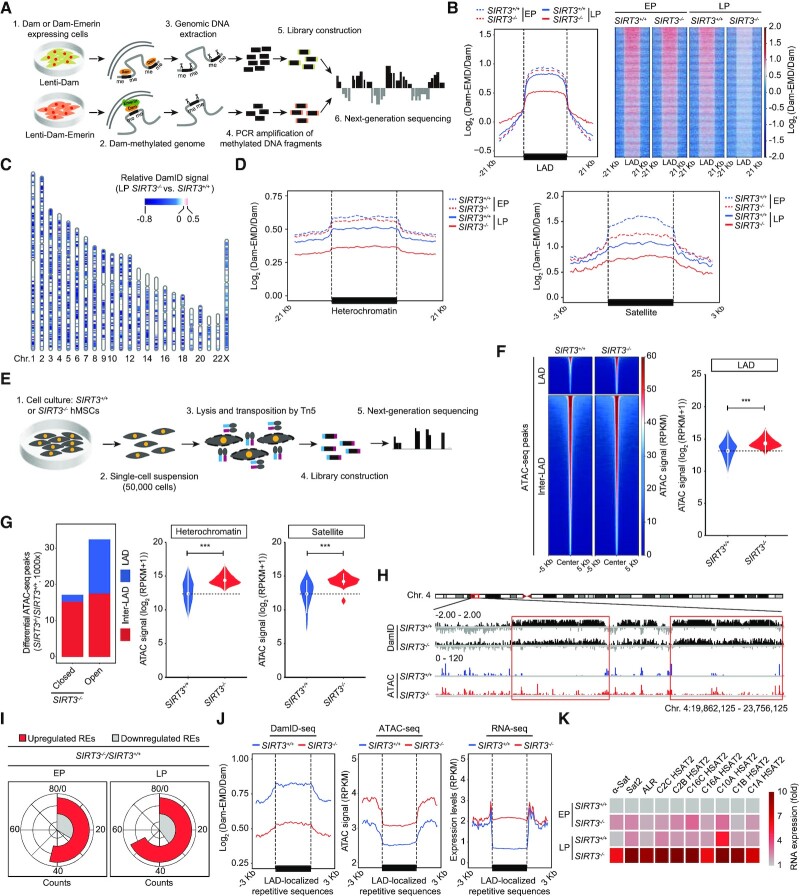
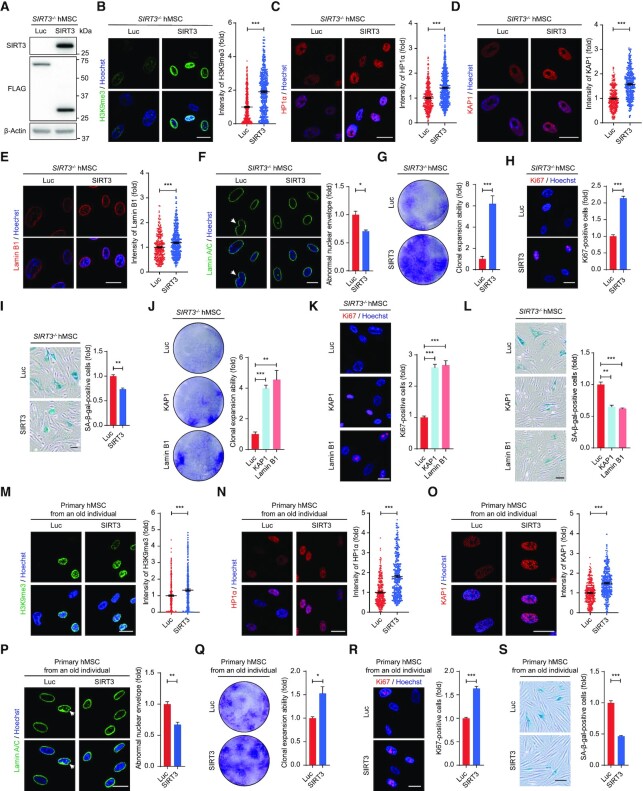
Sirtuin 3 (SIRT3) is an NAD+-dependent deacetylase linked to a broad range of physiological and pathological processes, including aging and aging-related diseases. However, the role of SIRT3 in regulating human stem cell homeostasis remains unclear. Here we found that SIRT3 expression was downregulated in senescent human mesenchymal stem cells (hMSCs). CRISPR/Cas9-mediated depletion of SIRT3 led to compromised nuclear integrity, loss of heterochromatin and accelerated senescence in hMSCs. Further analysis indicated that SIRT3 interacted with nuclear envelope proteins and heterochromatin-associated proteins. SIRT3 deficiency resulted in the detachment of genomic lamina-associated domains (LADs) from the nuclear lamina, increased chromatin accessibility and aberrant repetitive sequence transcription. The re-introduction of SIRT3 rescued the disorganized heterochromatin and the senescence phenotypes. Taken together, our study reveals a novel role for SIRT3 in stabilizing heterochromatin and counteracting hMSC senescence, providing new potential therapeutic targets to ameliorate aging-related diseases.


Figures

Figure 1.
Figure 1.
Downregulation of SIRT3 in senescent hMSCs and generation of SIRT3-deficient hESCs. (A) Western blot analysis of SIRT3, P16 and P21 expression in replicative senescent hMSCs. Early passage (EP), passage 4 (P4); late passage (LP), P14. β-Tubulin was used as loading control. Data are presented as the means ± SEM. n = 3. *P < 0.05; **P < 0. 01; ***P < 0. 001. (B) Schematic diagram of SIRT3 gene editing strategy using CRISPR/Cas9- mediated non-homologous end-joining (NHEJ) in hESCs. The SIRT3 sgRNA is shown in blue. 1-bp insertion (shown in red) was identified by DNA sequencing. (C) Western blot analysis of SIRT3 in SIRT3+/+ and SIRT3–/– hESCs. GAPDH was used as a loading control. Data are presented as the means ± SEM. n = 3. ***P < 0.001. (D) Copy number variation (CNV) analysis of SIRT3+/+ and SIRT3–/– hESCs by whole genome sequencing. (E) Immunofluorescent (IF) images of pluripotency markers NANOG, SOX2 and OCT4 and phase-contrast images for SIRT3+/+ and SIRT3–/– hESCs. Scale bar, 25 μm (IF images) and 250 μm (phase-contrast images). (F) Immunofluorescence analysis of Ki67 in SIRT3+/+ and SIRT3–/– hESCs. Scale bar, 10 μm. The statistical analysis of Ki67-positive cells is shown on the right. Data are presented as the means ± SEM. n = 3. ns, not significant.
Figure 2.
Figure 2.
SIRT3 deficiency accelerates hMSC senescence and cellular dysfunction. (A) Schematic diagram showing the generation of SIRT3+/+ and SIRT3–/– hMSCs from hESCs. (B) Western blot analysis of SIRT3 in SIRT3+/+ and SIRT3–/– hMSCs at EP (P4). β-Actin was used as a loading control. (C) Growth curve showing cumulative population doubling of SIRT3+/+ and SIRT3–/– hMSCs. Data are presented as the means ± SEM. n = 3. ns, not significant; *P < 0.05; ***P < 0.001. (D) Clonal expansion analysis of SIRT3+/+ and SIRT3–/– hMSCs at EP (P4) and LP (P9). Data are presented as the means ± SEM. n = 3. ***P < 0.001. (E) Immunofluorescence analysis of Ki67 in SIRT3+/+ and SIRT3–/– hMSCs at EP (P4) and LP (P9). Scale bar, 25 μm. The statistical analysis of Ki67-positive cells is shown on the right. Data are presented as the means ± SEM. n = 3. **P < 0.01; ***P < 0.001. (F) SA-β-gal staining of SIRT3+/+ and SIRT3–/– hMSCs at EP (P4) and LP (P9). Scale bar, 50 μm. Data are presented as the means ± SEM. n = 3. **P < 0.01; ***P < 0.001. (G) RT-qPCR analysis for the expression of IL6, IL8, LMNB1 (Lamin B1) and TMPO (LAP2) in SIRT3+/+ and SIRT3–/– hMSCs at EP (P4) and LP (P9). Data are representative of three independent experiments. (H) Western blot analysis of P21, LAP2 and SIRT3 in SIRT3+/+ and SIRT3–/– hMSCs at EP (P4) and LP (P9). β-Tubulin was used as loading control. Data are presented as the means ± SEM. n = 3. **P < 0.01; ***P < 0.001. (I) Nuclear area analysis in SIRT3+/+ and SIRT3–/– hMSCs at EP (P4) and LP (P9). Nuclei were stained with Hoechst 33342 and nuclear area was measured with ImageJ. Scale bar, 5 μm. Data are presented as the means ± SEM. n ≥ 150. ***P < 0.001. (J) Immunofluorescence analysis of γH2AX and 53BP1 in SIRT3+/+ and SIRT3–/– hMSCs at EP (P4) and LP (P9). Scale bar, 10 μm. The statistical analysis of γH2AX and 53BP1 double-positive cells is shown on the right. Data are presented as the means ± SEM. n = 3. **P < 0.01; ***P < 0.001. (K) Photon flux from tibialis anterior (TA) muscles of nude mice transplanted with SIRT3+/+ (left) or SIRT3–/– hMSCs (right) expressing luciferase. Luciferase activity in TA tissue was detected using an in vivo imaging system (IVIS). Data are presented as the means ± SEM. n = 5. ns, not significant; *P < 0.05.
Figure 3.
Figure 3.
SIRT3 interacts with nuclear lamina and heterochromatin-associated proteins. (A) Schematic workflow of co-IP followed by LC-MS/MS analysis for identifying SIRT3-interacting proteins. FLAG-tagged Luc was used as negative control. (B) Gene Ontology Cellular Component (GO-CC) enrichment analysis of SIRT3-interacting proteins identified by mass spectrometry. (C) Lamin B1 and KAP1 were identified as novel interacting proteins of SIRT3 by mass spectrometry. (D) Co-IP analysis for the interactions between indicated proteins and SIRT3-FLAG in HEK293T cells. (E) Co-IP analysis for the interactions of KAP1, Lamin B1, HP1α with SIRT3 in SIRT3–/–hMSCs. (F) Western blot analysis of SIRT3 in the fractions of nucleus and mitochondria isolated from SIRT3+/+hMSCs. The black arrow indicates the expected position of SIRT3. Lamin B1 and COX IV were used as marker proteins for nuclear and mitochondrial fractions, respectively. (G) Three-dimensional reconstruction images showing the colocalization of SIRT3 with Lamin B1 in SIRT3–/– hMSCs expressing FLAG-tagged SIRT3. SIRT3 (FLAG) is shown in green, Lamin B1 is marked in red and the colocalization of SIRT3 and Lamin B1 is shown in yellow. Scale bar, 4 μm. (H) Immunofluorescence analysis of H3K9me3 in SIRT3+/+and SIRT3–/– hMSCs at EP (P4) and LP (P9). Scale bar, 25 μm. Data are presented as the means ± SEM. n > 200. ***P < 0.001. (I) Immunofluorescence analysis of Lamin A/C in SIRT3+/+and SIRT3–/– hMSCs at EP (P4) and LP (P9). Scale bar, 25 μm. The white arrow indicates abnormal nuclear envelope. The statistical analysis of abnormal nuclear envelope is shown on the right. Data are presented as the means ± SEM. n = 3. **P < 0.01. (J) Western blot analysis of Lamin B1, KAP1 and HP1α in SIRT3+/+ and SIRT3–/– hMSCs at EP (P4) and LP (P9). β-Tubulin was used as loading control. Data are presented as the means ± SEM. n = 3. *P < 0.05; **P < 0.01; ***P < 0.001.
Figure 4.
Figure 4.
DamID-seq and ATAC-seq analyses in SIRT3+/+ and SIRT3–/– hMSCs. (A) Schematic diagram showing the workflow for DamID-seq library preparation and sequencing. Dam-Emerin expression in hMSCs drives the methylation of adenines near the nuclear envelope by the DNA adenine methyltransferase (Dam). Genomic DNA sequence containing Dam-methylated sites was specifically cut using Dpn I, PCR amplified, and then used for library construction and high-throughput sequencing. A parallel control ‘Dam only’ was used to account for background Dam signals. (B) Line plot (left) and heatmaps (right) showing reduced DamID signals [log2 (Dam-EMD/Dam)] at LAD regions in SIRT3–/– hMSCs compared to SIRT3+/+ hMSCs at EP (P4) and LP (P9). (C) Ideogram showing the loss of DamID signals in SIRT3–/– hMSCs compared to those in SIRT3+/+ hMSCs at LP (P9) over 23 chromosomes. The color key from blue to red represents relatively low to high DamID signals in SIRT3–/– hMSCs compared to those in SIRT3+/+ hMSCs. (D) Line plots showing the loss of DamID signals at heterochromatin regions and LAD-localized satellite repetitive elements in SIRT3–/– hMSCs compared to those in SIRT3+/+ hMSCs at EP (P4) and LP (P9). (E) Schematic diagram showing the workflow for ATAC-seq library preparation and sequencing. (F) Left, heatmaps showing the ATAC signals within LAD and inter-LAD regions in SIRT3+/+ hMSCs and SIRT3–/– hMSCs at LP (P9). Right, violin plot showing the ATAC signals within LADs in SIRT3+/+ hMSCs and SIRT3–/– hMSCs at LP (P9). ***P < 0.001. (G) Left, the distribution of differential ATAC-seq peaks within LAD or inter-LAD regions of SIRT3–/– hMSCs compared to those of SIRT3+/+ hMSCs at LP (P9). Right, violin plots showing increased accessibility at heterochromatin regions and LAD-localized satellite repetitive elements in SIRT3–/– hMSCs compared to those in SIRT3+/+ hMSCs at LP (P9). ***P < 0.001. (H) Representative tracks of DamID-seq and ATAC-seq signals showing decreased DamID signals along with increased ATAC-seq signals within LAD regions in SIRT3–/– hMSCs compared to those in SIRT3+/+ hMSCs at LP (P9). (I) RNA-seq analysis showing repetitive elements (REs) that were differentially expressed in SIRT3–/– hMSCs compared to those in SIRT3+/+ hMSCs at EP (P3) and LP (P7). (J) Line plots showing decreased DamID signals, increased chromatin accessibility and upregulated expression levels of LAD-localized repetitive sequences in SIRT3–/–hMSCs at LP (P7 for RNA-seq and P9 for DamID-seq and ATAC-seq) compared to SIRT3+/+ hMSCs using a conjoint analysis of DamID-seq, ATAC-seq and RNA-seq. LAD-localized repetitive sequences with higher expression levels in SIRT3–/– hMSCs at LP (P7) were processed for conjoint analysis. (K) Heatmap showing the relative RNA expression levels of repetitive elements in SIRT3–/–hMSCs compared to those in SIRT3+/+ hMSCs at EP (P4) and LP (P9) using RT-qPCR analysis. Expression levels of repetitive elements were normalized to SIRT3+/+ hMSCs at EP (P4). Data are representative of three independent experiments.
Figure 5.
Figure 5.
Overexpression of SIRT3 alleviates hMSC senescence. (A) Western blot analysis showing the levels of SIRT3 and FLAG-tagged proteins in SIRT3–/– hMSCs (P6) expressing Luc-FLAG or SIRT3-FLAG. β-Actin was used as loading control. (B) Immunofluorescence analysis of H3K9me3 in SIRT3–/– hMSCs (P6) expressing Luc or SIRT3. Scale bar, 25 μm. Data are presented as the means ± SEM. n > 300. ***P < 0.001. (C) Immunofluorescence analysis of HP1α in SIRT3–/– hMSCs (P6) expressing Luc or SIRT3. Scale bar, 25 μm. Data are presented as the means ± SEM. n > 300. ***P < 0.001. (D) Immunofluorescence analysis of KAP1 in SIRT3–/– hMSCs (P6) expressing Luc or SIRT3. Scale bar, 25 μm. Data are presented as the means ± SEM. n > 300. ***P < 0.001. (E) Immunofluorescence analysis of Lamin B1 in SIRT3–/– hMSCs (P6) expressing Luc or SIRT3. Scale bar, 25 μm. Data are presented as the means ± SEM. n > 300. ***P < 0.001. (F) Immunofluorescence analysis of Lamin A/C in SIRT3–/– hMSCs (P6) expressing Luc or SIRT3. Scale bar, 25 μm. The white arrow indicates abnormal nuclear envelope. The statistical analysis of abnormal nuclear envelope is shown on the right. Data are presented as the means ± SEM. n = 3. *P < 0.05. (G) Clonal expansion analysis of SIRT3–/– hMSCs (P6) expressing Luc or SIRT3. Data are presented as the means ± SEM. n = 3. ***P < 0.001. (H) Immunofluorescence analysis of Ki67 in SIRT3–/– hMSCs (P6) expressing Luc or SIRT3. Scale bar, 25 μm. The statistical analysis of Ki67-positive cells is shown on the right. Data are presented as the means ± SEM. n = 3. ***P < 0.001. (I) SA-β-gal staining of SIRT3–/– hMSCs (P6) expressing Luc or SIRT3. Scale bar, 50 μm. Data are presented as the means ± SEM. n = 3. **P < 0.01. (J) Clonal expansion analysis of SIRT3–/– hMSCs (P6) expressing Luc, KAP1 or Lamin B1. Data are presented as the means ± SEM. n = 3. **P < 0.01; ***P < 0.001. (K) Immunofluorescence analysis of Ki67 in SIRT3–/– hMSCs (P6) expressing Luc, KAP1 or Lamin B1. Scale bar, 25 μm. The statistical analysis of Ki67-positive cells is shown on the right. Data are presented as the means ± SEM. n = 3. ***P < 0.001. (L) SA-β-gal staining of SIRT3–/– hMSCs (P6) expressing Luc, KAP1 or Lamin B1. Scale bar, 50 μm. Data are presented as the means ± SEM. n = 3. **P < 0.01; ***P < 0.001. (M) Immunofluorescence analysis of H3K9me3 in primary hMSCs (P10) expressing Luc or SIRT3. Scale bar, 25 μm. Data are presented as the means ± SEM. n > 300. ***P < 0.001. (N) Immunofluorescence analysis of HP1α in primary hMSCs (P10) expressing Luc or SIRT3. Scale bar, 25 μm. Data are presented as the means ± SEM. n > 300. ***P < 0.001. (O) Immunofluorescence analysis of KAP1 in primary hMSCs (P10) expressing Luc or SIRT3. Scale bar, 25 μm. Data are presented as the means ± SEM. n > 300. ***P < 0.001. (P) Immunofluorescence analysis of Lamin A/C in primary hMSCs (P10) expressing Luc or SIRT3. Scale bar, 25 μm. The white arrow indicates abnormal nuclear envelope. The statistical analysis of abnormal nuclear envelope is shown on the right. Data are presented as the means ± SEM. n = 3. **P < 0.01. (Q) Clonal expansion analysis of primary hMSCs (P10) expressing Luc or SIRT3. Data are presented as the means ± SEM. n = 3. *P < 0.05. (R) Immunofluorescence analysis of Ki67 in primary hMSCs (P10) expressing Luc or SIRT3. Scale bar, 25 μm. The statistical analysis of Ki67-positive cells is shown on the right. Data are presented as the means ± SEM. n = 3. ***P < 0.001. (S) SA-β-gal staining of primary hMSCs (P10) expressing Luc or SIRT3. Scale bar, 50 μm. Data are presented as the means ± SEM. n = 3. ***P < 0.001.

Similar articles

Cited by

References

    1. Houtkooper R.H., Pirinen E., Auwerx J.. Sirtuins as regulators of metabolism and healthspan. Nat. Rev. Mol. Cell Biol. 2012; 13:225–238. - PMC - PubMed
    1. McDonnell E., Peterson B.S., Bomze H.M., Hirschey M.D.. SIRT3 regulates progression and development of diseases of aging. Trends Endocrinol. Metab. 2015; 26:486–492. - PMC - PubMed
    1. Zhang X., Cao R., Niu J., Yang S., Ma H., Zhao S., Li H.. Molecular basis for hierarchical histone de-β-hydroxybutyrylation by SIRT3. Cell Discov. 2019; 5:35. - PMC - PubMed
    1. Wei Z., Song J., Wang G., Cui X., Zheng J., Tang Y., Chen X., Li J., Cui L., Liu C.Y.et al. .. Deacetylation of serine hydroxymethyl-transferase 2 by SIRT3 promotes colorectal carcinogenesis. Nat. Commun. 2018; 9:4468. - PMC - PubMed
    1. Kaeberlein M., McVey M., Guarente L.. The SIR2/3/4 complex and SIR2 alone promote longevity in Saccharomyces cerevisiae by two different mechanisms. Genes Dev. 1999; 13:2570–2580. - PMC - PubMed

Publication types

MeSH terms