. 2021 Nov;17(11):3740-3752.
doi: 10.1080/15548627.2021.1896906. Epub 2021 Mar 11.

Trehalose causes low-grade lysosomal stress to activate TFEB and the autophagy-lysosome biogenesis response

Affiliations

Trehalose causes low-grade lysosomal stress to activate TFEB and the autophagy-lysosome biogenesis response

Se-Jin Jeong et al. Autophagy. 2021 Nov.

Abstract

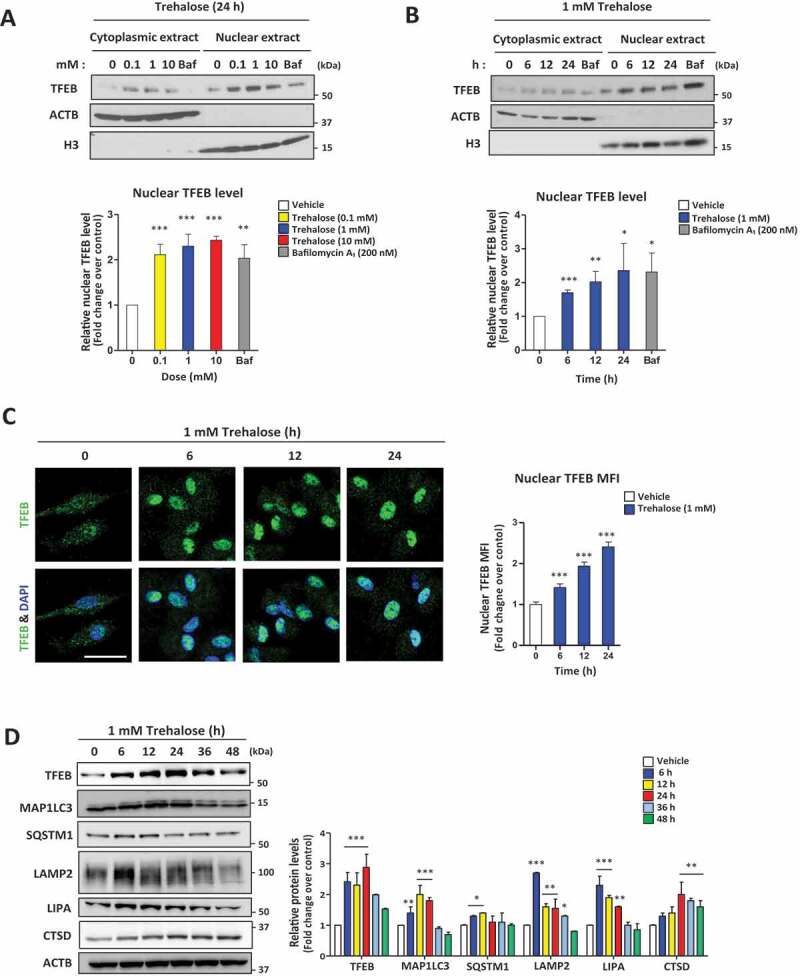
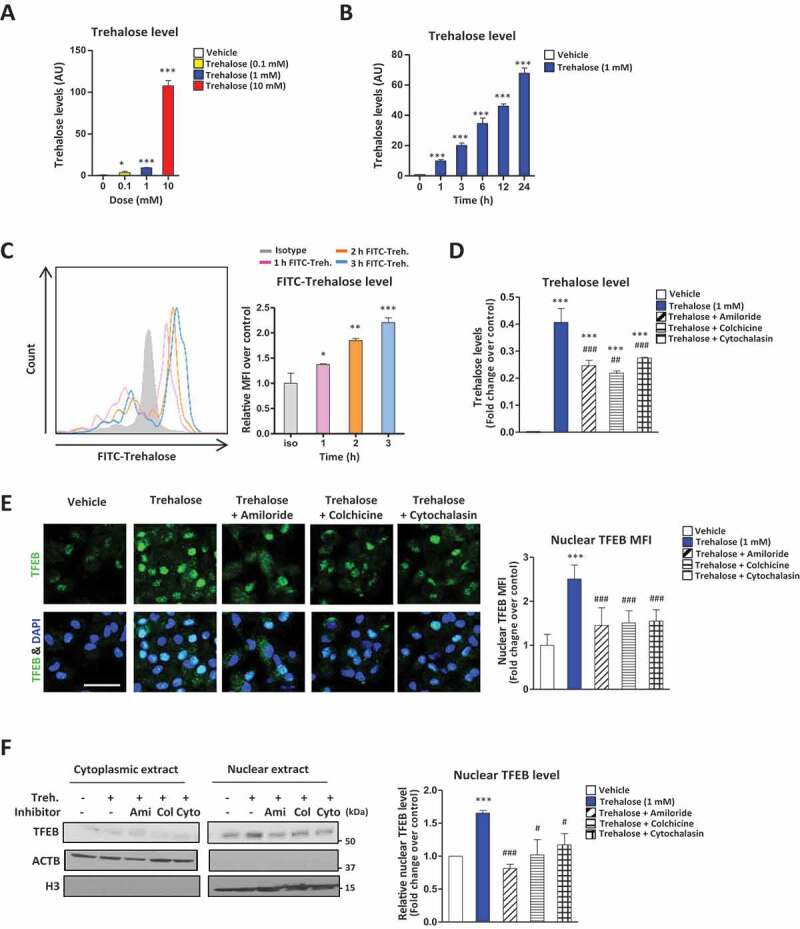
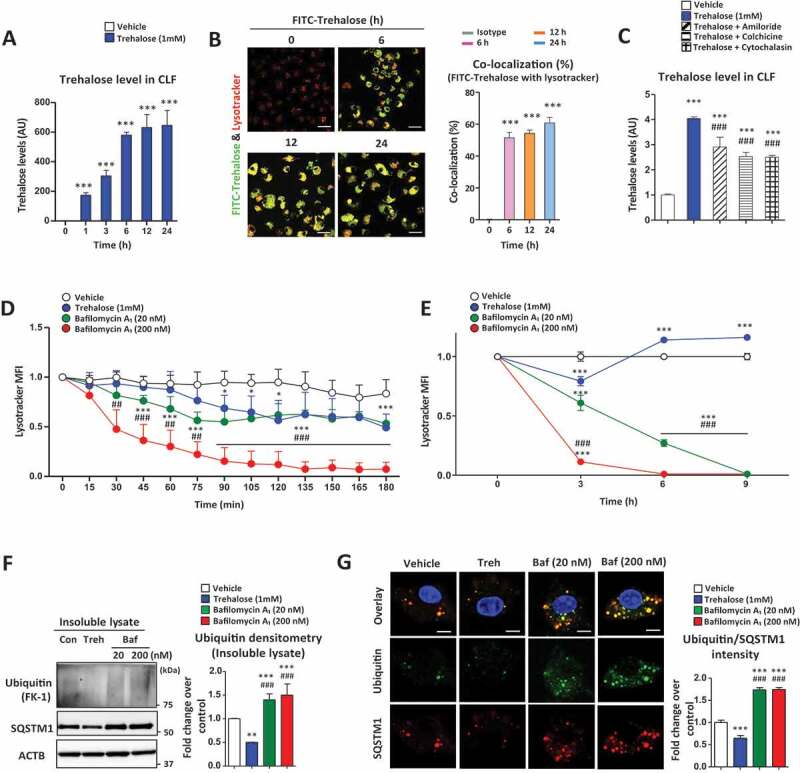
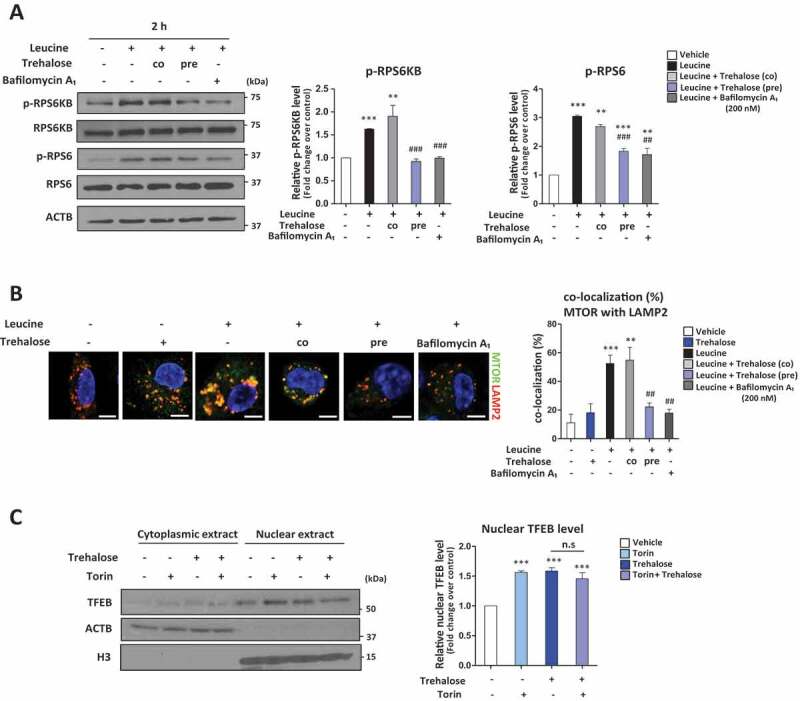
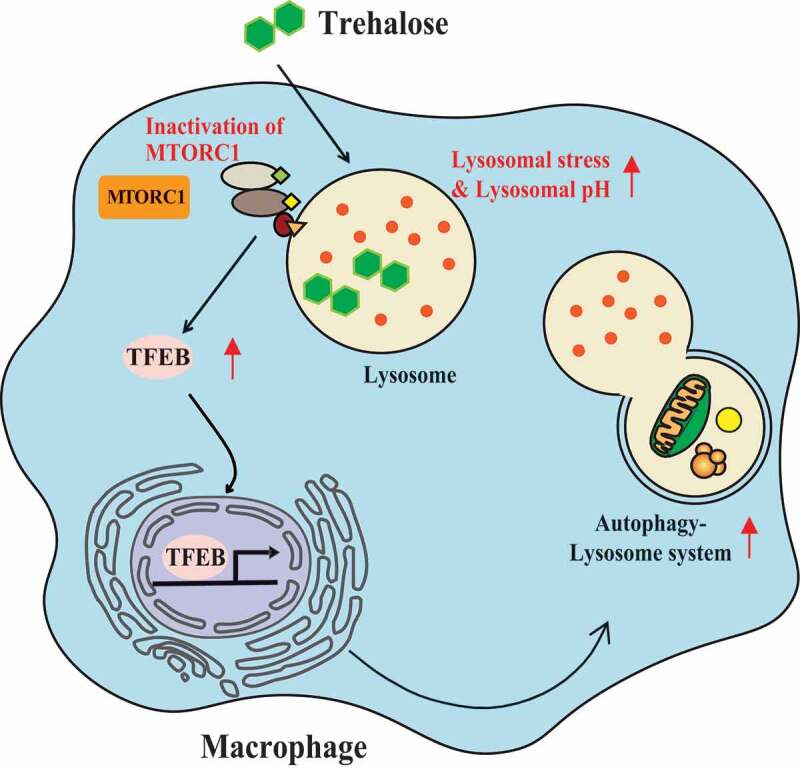
The autophagy-lysosome system is an important cellular degradation pathway that recycles dysfunctional organelles and cytotoxic protein aggregates. A decline in this system is pathogenic in many human diseases including neurodegenerative disorders, fatty liver disease, and atherosclerosis. Thus there is intense interest in discovering therapeutics aimed at stimulating the autophagy-lysosome system. Trehalose is a natural disaccharide composed of two glucose molecules linked by a ɑ-1,1-glycosidic bond with the unique ability to induce cellular macroautophagy/autophagy and with reported efficacy on mitigating several diseases where autophagy is dysfunctional. Interestingly, the mechanism by which trehalose induces autophagy is unknown. One suggested mechanism is its ability to activate TFEB (transcription factor EB), the master transcriptional regulator of autophagy-lysosomal biogenesis. Here we describe a potential mechanism involving direct trehalose action on the lysosome. We find trehalose is endocytically taken up by cells and accumulates within the endolysosomal system. This leads to a low-grade lysosomal stress with mild elevation of lysosomal pH, which acts as a potent stimulus for TFEB activation and nuclear translocation. This process appears to involve inactivation of MTORC1, a known negative regulator of TFEB which is sensitive to perturbations in lysosomal pH. Taken together, our data show the trehalose can act as a weak inhibitor of the lysosome which serves as a trigger for TFEB activation. Our work not only sheds light on trehalose action but suggests that mild alternation of lysosomal pH can be a novel method of inducing the autophagy-lysosome system.Abbreviations: ASO: antisense oligonucleotide; AU: arbitrary units; BMDM: bone marrow-derived macrophages; CLFs: crude lysosomal fractions; CTSD: cathepsin D; LAMP: lysosomal associated membrane protein; LIPA/LAL: lipase A, lysosomal acid type; MAP1LC3: microtubule-associated protein 1 light chain 3; MFI: mean fluorescence intensity; MTORC1: mechanistic target of rapamycin kinase complex 1; pMAC: peritoneal macrophages; SLC2A8/GLUT8: solute carrier family 2, (facilitated glucose transporter), member 8; TFEB: transcription factor EB; TMR: tetramethylrhodamine; TREH: trehalase.

Keywords: Endocytosis; MTORC1; TFEB; lysosome; trehalose.


Conflict of interest statement

No potential conflict of interest was reported by the authors.

Figures

Figure 1.
Figure 1.
Trehalose induces TFEB nuclear translocation in a dose- and time-dependent fashion
Figure 2.
Figure 2.
Trehalose undergoes endocytic uptake which is necessary for its stimulatory effect on TFEB. (A-B) Intracellular levels of trehalose measured by mass spectrometry in macrophages (A) treated for 24 h with the indicated concentrations of trehalose or (B) treated with trehalose (1 mM) for the indicated times. AU = arbitrary units. (C) Macrophages treated with FITC-conjugated trehalose for indicated times and fluorescence quantified by FACS analysis. Quantification of intracellular FITC is graphed to the right as MFI. (D) Intracellular levels of trehalose measured by mass spectrometry in macrophages treated for 24 h with trehalose (1 mM) ± endocytosis inhibitors amiloride, colchicine, or cytochalasin B. (E) Assessment of TFEB nuclear localization in macrophages by immunofluorescence microscopy after treatment with 1 mM trehalose for 24 h ± endocytosis inhibitors amiloride, colchicine, or cytochalasin B. Quantification of images is shown to the right graphed as nuclear MFI of TFEB with nuclear marker DAPI (n ≥ 20 cells per group; scale bar: 10 μm). (F) Western blot analysis of TFEB in cytoplasmic and nuclear fractions of macrophages after treatment with 1 mM trehalose for 24 h ± endocytosis inhibitors amiloride, colchicine, or cytochalasin B. Densitometric quantification from n = 3 independent experiments is shown to the right. For all graphs are presented as Mean ± SEM. *P < 0.05, **P < 0.01 and ***P < 0.001, compare with vehicle; #P < 0.05, ##P < 0.01 and ###P < 0.001, compared with trehalose
Figure 3.
Figure 3.
Trehalose accumulates in lysosomes and affects lysosomal acidification. (A) Trehalose levels in the crude lysosomal fraction (CLF) of macrophages were measured by mass spectrometry after treatment with trehalose (1 mM) for the indicated times. AU = arbitrary units. (B) Macrophages treated with FITC-conjugated trehalose for indicated times, stained with the lysosomal marker LysoTracker and imaged by fluorescence microscopy for FITC (green) and LysoTracker Red (Red). Quantification of images is shown to the right graphed as colocalization percent of FITC-conjugated trehalose with LysoTracker Red (n ≥ 20 cells per group; scale bar: 20 μm). (C) Trehalose levels in the lysosomal fraction of macrophages were measured by mass spectrometry after treatment for 24 h with trehalose (1 mM) ± endocytosis inhibitors amiloride, colchicine, or cytochalasin B. (D) Live imaging of macrophages incubated with trehalose (1 mM) or bafilomycin A1 (20 nM or 200 nM) for 180 min after staining with LysoTracker Red to monitor lysosomal acidity. Quantification of LysoTracker Red mean intensity every 15 min is shown (n ≥ 30 cells per group). (E) Confocal imaging of macrophages incubated with trehalose (1 mM) or bafilomycin A1 (20 nM or 200 nM) for indicated times after staining with LysoTracker Red to monitor lysosomal acidity. Quantification of LysoTracker Red mean intensity every 3 h is shown (n ≥ 30 cells per group). (F) Detergent-insoluble lysates were prepared after incubations with trehalose (1 mM) or bafilomycin A1 (20 nM or 200 nM) for 12 h and subjected to Western blot analysis for polyubiquitinated proteins (FK-1 monoclonal antibody) and SQSTM1. ACTB/β-actin used as loading control. Densitometric quantification from (n = 3) independent experiments is shown. (G) Assessment of ubiquitination in macrophages by immunofluorescence microscopy after treatment with trehalose (1 mM) or bafilomycin A1 (20 nM or 200 nM) for 12 h. Quantification of images is shown to the right graphed as ubiquitin intensity fold-change over control (n ≥ 20 cells per group; scale bar: 10 μm). For all graphs are presented as Mean ± SEM. *P < 0.05, **P < 0.01 and ***P < 0.001, compare with vehicle; #P < 0.05, ##P < 0.01 and ###P < 0.001, compared with trehalose
Figure 4.
Figure 4.
Trehalose affects MTOR activation leading to induction of TFEB nuclear translocation. (A, B) Macrophages were treated with or without Leucine and either trehalose (1 mM) provided 2 h before Leucine (labeled “pre”), trehalose (1 mM) provided at same time as Leucine (labeled “co”), or bafilomycin A1 (200 nM) provided at same time a Leucine followed by: (A) Western blot analysis of MTORC1 downstream targets (phospho-Thr389 and total RPS6KB/S6K; phospho-Ser235/236 and total RPS6 ribosomal protein). Densitometric quantification from three separate experiments is shown to the right. (B) Immunofluorescence staining of MTOR colocalization with lysosome marker (LAMP2). Quantification of images is shown to the right graphed as colocalization percent of MTOR with LAMP2 (n ≥ 10 cells per group; scale bar: 5 μm). (C) Western blot analysis of TFEB in cytoplasmic and nuclear fractions of macrophages after treatment with 1 mM trehalose for 24 h ± MTOR inhibitor Torin. Densitometric quantification from n = 3 independent experiments is shown to the right. For all graphs are presented as Mean ± SEM. **P < 0.01 and ***P < 0.001, compare with vehicle; ## P < 0.01 and ### P < 0.001, compare with leucine only
Figure 5.
Figure 5.
Overview of the proposed mechanism of TFEB activation by trehalose. Trehalose is first taken up by endocytic means and accumulates in lysosomes (note: SLC2A8-independent uptake is only demonstrated in macrophages). The rise in intra-lysosomal trehalose concentration results in modest increases in lysosomal pH, which is sufficient to perturb MTORC1 signaling. Reductions in MTOR activity relieves it suppressive effect on TFEB, resulting in its nuclear translocation and induction of the autophagy-lysosomal biogenesis response. In this context, trehalose functions as a TFEB activator via mild perturbation of lysosomal acidity and function

Similar articles

Cited by

References

    1. Nakatogawa H, Suzuki K, Kamada Y, et al. Dynamics and diversity in autophagy mechanisms: lessons from yeast. Nat Rev Mol Cell Biol [Internet]. 2009;10:458–467. - PubMed
    1. Mizushima N, Komatsu M.. Review autophagy : renovation of cells and tissues. Cell. 2011;147:728–741. - PubMed
    1. Sa´nchez I, Mahlke C, Yuan J.. Pivotal role of oligomerization in expanded polyglutamine neurodegenerative disorders. Nature. 2003;421:373–379. - PubMed
    1. Lansbury PT, Lashuel HA. A century-old debate on protein aggregation and neurodegeneration enters the clinic. Nature. 2006;443:774–779. - PubMed
    1. Polanco JC, Li C, Bodea L, et al. Amyloid‑β and tau complexity — towards improved biomarkers and targeted therapies. Nat Rev Neurol. 2018;14:22–39. - PubMed

Publication types

MeSH terms

Substances