. 2021 Mar 11;22(1):87.
doi: 10.1186/s12882-021-02287-0.

Beta-trace protein as a potential biomarker of residual renal function in patients undergoing peritoneal dialysis

Affiliations

Beta-trace protein as a potential biomarker of residual renal function in patients undergoing peritoneal dialysis

Sebastian Schwab et al. BMC Nephrol. .

Abstract

Background: Residual renal function is closely linked to quality of life, morbidity and mortality in dialysis patients. Beta-trace protein (BTP), a low molecular weight protein, has been suggested as marker of residual renal function, in particular in patients on hemodialysis. We hypothesized that BTP also serves as a marker of residual renal function in pertioneal dialysis patients.

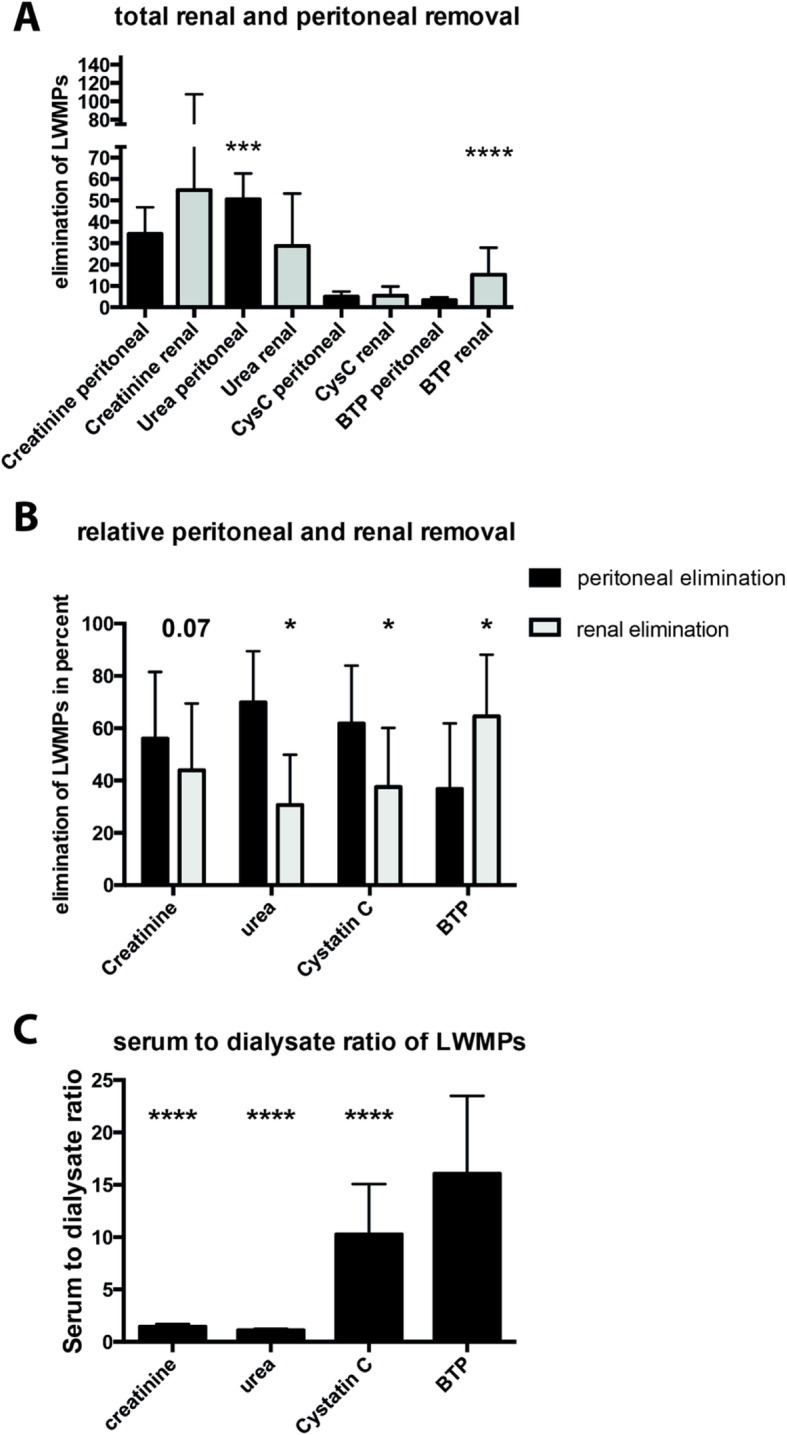
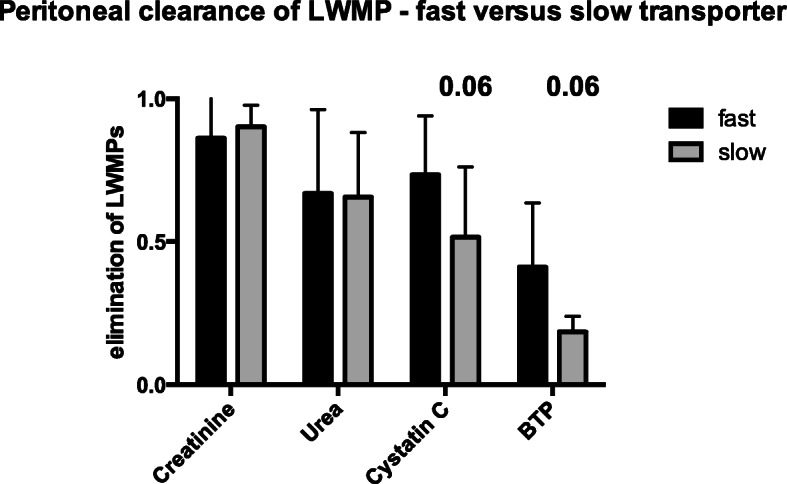
Methods: In this study 34 adult patients on peritoneal dialysis were included. BTP, creatinine, cystatin C and urea concentrations were analyzed simultaneously in serum and dialysate to calculate renal and peritoneal removal of the analytes.

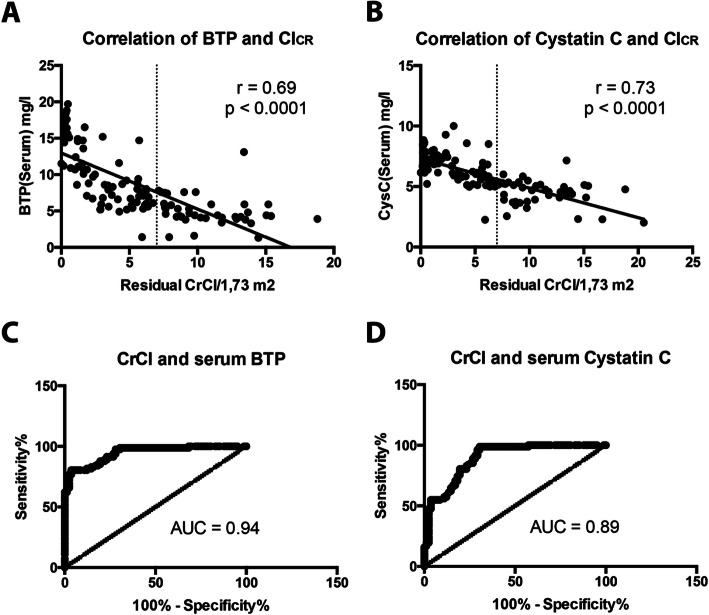
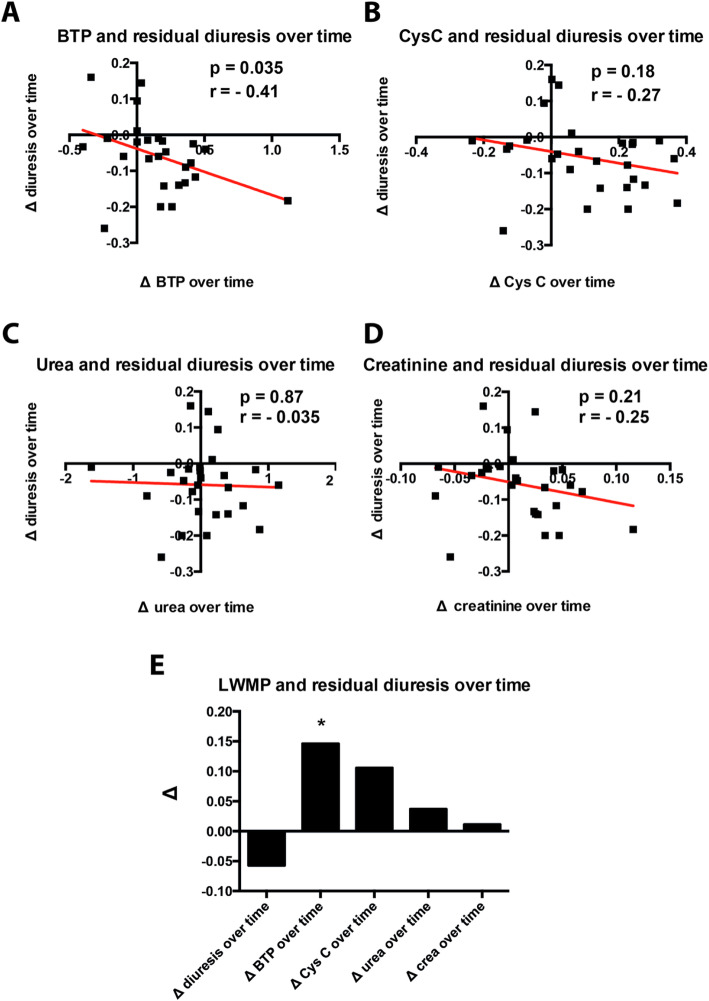
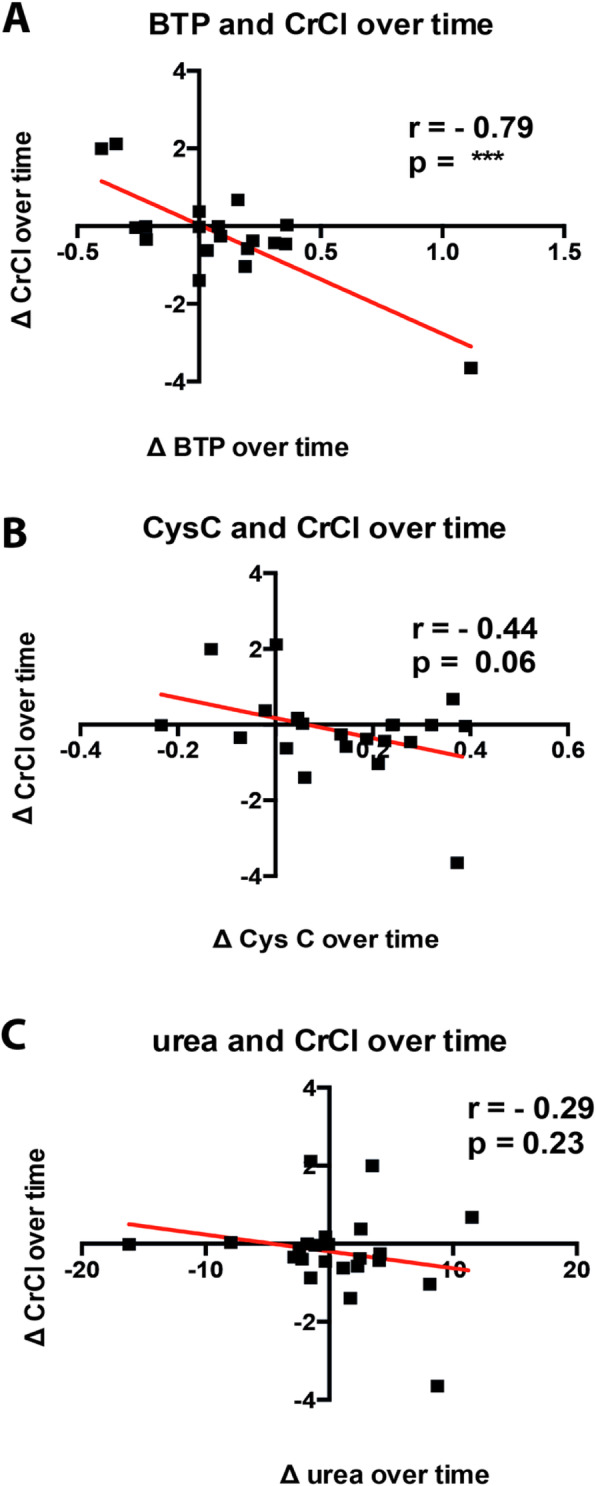
Results: In peritoneal dialysis patients with residual diuresis, mean serum BTP was 8.16 mg/l (SD ± 4.75 mg/l). BTP correlated inversely with residual diuresis (rs = - 0.58, p < 0.001), residual creatinine clearance (ClCr) (rs = - 0.69, p < 0.001) and total urea clearance (Clurea) (rs = - 0.56, p < 0.001). Mean peritoneal removal of BTP was 3.36 L/week/1.73m2 (SD ± 1.38) and mean renal removal 15.14 L/week/1.73m2 (SD ± 12.65) demonstrating a significant renal contribution to the total removal. Finally, serum BTP inversely correlated with alterations in residual diuresis (r = - 0.41, p = 0.035) and renal creatinine clearance over time (r = - 0.79, p = p < 0.001).

Conclusion: BTP measurement in the serum may be a simple tool to assess residual renal function in peritoneal dialysis patients.

Keywords: Beta-trace protein; Low-molecular weight proteins; Peritoneal dialysis; Residual diuresis.


Conflict of interest statement

The authors declare that they have no competing interest that could be perceived as prejudicing the impartiality of the research reported.

Figures

Fig. 1
Fig. 1
Renal and peritoneal elimination of analytes in patients with residual diuresis. a – total renal and peritoneal removal of analytes [(creatinine and urea in L / week / m2); (cystatin C (CysC) and BTP in L / week / m2)]; b – percentage expression of renal and peritoneal elimination. c – Quotient of serum and dialysate values for respective analyte. Data are given as mean and standard deviation. P-values < 0.05 were considered statistically significant. p < 0.05 = *; p < 0.001 = **; p < 0.0001 = ***; p < 0.00001 = ****
Fig. 2
Fig. 2
Correlation of serum analytes and their predictive value. Figure 2: Correlation of serum analytes and residual renal creatinine clearance (ClCR). a – Serum BTP and ClCR; b - Serum Cystatin C and ClCR. Receiver operating characteristic (ROC) curve for prediction of a creatinine clearance < 7 ml / min based on serum level of BTP and Cystatin C. c – ROC analysis for BTP; d – ROC analysis for Cystatin C. AUC (Area under the curve): BTP: 0.94; Cystatin C: 0.89
Fig. 3
Fig. 3
Serum analytes and their correlation with residual diuresis over time. All patients with residual diuresis who were followed up for at least 12 months were included. Correlation between the last and the first BTP serum value as well as the last and first diuresis volume were divided by the amount of follow-up quarters. a- BTP; b- Cystatin C (CysC); c- urea; d – creatinine; e – overview over all investigated parameters. Data are given as mean and standard deviation. P-values < 0.05 were considered statistically significant; p < 0.05 = *
Fig. 4
Fig. 4
Serum analytes and their correlation with creatinine clearance over time. All patients with residual diuresis who were followed up for at least 12 months were included. Correlation between the last and the first BTP serum value as well as the last and first creatinine clearance were divided by the amount of follow-up quarters. a- BTP; b- Cystatin C (CysC); c- urea. Data are given as mean and standard deviation. P-values < 0.05 were considered statistically significant; p < 0.05 = *; p < 0.001 = **; p < 0.0001 = ***; p < 0.00001 = ****
Fig. 5
Fig. 5
Peritoneal clearance in fast and slow peritoneal transporter. The cohort was divided into fast (n = 16) and slow peritoneal transporter (n = 5). Mean and standard deviation of peritoneal elimination are given

References

    1. Bargman JM et al., Relative Contribution of Residual Renal Function and Peritoneal Clearance to Adequacy of Dialysis: A Reanalysis of the CANUSA Study. JASN 2001, 12 (10) 2158–2162. - PubMed
    1. Cheung AK, et al. Serum beta-2 microglobulin levels predict mortality in dialysis patients: results of the HEMO study. J Am Soc Nephrol. 2006;17(2):546–555. doi: 10.1681/ASN.2005020132. - DOI - PubMed
    1. Rocco M, et al. Peritoneal dialysis adequacy and risk of death. Kidney Int. 2000;58(1):446–457. doi: 10.1046/j.1523-1755.2000.00184.x. - DOI - PubMed
    1. Termorshuizen F, et al. Relative contribution of residual renal function and different measures of adequacy to survival in hemodialysis patients: an analysis of the Netherlands cooperative study on the adequacy of Dialysis (NECOSAD)-2. J Am Soc Nephrol. 2004;15(4):1061–1070. doi: 10.1097/01.ASN.0000117976.29592.93. - DOI - PubMed
    1. Wang AY, et al. Lai, The importance of residual renal function in dialysis patients. Kidney Int. 2006;69(10):1726–1732. doi: 10.1038/sj.ki.5000382. - DOI - PubMed

Publication types