. 2021 Mar 16;118(11):e2021586118.
doi: 10.1073/pnas.2021586118.

Visualizing active viral infection reveals diverse cell fates in synchronized algal bloom demise

Affiliations

Visualizing active viral infection reveals diverse cell fates in synchronized algal bloom demise

Flora Vincent et al. Proc Natl Acad Sci U S A. .

Erratum in

Expression of concern in

Abstract

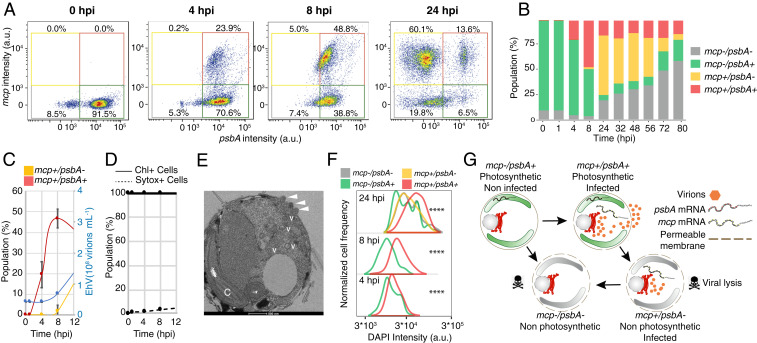
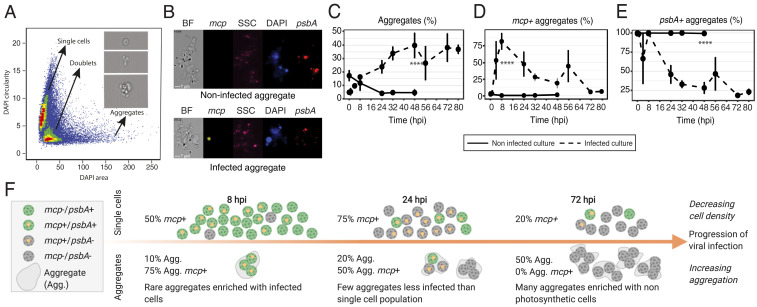
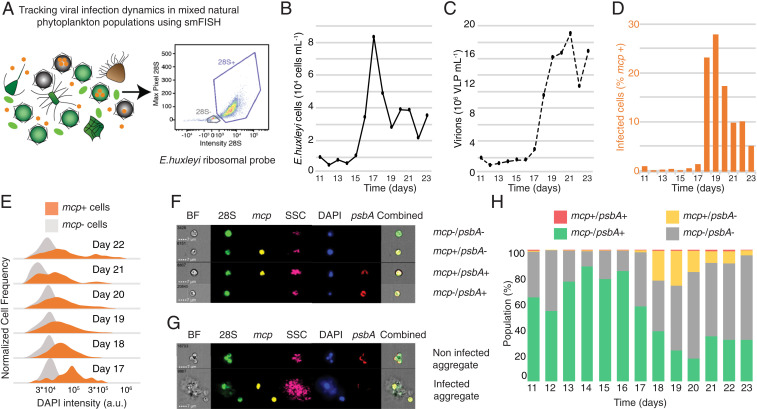
Marine viruses are the most abundant biological entity in the ocean and are considered as major evolutionary drivers of microbial life [C. A. Suttle, Nat. Rev. Microbiol. 5, 801-812 (2007)]. Yet, we lack quantitative approaches to assess their impact on the marine ecosystem. Here, we provide quantification of active viral infection in the bloom forming single-celled phytoplankton Emiliania huxleyi infected by the large virus EhV, using high-throughput single-molecule messenger RNA in situ hybridization (smFISH) of both virus and host transcripts. In natural samples, viral infection reached only 25% of the population despite synchronized bloom demise exposing the coexistence of infected and noninfected subpopulations. We prove that photosynthetically active cells chronically release viral particles through nonlytic infection and that viral-induced cell lysis can occur without viral release, thus challenging major assumptions regarding the life cycle of giant viruses. We could also assess active infection in cell aggregates linking viral infection and carbon export to the deep ocean [C. P. Laber et al., Nat. Microbiol. 3, 537-547 (2018)] and suggest a potential host defense strategy by enrichment of infected cells in sinking aggregates. Our approach can be applied to diverse marine microbial systems, opening a mechanistic dimension to the study of biotic interactions in the ocean.

Keywords: algal blooms; giant virus; single cell; smFISH; viral life cycle.


Conflict of interest statement

The authors declare no competing interest.

Figures

Fig. 1.
Fig. 1.
High-throughput visualization of active viral infection in algal virocells using mRNA smFISH. (A) Simplified workflow of sample processing and data acquisition. After initial fixation, samples were hybridized to custom-made fluorescent probes targeting the host (psbA) and the virus (mcp) mRNA and were subjected to epifluorescence microscopy (high resolution) and imaging flow cytometry (high throughput) analyses. (B and C) Epifluorescence images of an infected culture of E. huxleyi cells at 1 and 24 hpi (early and late infection, respectively) in each channel. (Scale bar: 20 μm.) In the DAPI channel, the Inset images depict segmented nuclei (see SI Appendix, Fig. S12 for a full picture). (D and E) Cell and virion concentrations, respectively, of infected and noninfected cultures during infection of E. huxleyi cells by EhV. Infection was quantified using flow cytometry at a high virus:host ratio. (F) Fraction of mcp+ and psbA+ cells in infected (dashed line) and noninfected (solid line) cultures. Values are presented as the mean ± SD, n = 3. ****P < 0.0001 tested with linear mixed model fit by REML. T-tests use Satterthwaite’s method. (G and H) Distribution of mcp and psbA fluorescence intensity values in E. huxleyi single cells acquired by ImageStreamX during a time course of viral infection. The dashed line depicts the intensity threshold used to define mcp+ and psbA+ cells according to the fluorescent intensity (103 a.u.).
Fig. 2.
Fig. 2.
Heterogeneity in transcriptional states during viral infection reveals distinct potential cell fates. (A) To investigate the heterogeneity of E. huxleyi virocells during infection, we plotted host and virus mRNA coexpression per cell at different time points of hours postinfection. The x axis represents the value of the probe intensity (in fluorescent arbitrary units) targeting the psbA host gene, and the y axis represents the value of the probe intensity targeting the viral mcp gene. Using a threshold of ∼10^3 a.u. of fluorescence to define both mcp+ (y axis) and psbA+ (x axis) cells, we define four subpopulations as a combination of mcp and psbA signals: mcp–/psbA+ (green gate), mcp+/psbA+ (red gate), mcp+/psbA– (yellow gate), and mcp–/psbA– (gray gate) (B) Relative abundance of the four subpopulations throughout the course of infection. (C) Virion production (blue) and mcp+ dynamics in the first 12 hpi (mcp+/psbA+ in red, mcp+/psbA– in yellow). (D) Fraction of cells in the population with high chlorophyll signal (Chl+) and percentage of cells with permeable membranes (Sytox+). Values are presented as the mean ± SD; n = 3. (E) Transmission electron microscopy of an infected E. huxleyi cell at 4 hpi. White arrowheads indicate budding viruses. C: chloroplast; V: immature intracellular viruses. (F) Comparison of DNA content based on DAPI intensity between the four subpopulations (with more than 25 events per population) throughout infection. Comparison of DAPI intensity was performed with a linear mixed model fit by REML. T-tests use Satterthwaite’s method. ****P < 0.0001. (G) Conceptual scheme of the potential cell fates of different subpopulations.
Fig. 3.
Fig. 3.
Quantification of viral infection within aggregates formed during infection. (A) Based on the DAPI mask area and circularity (the degree of the mask’s deviation from a circle), three populations are identified as single cells, doublets, and aggregates (aggregates are defined by a DAPI area above 60 μm2). A representative image of each population is presented in the Inset. (B) Imaging flow-cytometry images of noninfected (Top) and infected (Bottom) aggregates in the brightfield (BF), mcp (yellow), Side Scatter (SSC as a proxy for calcification, pink), DAPI (blue), and psbA (red) channels. (C) Fraction of aggregates of all DAPI+ events in infected (dashed line) and noninfected (solid line) cultures. (D and E) Quantification of mcp+ and psbA+ aggregates, respectively, throughout the time course of infected (dashed line) and noninfected (solid line) cultures. In CE, values are presented as the mean ± SD; n = 3; ****P < 0.0001 (t test). (F) Schematic representation of active infection in single cells versus aggregates throughout progression of viral infection. Illustration produced with Biorender.
Fig. 4.
Fig. 4.
Visualization of active viral infection during a natural E. huxleyi bloom. (A) Applying smFISH to track E. huxleyi virocells within mixed natural microbial populations. A probe specifically targeting the 28S ribosomal RNA of E. huxleyi was used to identify our host of interest, based on the intensity and maximum pixel of the probe signal in flow-cytometry plots, along with the mcp and psbA probes. (B and C) Abundance of calcified E. huxleyi cells and EhV-like particles (VLP), respectively, measured by flow cytometry throughout bloom succession in a mesocosm experiment. (D) Fraction of infected (mcp+) E. huxleyi virocells, measured by smFISH analysis throughout bloom succession. (E) Comparison of DAPI intensities between infected and noninfected E. huxleyi populations throughout bloom succession. (F and G) Visualizing subpopulations of E. huxleyi single cells and aggregates, respectively, using ImageStreamX (SSC: side scatter). (H) Quantification of the relative abundance of the four subpopulations in single cells throughout the bloom succession by coprobing of host and viral mRNA (psbA and mcp, respectively).

References

    1. Azam F., Microbial control of oceanic carbon flux: The plot thickens. Science 280, 694–696 (1998).
    1. Suttle C. A., Marine viruses: Major players in the global ecosystem. Nat. Rev. Microbiol. 5, 801–812 (2007). - PubMed
    1. Laber C. P., et al. ., Coccolithovirus facilitation of carbon export in the North Atlantic. Nat. Microbiol. 3, 537–547 (2018). - PubMed
    1. Fenchel T., Marine plankton food chains introduction: The classical view of plankton food chains. Annu. Rev. Ecol. Syst. 19, 19–38 (1988).
    1. Field C. B., Behrenfeld M. J., Randerson J. T., Falkowski P., Primary production of the biosphere: Integrating terrestrial and oceanic components. Science 281, 237–240 (1998). - PubMed

Publication types

LinkOut - more resources